SUMMARY:
This is the first report of success in numerically quantifying and visualizing cardiac cycle−related intracranial vessel motion and pulse waves in human subjects by using 320-detector CTA and a newly developed motion-detection algorithm to better understand the physiologies of intracranial arteries. This new technique promises to provide significant novel information for analyzing the elasticity of cerebral vessels and should be incorporated in the analysis of vessel fluid dynamics.
Intracranial vessels can now be noninvasively visualized in 3D by either MRA1,2 or CTA.3 However, these methods were developed with the objects in the FOV remaining static and not subject to external motion. Consequently, investigation of the movement or pulsation of intracranial vessels has not been possible.
From a technical point of view, to visualize and quantify the “motion” or “pulsation” of intracranial vessels, a technique with both sufficient spatial and time resolution is required, because the motion of intracranial vessels is predicted to be extremely small and the whole motion cycle concludes within a single heartbeat, or approximately 1 second.4 Taking advantage of the current most advanced CT modality, which has 320 detectors in a row within a length of 160 mm, we attempted detailed quantification and visualization of intracranial vessel motion and pulsation in conjunction with the development of a novel algorithm for 3D motion quantification.
This is the first report detailing the successful quantification and visualization of intracranial vessel motion and pulsation in a human subject.
Technique
Patients
Ten patients with intracranial aneurysms were included in this retrospective study because healthy volunteers cannot be recruited for ethical reasons and arteries without aneurysms can be approximated as normal vessels. The internal review board of Osaka University Hospital approved research use of the datasets. Detailed patient data are listed in the Table.
Patient profiles
| Patient | Age (yr) | Sex | R-R Interval Time (ms) | HR (bpm) |
|---|---|---|---|---|
| 1 | 53 | M | 1237 | 49 |
| 2 | 73 | F | 798 | 75 |
| 3 | 70 | F | 1064 | 56 |
| 4 | 65 | F | 982 | 61 |
| 5 | 70 | F | 865 | 69 |
| 6 | 73 | M | 729 | 82 |
| 7 | 67 | F | 943 | 64 |
| 8 | 69 | F | 769 | 78 |
| 9 | 77 | M | 899 | 67 |
| 10 | 68 | F | 644 | 93 |
Contrast Medium Injection Protocols and CT Acquisition
Contrast medium (ioversol [Optiray], 320 mg I/mL; Covidien Japan, Tokyo, Japan) was injected at a flow rate of 5 mL/s. A test injection of 15 mL of contrast medium was made to determine the circulation time of the MCA for contrast-enhanced imaging. According to the result of the test injection, scanning was started at the appropriate number of seconds after initiation of the contrast injection. In the actual scan, 50 mL of contrast medium was used.
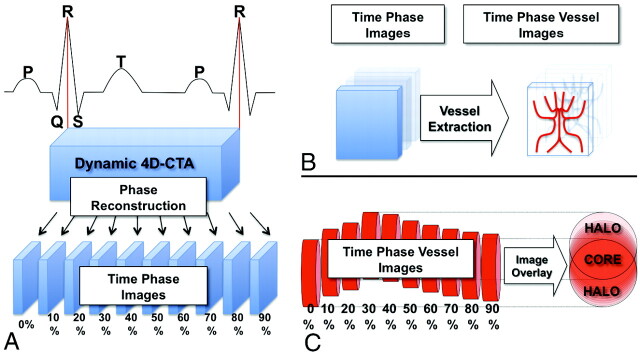
Electrocardiography-triggered CTA was performed on a 320-detector CT system (Aquilion One; Toshiba, Nasu, Japan) by using the following parameters: 120-kV tube voltage, 270-mA tube current, 350-ms gantry rotation time, 160-mm range, and >1 heartbeat. Images for this study were reconstructed by using a kernel optimized for intracranial vessel imaging (window center: each 10% of the R-R interval; image matrix, 512 × 512; section thickness, 0.5 mm; interval, 0.25 mm; section number, 640). Thus, 10 CT volume datasets were created for each patient (Fig 1A). All of the CT datasets were transferred to an off-line workstation and further analyzed by an in-house program developed by using Matlab (MathWorks, Natick, Massachusetts), as detailed below.
Fig 1.
Schematic illustration of the reconstruction of 4D dynamic CTA into time-phase images and the motion-detection algorithm. A, The window center of the time-phase image is set at each 10% of the R-R interval, and the 4D-CTA image of a single heartbeat was reconstructed into 10 phase images. B, Time-phase images were digitalized for vessel extraction. The red columns on the right represent blood vessels at each phase. They are moving and pulsating according to the cardiac cycle. All of the 10 phase images are summed into a single matrix. C, The voxels in which the vessels are always present throughout the 10 phases can be identified as the CORE, and the surrounding voxels, as the HALO.
Analysis Algorithm
First, the intracranial vessels were identified in the raw CT data by adjusting the window and level values with visual confirmation (110–1400), and values <110 or >1400 were substituted for zero, resulting in the deletion of brain tissues and most of the bone structures, leaving signals mostly from the contrast medium. Next, the value 1 was substituted for the voxels with vessels or bones, and zero, for those without. As a result, the original raw CT data of each phase was converted into a 512 × 512 × 640 matrix, consisting of zero or 1 (Fig 1B). Using this dataset, we could now measure the vessel volume within selected 3D VOI, which did not contain bone structures at each phase. Next, the 10 digital data from 1 patient were summed up into a single matrix (Fig 1C). If the intracranial vessel never moved, the summed value of the corresponding voxel was 10. However, if intracranial vessels moved, the summed value of the corresponding voxel ranged from 1 to 9. As a result, the voxels with a value of 10 were termed the “CORE” of each artery, while the surrounding voxels with values ranging from 1 to 9 were termed the “HALO” (Fig 1C).
The Motion Map
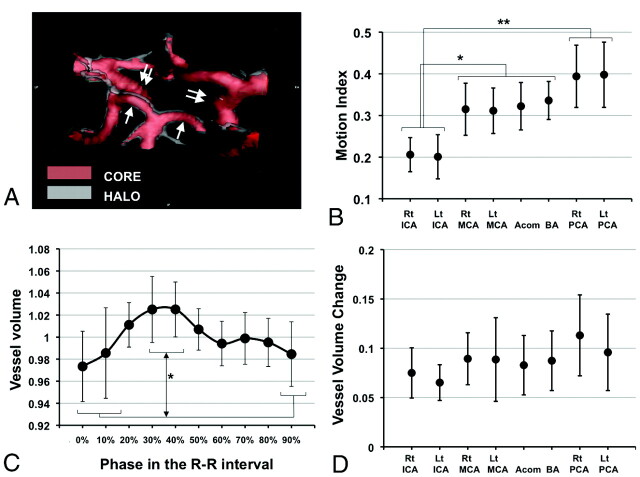
Using the above-mentioned algorithm, the original CTA image was converted into a new image, which visualized both the CORE and the HALO of the vessels (Fig 2A). We have named this image the “motion map.”
Fig 2.
The motion map, motion index, and arterial pulse wave of the intracranial arteries. A, A posterior-cranial view of the motion map around the circle of Willis in patient 3 is shown. Red indicates the CORE, and translucent white indicates the HALO. The HALO of the bilateral P1 segment of the PCAs (white arrow) is thicker than that of the bilateral supraclinoid portion of the ICAs (double white arrows), indicating a difference in the magnitude of motion of each vessel. B, The mean ± SD of the motion index in VOI of the major cerebral vessels of the 10 subjects is shown. C, The mean ± SD of a vessel volume change in the left PCA during a single heartbeat for the 10 subjects is shown. This curve resembles a carotid artery pulse wave as well as an aortic pulse wave. D, The mean ± SD of the vessel volume change in the 10 subjects in each region of interest is shown. There is no significant difference in the amplitude among the VOI. The asterisk indicates P < .05; double asterisks, P < .001.
The Motion Index
To numerically quantify the magnitude of vessel motion, we defined the “motion index” as follows.
 |
Theoretically the motion index will positively correspond to the motion of the vessels within the VOI. Eight VOI were manually selected in and around the circle of Willis while avoiding bone structures (On-line Fig 1). These locations were chosen because they can be easily identified anatomically.
Statistical Analysis
Statistical analysis was performed by using JMP software (SAS, Cary, North Carolina). Multiple comparisons were analyzed with analysis of variance, followed by the Tukey-Kramer Honestly Significant Difference test for individual comparisons. P < .05 was considered statistically significant.
Discussion
Our primary objective in this study was to numerically quantify the motion and pulsation of the intracranial arteries during a single heartbeat by using 320-detector CT technology and a newly developed motion-detection algorithm.
First, we were able to visualize the extent of vessel motion in 3D. A representative motion map around the circle of Willis in patient 3 is shown in Fig 2A and On-line Video 1. This image, termed a “motion map,” allows easy visualization of the magnitude of the motion at each arterial location. Numeric comparison of the motion of the cerebral arteries was also possible by using the motion index (Fig 2B). We also found that the motion indexes of the bilateral ICAs were significantly smaller than these of the other vessels (P < .05), while the bilateral PCAs showed significantly larger motion indexes compared with the bilateral ICAs (P < .001). These data indicate that the motion of the P1 segment of the PCA is the largest, while that of the ICA is the smallest, which corresponds very well with the 4D motion movie (On-line Video 2).
Because the motion index could be influenced not only by the movement of the vessel but also by the change in vessel volume during the cardiac cycle, vessel-volume change was also investigated. As evident in Fig 2C, reproduction of the cardiac cycle−related pulse waves of the cerebral arteries was possible. The highest peak was identified at the time phase of 30%–40% of the R-R interval, while the lowest peak was identified at 90%–0%. The volume change between the highest and lowest peak was statistically significant in all examined vessels except the left MCA (On-line Fig 5). Moreover, the observed unique 2-peak pulse wave was similar to the shape of already known cervical arterial and aortic pulse waves (Fig 2C).5 Because there were no significant differences in the amplitude of the change in vessel volume among the VOI and the changes in vessel volume were within only 8.7% on average (Fig 2D), the influence of this factor on the motion index is considered minimal and the significant differences in the motion indexes among the VOI can be considered to derive from the differences in movements themselves.
In conclusion, we developed a novel technique for the visualization and quantification of intracranial vessel motion and pulsation in human subjects. This technique has the potential to provide important novel information for understanding the physiologies of intracranial arteries.
Supplementary Material
ABBREVIATIONS
- Acom
anterior communicating artery
- BA
basilar artery
- bpm
beats per minute
- CORE
voxels with a value of 10
- CTA
CT angiography
- FOV
field of view
- HALO
surrounding voxels with values ranging from 1 to 9
- HR
heart rate
- ICA
internal carotid artery
- Lt
left
- MCA
middle cerebral artery
- MRA
MR angiography
- PCA
posterior cerebral artery
- Rt
right
- VOI
voxels of interest
Footnotes
This work was supported by the Konika Minolta Imaging Science Foundation, the Association for Nuclear Technology in Medicine, and a Grant-in-Aid for Scientific Research from the Ministry of Education, Science and Culture of Japan.
References
- 1. Ross JS, Masaryk TJ, Modic MT, et al. Magnetic resonance angiography of the extracranial carotid arteries and intracranial vessels: a review. Neurology 1989;39:1369–76 [DOI] [PubMed] [Google Scholar]
- 2. Ross JS, Masaryk TJ, Modic MT, et al. Intracranial aneurysms: evaluation by MR angiography. AJR Am J Roentgenol 1990;155:159–65 [DOI] [PubMed] [Google Scholar]
- 3. Prokop M. Multislice CT angiography. Eur J Radiol 2000;36:86–96 [DOI] [PubMed] [Google Scholar]
- 4. Quarteroni A, Formaggia L. Mathematical Modeling and Numerical Simulation of the Cardiovascular System. Amsterdam, the Netherlands: Elsevier; 2004 [Google Scholar]
- 5. O'Rourke MF, Pauca A, Jiang XJ. Pulse wave analysis. Br J Clin Pharmacol 2001;51:507–22 [DOI] [PMC free article] [PubMed] [Google Scholar]
Associated Data
This section collects any data citations, data availability statements, or supplementary materials included in this article.


