

Abstract
BACKGROUND AND PURPOSE:
Diffusion kurtosis is a statistical measure for quantifying the deviation of the water diffusion profile from a Gaussian distribution. The current study evaluated the time course of diffusion kurtosis in patients with cerebral infarctions, including perforator, white matter, cortical, and watershed infarctions.
MATERIALS AND METHODS:
Subjects were 31 patients, representing 52 observations of lesions. The duration between the onset and imaging ranged from 3 hours to 122 days. Lesions were categorized into 4 groups listed above. Diffusion kurtosis images were acquired with b-values of 0, 1000, and 2000 s/mm2 applied in 30 directions; variables including DWI signal, ADC, fractional anisotropy, radial diffusivity, axial diffusivity, radial kurtosis, and axial kurtosis, were obtained. The time courses of the relative values (lesion versus contralateral) for these variables were evaluated, and the pseudonormalization period was calculated.
RESULTS:
Diffusion kurtosis was highest immediately after the onset of infarction. Trend curves showed that kurtosis decreased with time after onset. Pseudonormalization for radial/axial kurtosis occurred at 13.2/59.9 days for perforator infarctions, 33.1/40.6 days for white matter infarctions, 34.8/35.9 days for cortical infarctions, and 34.1/28.2 days after watershed infarctions. For perforator infarctions, pseudonormalization occurred in the following order: radial kurtosis, ADC, axial kurtosis, and DWI.
CONCLUSIONS:
Diffusion kurtosis variables in lesions increased early after infarction and decreased with time. Information provided by diffusion kurtosis imaging, including axial and radial kurtosis, seems helpful in conducting a detailed evaluation of the age of infarction, in combination with T2WI, DWI, and ADC.
Kurtosis is a descriptor of the “peakedness” of a variable relative to a Gaussian probability distribution. Higher kurtosis means that the distribution has a distinct peak near the mean and has heavy distribution tails, which are closely associated with diffusional heterogeneity.1,2 Diffusion kurtosis can be calculated by a combination of >3 different strengths (b-values) of motion-probing gradients, by using cumulate expansion within a clinically feasible imaging time.2 Diffusion kurtosis imaging (DKI) is reported to provide better characterization of normal and pathologic tissue, and it is less susceptible to free fluid contamination compared with mean diffusivity or fractional anisotropy (FA) provided by the diffusion tensor method.
DKI has recently been applied clinically for patients with ischemic stroke.1,3 Hui et al reported that diffusion kurtosis increased in the acute-to-subacute phase after stroke onset.4 They found that for lesions with strongly oriented axon bundles, the change in kurtosis along the direction of the fibers was greater than that occurring perpendicular to the direction of the fibers, and they speculated that this was due to a large decrease in the intra-axonal diffusivity.3 However, to the best of our knowledge, the time course of diffusion kurtosis in humans has not been reported. The purpose of the current study was to evaluate the time course of diffusion kurtosis in patients with 4 types of infarctions, including perforator, white matter, cortical, and watershed infarctions, and to evaluate the period for pseudonormalization in the variables, including diffusion kurtosis. To evaluate the relationship between fiber bundle direction and changes in diffusion kurtosis, we attempted to evaluate diffusion kurtosis measured along the principal kurtosis eigenvector (axial kurtosis [Kax]) and that measured perpendicular to the principal kurtosis eigenvector (radial kurtosis [Krad]).
Materials and Methods
Subjects of this prospective study comprised patients with cerebral infarction who underwent DKI between January and December 2012. Fifty-three patients were initially enrolled, but 22 were excluded due to the following criteria: 1) inability to determine the time of infarction onset, 2) treatment with thrombolytic agents, and 3) hemorrhage within the region of the infarction. Thirty-one patients (10 women and 21 men; 51–87 years of age) were therefore included in the analysis. Among these patients, 6 had >1 study for follow-up (5 patients had 2 studies and 1 had 4). Six patients had 2 lesions, 2 patients had 4, and we undertook 2 observations of 9 lesions and 4 of 1 lesion. Thus, 31 patients, representing 40 lesions and 52 observations with a known onset time, were included in the current analysis. The duration between infarction onset and imaging ranged from 3 hours to 122 days.
Imaging was performed with a 3T clinical scanner (Magnetom Verio; Siemens, Erlangen, Germany). The images obtained included T2WI (turbo spin-echo: TR = 4500 ms, TE = 90 ms, flip angle = 145°, FOV = 230 × 230 mm, matrix = 512 × 512, section thickness = 4.5 mm) and DKI (echo-planar: TR = 6600 ms, TE = 89 ms, b=0, 1000, 2000 s/mm2, motion-probing gradient = 30 directions, FOV = 230 mm, matrix = 94 × 94, section thickness = 3 mm, acquisition time = 7.02 minutes [prototype product, provided by Siemens]). Motion correction by using rigid-body transformation was applied to the sequence. Output images from the diffusion kurtosis sequence included DWI, ADC, and fractional anisotropy, radial diffusivity (Drad, the diffusion coefficient perpendicular to the principal diffusion tensor eigenvector), axial diffusivity (Dax, the diffusion coefficient along the principal diffusion tensor eigenvector), Krad (diffusion kurtosis perpendicular to the principal diffusion tensor eigenvector), and Kax (diffusion kurtosis along the principal diffusion tensor eigenvector). Computation was performed automatically on the console workstation of the scanner immediately after scan completion. DWI, ADC, Drad, and Dax were calculated from the data by using b=1000 s/mm2.
We categorized the lesions into 4 groups according to DWI: perforator infarctions, white matter territorial infarctions, cortical infarctions, and watershed infarctions. “Perforator infarctions” were defined as lesions smaller than 2 cm in diameter that were located in the perforator territory of the middle cerebral, basilar, or vertebral arteries. Thus, perforator infarctions included those in the basal ganglia, thalami, internal capsule, corona radiata, and brain stem. Territorial infarctions were defined as ischemic lesions that involved both the cortical and subcortical areas corresponding to an arterial territory. The term “white matter territorial infarction” was used for a lesion within the subcortical white matter of a territorial infarction. “Cortical infarction” signified a large cortical lesion that was part of a territorial infarction or a small lesion limited to the cortex. “Watershed infarctions” were defined as lesions occurring in the supraganglionic periventricular white matter within the borderzones of territories of >1 major artery. We diagnosed watershed infarctions by using DWI according to the templates of Bogousslavsky and Regli.5
Region-of-interest analysis was performed for lesions identified on DWI for each of the 4 groups. ROIs included the infarction lesion and consisted of areas with pixel values larger than 2 SDs of the contralateral side; ambiguous pixels were not included. The ROIs were selected by consensus among 3 neuroradiologists with 24, 17, and 8 years' experience. For all variables (T2WI signal, DWI signal, ADC, FA, Drad, Dax, Krad, and Kax), measurements were performed by averaging all pixels within the ROIs. For each variable, the ratio of the mean measurement in the region of interest in the ischemic tissue to that in the corresponding region of interest in the contralateral hemisphere was then calculated. The latter region of interest was set as an ellipsoid of the same size with an area corresponding to that of the lesion. In this way, T2WI signal ratio, DWI signal ratio, ADC ratio, FA ratio, Drad ratio, Dax ratio, Krad ratio, and Kax ratio were determined.
To evaluate gross changes in DKI with time in acute infarctions, we evaluated ratios of T2WI signal, DWI signal, ADC, FA, Drad, Dax, Krad, and Kax for the lesions at 2 time points: 1) within 10 days after infarction onset (early group, 31 observations) and 2) ≥11 days from the onset of infarction (late group, 21 observations), regardless of the type and location of infarctions. T tests were used to determine differences in these ratios between the early and late groups. Probability values < .05 were considered statistically significant.
To evaluate changes with time, we plotted the ratios of the above variables against duration (days) after infarction onset for the 4 infarction groups. To capture the period of pseudonormalization, we fitted the trend in each variable ratio to a line, by using the linear least-squares method, and we evaluated the time (days) for pseudonormalization of these variables by calculating when each ratio crossed the value of 1. We compared this pseudonormalization time for each variable and used t tests to determine whether the time points were statistically significantly different. We also calculated the absolute values of Krad and Kax.
Results
Gross changes in DKI variables with time in acute infarctions between the early group and late group, regardless of the type and location of infarctions, are expressed as means as follows. Ratios of T2WI signal, ADC, Drad, and Dax were significantly greater in the late group than in the early group (T2WI signal—early versus late: 1.71 ± 0.39 versus 2.00 ± 0.47, P < .05; ADC: 1.39 ± 0.80 versus 0.63 ± 0.14, P < .001; Drad: 1.40 ± 0.65 versus 0.72 ± 0.21, P < .001; Dax: 1.12 ± 0.52 versus 0.68 ± 0.18, P < .01). Ratios of DWI signal, FA, Krad, and Kax were significantly greater in the early group than the late group (DWI signal—early versus late: 2.49 ± 0.67 versus 1.42 ± 0.99, P < .001; FA: 0.77 ± 0.41 versus 0.53 ± 0.31, P < .05; Krad: 1.45 ± 0.70 versus 0.79 ± 0.31, P < .001; and Kax: 1.88 ± 0.74 versus 1.07 ± 0.41, P < .001).
The breakdown of infarction type in the current study was as follows—perforator infarction: 18 patients, 19 lesions (corona radiata, 12; internal capsule, 3; caudate, 1; thalamus, 1; brain stem, 2) and 25 observations; white matter territorial infarction: 6 patients, 6 lesions (frontal, 3; parietal, 2; occipital, 1) and 8 observations; cortical infarction: 11 patients, 11 lesions (frontal, 6; parietal, 2; temporal, 1; and occipital, 2) and 15 observations; and watershed infarction: 3 patients, 4 lesions (corona radiata, 4) and 4 observations. Figure 1 shows a representative patient for whom serial images could be obtained 4 times (a 76-year-old woman with a perforator infarction).
Fig 1.

MR images from a 76-year-old woman with a right corona radiata infarction. Images (T2WI, DWI, ADC, Krad, Kax) were acquired on days 2, 10, 16, and 30 after onset of infarction. On T2WI, the lesion showed uniform high signal intensity. DWI demonstrated a prominent high-signal-intensity area, particularly on the image from day 2. The signal retained its high intensity even on the image from day 30. ADC was low immediately after infarction, and this became less obvious on the images from days 16 and 30. The white matter exhibited high Krad; in this case, the infarction showed higher values compared with the contralateral normal region. This elevation in Krad decreased soon after the infarction, and on the image from day 16, Krad was lower than that in the normal region. Kax values were similar in both white and gray matter, and Kax images appeared homogeneous. The infarction lesion showed a very high Kax value compared with the normal region immediately after the onset of infarction, but this soon diminished to the negative value shown in the later images.
The time courses of the ratios of variables in the 4 groups are compared in Fig 2, in which a logarithmic scale was used for the time axis. Figure 3 shows the absolute values of Krad and Kax, with a logarithmic scale for the time axis. The plot for the T2WI signal ratio shows increased signal intensity with time after infarction onset in the perforator infarction, white matter territorial infarction, and cortical infarction groups. In these 3 groups, we noted the following patterns: DWI signal ratio was higher immediately after infarction onset and thereafter decreased with time. The ADC ratio tended to be lowest immediately after onset and increased with time, with faster pseudonormalization than in DWI signal ratio. Although the FA ratio tended to diminish with time, the trend was less obvious than for other variables. Drad and Dax ratios were lowest immediately after onset and increased with time, with a faster increase in Drad than in Dax. Krad and Kax ratios were highest immediately after onset and decreased with time, with a faster decrease in Krad than in Kax. The watershed infarction group, which had only 4 data points, did not show an obvious trend according to duration after infarction for DWI, ADC, T2WI, and FA ratios, with a low coefficient of determinations (R2). On the other hand, Krad and Kax ratios in this group were higher immediately after onset and decreased with time. There was also an increasing trend in the Drad ratio of the watershed infarction group.
Fig 2.

Plot of ratios (lesion versus normal tissue) of each variable and duration after onset of infarction. Linear regression lines are provided with their coefficient of determination (R2). Because a logarithmic scale was used for the time axis, the first-order linear regression lines are drawn as exponential curves. A, Perforator infarction group. B, White matter territorial infarction group. C, Cortical infarction group. D, Watershed infarction group. For each variable (T2WI signal, DWI signal, ADC, FA, Drad, Dax, Krad, and Kax), the ratio of the value in the lesion compared with that in the contralateral normal tissue was plotted against time after infarction (days). The times at which pseudonormalization occurred are indicated by arrows. In general, T2WI showed increased signal intensity with time after infarction onset. DWI signal tended to be higher immediately after onset and decreased with time after infarction onset. ADC was lowest soon after onset and increased with time. Fractional anisotropy diminished throughout the observation period. Drad and Dax were lowest immediately after onset and increased with time; this increase was faster in Drad. Krad and Kax were highest immediately after onset and decreased with time.
Fig 3.

The absolute values of Krad and Kax (a logarithmic scale was used for the time axis). As was the case for the ratios, absolute values of these diffusion kurtosis variables were highest in the acute-to-subacute period and decreased until pseudonormalization, after which they fell further in the chronic period.
For all variables other than T2WI signal and FA ratio, which did not show pseudonormalization, we evaluated the time for pseudonormalization by finding the point at which the fitted line crossed the line representing a ratio of 1.0. For perforator infarctions, pseudonormalization occurred at 67.2 days for DWI signal ratio, 22.9 days for ADC ratio, 15.9 days for Drad ratio, 37.3 days for Dax ratio, 13.2 days for Krad ratio, and 59.9 days for Kax ratio. For white matter territorial infarction, pseudonormalization occurred at 40.4 days for DWI signal ratio, 16.5 days for ADC ratio, 25.3 days for Drad ratio, 25.2 days for Dax ratio, 33.1 days for Krad ratio, and 40.6 days for Kax ratio. For cortical infarction, pseudonormalization occurred at 33.2 days for DWI signal ratio, 14.3 days for ADC ratio, 13.8 days for Drad ratio, 13.6 days for Dax ratio, 34.8 days for Krad ratio, and 35.9 days for Kax ratio. Although it consisted of only 4 time points, for watershed infarction, pseudonormalization was calculated to occur at 84.0 days for DWI signal ratio, 64.2 days for ADC ratio, 28.1 days for Drad ratio, 76.1 days for Dax ratio, 34.1 days for Krad ratio, and 28.2 days for Kax ratio. The pseudonormalization periods in all 4 groups are indicated by the numbers and arrows in Fig 2; Fig 4 shows the pseudonormalization periods with their SDs and the statistical difference (P < .01) between the variables.
Fig 4.
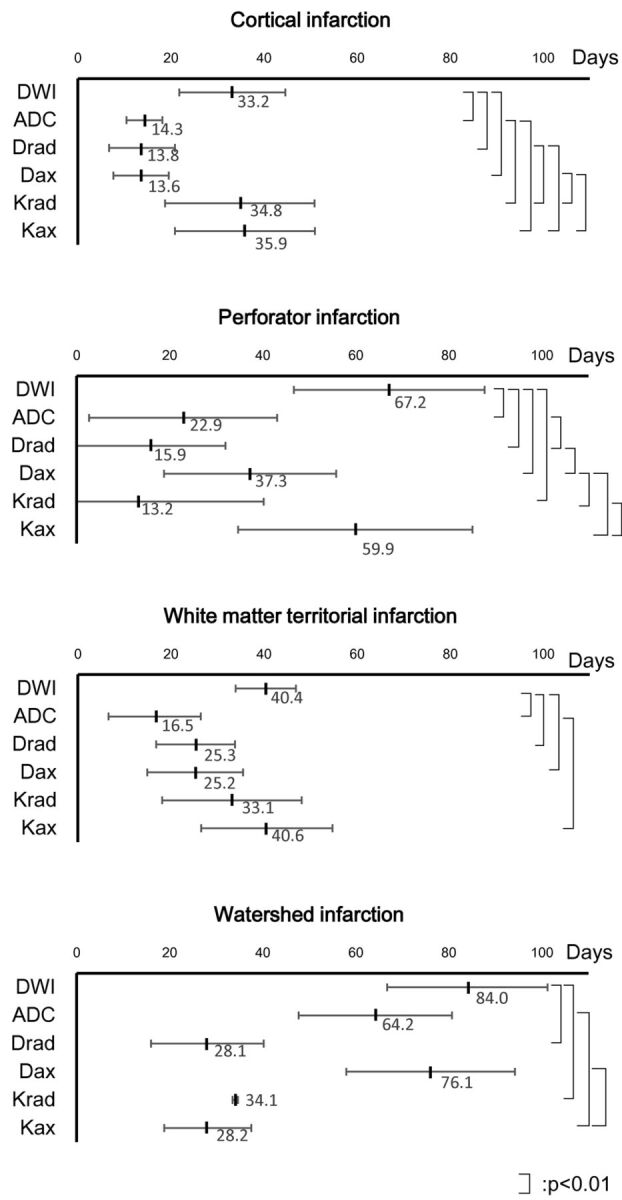
Pseudonormalization periods and their statistically significant differences between variables. Pseudonormalization periods of the 4 groups are shown with their SDs. A linear scale is used for the time axis. Statistical differences (P < .01) between the variables are shown.
Discussion
The major hypothesis underlying the conventional diffusion imaging method is that diffusion shows a Gaussian distribution.6,7 Although this hypothesis generally reflects tissue characteristics for clinical requirements, this conventional model cannot be used for complex microstructures within the tissue, including multiple barrier structures that lead to diffusion deviating from the Gaussian distribution. Acquiring the probability distribution of the water molecule can provide information about a complex barrier structure and help overcome this limitation of Gaussian modeling for diffusion imaging. Dedicated model-free methods for quantifying diffusion have been introduced, including q-space imaging, Q-ball imaging, and diffusion spectrum imaging, all of which place high demands on scanner hardware and require long acquisition periods.8 Diffusion kurtosis is one way to analyze non-Gaussian distribution of the water molecule within tissues2,9 and can be regarded as a biomarker of tissue heterogeneity.2 Jensen and Helpern1 and Jensen et al2 reported that increased kurtosis in an ischemic lesion indicates an increase in the complexity or heterogeneity of the water microenvironment in the tissue. On the other hand, in an experimental model study exploring the time course of traumatic brain injury lesions, diffusion kurtosis was reported to increase in the subacute period, and this was shown to be associated with greater reactive astrogliosis.10
In the current study, the time course of T2WI and DWI signal and ADC showed a similar tendency to previous reports, in which the T2WI shows continuous high signal, while DWI shows high signal and ADC shows lower values in the early stage followed by pseudonormalization.11–13 FA showed lower values and did not show pseudonormalization as reported in previous studies.14,15 The plots in the current study suggested that the white matter infarctions generally showed higher ratios of diffusion kurtosis values soon after infarction onset, with the values falling to a level lower than those in normal tissue. These findings were similar to tendencies shown in an experimental study of infarctions in rats, in which diffusion kurtosis showed a higher value until 7 days after occlusion, whereas mean diffusivity showed pseudonormalization at days 1–2.8 Specifically, when lesions in the current study were observed within a week after onset, the relative value of Kax, which represents diffusion kurtosis values along the principal diffusion kurtosis eigenvector, was higher than that of Krad. This observation suggests that the diffusive inhomogeneity of the axon direction increases in the early stage after infarction and exceeds that of diffusion kurtosis perpendicular to the fiber. In a preliminary human study, Jensen et al3 reported that white matter infarction showed increased diffusion kurtosis with strong dependence on fiber tract orientation. They showed large increases in Kax in conjunction with small increases in Krad and speculated that these findings were due to large changes in intra-axonal diffusivity, which might have been related to either axonal varicosities or alterations associated with the endoplasmic reticulum. As shown in their report, the observed change in diffusion kurtosis was likely the result of the difference in membrane permeability at different time points after infarction onset.
We have observed the time courses for 4 different groups, including perforator, white matter, cortical, and watershed infarctions. For the perforator infarction group, in which most of the lesions (17 of 19) were located in the white matter, the time to pseudonormalization shown by lines fitted by using the linear least-squares method was the shortest for Krad, followed by Drad, ADC, Dax, Kax, and DWI signal, in increasing order. As shown in Fig 2A, ratios of Kax in this group tended to be larger than those of Krad in the early stage. Because the lesions in this group were small and most of the lesions in this group were located in the white matter, the lesion may be regarded as white matter infarction consisting of uniform fiber direction. In that sense, larger Kax can be explained by focal enlargement of axons as a result of osmotic imbalance, known as axonal swelling or “beading,” which reduces the overall diffusivity along the fiber.4,16 For both diffusivity and diffusion kurtosis, the values perpendicular to the nerve fiber (Drad, Krad) showed pseudonormalization earlier than those along the nerve fibers (Dax, Kax) in the perforator infarction group. This agreement may occur because the changes in the diffusivity observed in infarcted white matter may be dominated by the changes in diffusion kurtosis, and the alteration of water diffusivity may be mainly due to a drop in the intra-axonal diffusivity. Thus, infarction may have a greater effect on the interior of the axon than on its exterior.4 In contrast, in the other groups including white matter, cortical, and watershed infarctions, earlier pseudonormalization in Drad or Krad compared with Dax or Kax was not clearly apparent. For cortical infarctions, this was probably due to the tissue structure, which lacks a uniform nerve fiber direction. In white matter infarctions including white matter territorial infarctions and watershed infarctions, the area of infarction contained a larger area with a variety of directions of fibers, which might have led to a difference in pseudonormalization between Drad/Krad and Dax/Kax.
The time course of diffusivity in infarcted tissue has previously been reported. One study found that signal intensity on DWI normalized approximately 14 days after symptom onset,12 while another concluded that this variable normalized at 57 days and that the T2 shinethrough effect had a large contribution to the total infarct signal intensity— that is, the signal intensity of infarctions on DWI is mainly influenced by T2 relaxation and ADC.17 ADC values decrease immediately after the onset of infarction, which is followed by pseudonormalization.11,13,18–20 The reported period for ADC pseudonormalization varies among the types of infarction. Warach et al19 reported pseudonormalization of ADC 5–10 days following an ischemic stroke. Huang et al13 reported that ADC pseudonormalization following thromboembolic infarction began about 10 days after symptom onset but that this did not occur until about 1 month after symptom onset in watershed infarction. Due to the predictable time course of ADC after infarction, the age of an infarction can be estimated by using ADC.21
Similarly, in the present study, pseudonormalization for ADC occurred later in watershed infarctions than in territorial or other types of infarctions. Pseudonormalization of diffusion kurtosis in experimental infarctions in rats has been demonstrated by Hui et al.8 Although the progression of events after an ischemic insult in small animals such as rats is faster than that in humans and this model is, therefore, not directly comparable with the clinical situation, they reported that pseudonormalization of mean diffusion kurtosis occurred on day 7 after infarction onset, while that of mean diffusivity occurred on days 1–2. It was reported that the pseudonormalization of mean diffusivity could simply be due to vasogenic edema rather than to microstructural alterations and that this type of pseudonormalization was subject to error due to contamination from cerebral spinal fluid, whereas diffusion kurtosis might be a measure of specific structural changes during the degeneration process.8 In clinical practice, the information obtained from diffusion kurtosis measurement seems to be especially useful in cases with small white matter infarctions as shown in the perforator group in the “Results” of the current study. The earlier pseudonormalization can help in detailed evaluation of the age of the infarction, in combination with T2WI, DWI, and ADC.
The current study has several limitations. The major limitation is the small number of cases. In particular, the number of lesions examined within 1 day after infarction onset was low; therefore, we could not evaluate the hyperacute phase in which increasing signal intensity on DWI and decreasing ADC are reported.22 Although diffusion kurtosis has also shown a tendency to increase immediately after infarction in an experimental study of rats,8 we could not show clear data to support this phenomenon in this series of patients. The number of patients with watershed infarction was also low, so the plots of ratios or pseudonormalization periods of variables might be less reliable than those for the other lesion types. Another limitation is that the characteristics of the lesions were rather heterogeneous. Although we categorized the lesions into 4 groups (perforator infarction, white matter territorial infarction, cortical infarction, and watershed infarction), we did not evaluate lesions separately according to their size or precise location. Regarding technical matters, the imaging sequence we used contained no eddy-current correction; however, because a twice-refocused sequence was used, eddy-current distortion was considered negligible. We used single b-value (1000 s/mm2) for calculation of DWI, ADC, Drad, and Dax, instead of using DKI-derived diffusion metrics because of the limitation of our software. Therefore, we could not report on the differences between DTI-derived and DKI-derived diffusion metrics.
Conclusions
Diffusion kurtosis variables in lesions increased early after infarction and decreased earlier than DWI variables did. Krad showed pseudonormalization earlier than ADC did, and the pseudonormalization of Kax occurred a little later than that of ADC. Because DKI can have a different time course after the onset of infarction compared with DWI or ADC, additional information on white matter tissue infarction can be provided by using this imaging technique. Specifically, information provided by DKI, including Kax and Krad, appears helpful in conducting a detailed evaluation of the age of the infarction, in combination with T2WI, DWI, and ADC.
ABBREVIATIONS:
- Dax
axial diffusivity
- Drad
radial diffusivity
- DKI
diffusion kurtosis imaging
- FA
fractional anisotropy
- Kax
axial kurtosis
- Krad
radial kurtosis
Footnotes
Disclosures: Toshiaki Taoka—RELATED: Grant: Grant-in-Aid for Scientific Research (KAKENHI) Japan,* Comments: To Nara Medical University. *Money paid to the institution.
REFERENCES
- 1. Jensen JH, Helpern JA. MRI quantification of non-gaussian water diffusion by kurtosis analysis. NMR Biomed 2010;23:698–710 [DOI] [PMC free article] [PubMed] [Google Scholar]
- 2. Jensen JH, Helpern JA, Ramani A, et al. Diffusional kurtosis imaging: the quantification of non-Gaussian water diffusion by means of magnetic resonance imaging. Magn Reson Med 2005;53:1432–40 [DOI] [PubMed] [Google Scholar]
- 3. Jensen JH, Falangola MF, Hu C, et al. Preliminary observations of increased diffusional kurtosis in human brain following recent cerebral infarction. NMR Biomed 2011;24:452–57 [DOI] [PMC free article] [PubMed] [Google Scholar]
- 4. Hui ES, Fieremans E, Jensen JH, et al. Stroke assessment with diffusional kurtosis imaging. Stroke 2012;43:2968–73 [DOI] [PMC free article] [PubMed] [Google Scholar]
- 5. Bogousslavsky J, Regli F. Unilateral watershed cerebral infarcts. Neurology 1986;36:373–77 [DOI] [PubMed] [Google Scholar]
- 6. Le Bihan D. Looking into the functional architecture of the brain with diffusion MRI. Nat Rev Neurosci 2003;4:469–80 [DOI] [PubMed] [Google Scholar]
- 7. Le Bihan D, Mangin JF, Poupon C, et al. Diffusion tensor imaging: concepts and applications. J Magn Reson Imaging 2001;13:534–46 [DOI] [PubMed] [Google Scholar]
- 8. Hui ES, Du F, Huang S, et al. Spatiotemporal dynamics of diffusional kurtosis, mean diffusivity and perfusion changes in experimental stroke. Brain Res 2012;1451:100–09 [DOI] [PMC free article] [PubMed] [Google Scholar]
- 9. Hori M, Fukunaga I, Masutani Y, et al. Visualizing non-Gaussian diffusion: clinical application of q-space imaging and diffusional kurtosis imaging of the brain and spine. Magn Reson Med Sci 2012;11:221–33 [DOI] [PubMed] [Google Scholar]
- 10. Zhuo J, Xu S, Proctor JL, et al. Diffusion kurtosis as an in vivo imaging marker for reactive astrogliosis in traumatic brain injury. Neuroimage 2012;59:467–77 [DOI] [PMC free article] [PubMed] [Google Scholar]
- 11. Schlaug G, Siewert B, Benfield A, et al. Time course of the apparent diffusion coefficient (ADC) abnormality in human stroke. Neurology 1997;49:113–19 [DOI] [PubMed] [Google Scholar]
- 12. Burdette JH, Ricci PE, Petitti N, et al. Cerebral infarction: time course of signal intensity changes on diffusion-weighted MR images. AJR Am J Roentgenol 1998;171:791–95 [DOI] [PubMed] [Google Scholar]
- 13. Huang IJ, Chen CY, Chung HW, et al. Time course of cerebral infarction in the middle cerebral arterial territory: deep watershed versus territorial subtypes on diffusion-weighted MR images. Radiology 2001;221:35–42 [DOI] [PubMed] [Google Scholar]
- 14. Axer H, Grassel D, Bramer D, et al. Time course of diffusion imaging in acute brainstem infarcts. J Magn Reson Imaging 2007;26:905–12 [DOI] [PubMed] [Google Scholar]
- 15. Harris AD, Pereira RS, Mitchell JR, et al. A comparison of images generated from diffusion-weighted and diffusion-tensor imaging data in hyper-acute stroke. J Magn Reson Imaging 2004;20:193–200 [DOI] [PubMed] [Google Scholar]
- 16. Murphy TH, Li P, Betts K, et al. Two-photon imaging of stroke onset in vivo reveals that NMDA-receptor independent ischemic depolarization is the major cause of rapid reversible damage to dendrites and spines. J Neurosci 2008;28:1756–72 [DOI] [PMC free article] [PubMed] [Google Scholar]
- 17. Eastwood JD, Engelter ST, MacFall JF, et al. Quantitative assessment of the time course of infarct signal intensity on diffusion-weighted images. AJNR Am J Neuroradiol 2003;24:680–87 [PMC free article] [PubMed] [Google Scholar]
- 18. Warach S, Chien D, Li W, et al. Fast magnetic resonance diffusion-weighted imaging of acute human stroke. Neurology 1992;42:1717–23 [DOI] [PubMed] [Google Scholar]
- 19. Warach S, Gaa J, Siewert B, et al. Acute human stroke studied by whole brain echo planar diffusion-weighted magnetic resonance imaging. Ann Neurol 1995;37:231–41 [DOI] [PubMed] [Google Scholar]
- 20. Schwamm LH, Koroshetz WJ, Sorensen AG, et al. Time course of lesion development in patients with acute stroke: serial diffusion- and hemodynamic-weighted magnetic resonance imaging. Stroke 1998;29:2268–76 [DOI] [PubMed] [Google Scholar]
- 21. Lansberg MG, Thijs VN, O'Brien MW, et al. Evolution of apparent diffusion coefficient, diffusion-weighted, and T2-weighted signal intensity of acute stroke. AJNR Am J Neuroradiol 2001;22:637–44 [PMC free article] [PubMed] [Google Scholar]
- 22. Fiebach JB, Jansen O, Schellinger PD, et al. Serial analysis of the apparent diffusion coefficient time course in human stroke. Neuroradiology 2002;44:294–98 [DOI] [PubMed] [Google Scholar]