Abstract
BACKGROUND AND PURPOSE:
The advent of low-porosity endoluminal devices, also known as flow diverters, exemplified by the Pipeline in the United States, produced the greatest paradigm shift in cerebral aneurysm treatment since the introduction of detachable coils. Despite robust evidence of efficacy and safety, key questions regarding the manner of their use remain unanswered. Recent studies demonstrated that the Pipeline device geometry can dramatically affect its metal coverage, emphasizing the negative effects of oversizing the device relative to its target vessels. This follow-up investigation focuses on the geometry and coverage of multidevice constructs.
MATERIALS AND METHODS:
A number of Pipeline devices were deployed in tubes of known diameters and photographed, and the resultant coverage was determined by image segmentation. Multidevice segmentation images were created to study the effects of telescoped devices and provide an estimate of coverages resulting from device overlap.
RESULTS:
Double overlap yields a range of metal coverage, rather than a single value, determined by the diameters of both devices, the size of the recipient artery, and the degree to which strands of the overlapped devices are coregistered with each other. The potential variation in coverage is greatest during overlap of identical-diameter devices, for example, ranging from 24% to 41% for two 3.75-mm devices deployed in a 3.5-mm vessel. Overlapping devices of progressively different diameters produce correspondingly more uniform ranges of coverage, though reducing the maximum achievable value, for example, yielding a 33%–34% range for 3.75- and 4.75-mm devices deployed in the same 3.5-mm vessel.
CONCLUSIONS:
Rational strategies for building multidevice constructs can achieve favorable geometric outcomes.
Use of endoluminal constructs such as the Pipeline Embolization Device (PED; Covidien, Irvine, California) remains characterized by heterogeneity in the selection of device size, number, and deployment technique. The average number of devices used in a particular case is, in part, determined by the size, shape, and location of the aneurysm and whether adjunctive endosaccular coiling is concomitantly performed. The average number of devices used in the Pipeline Embolization Device for the Intracranial Treatment of Aneurysms1 and the Pipeline for Uncoilable or Failed Aneurysms (PUFS)2 trials was 1.52 and 3.1, respectively, a notable difference notwithstanding the larger dimensions of PUFS aneurysms. The UK National Prospective Flow-Diverter Registry averages 1.7 devices per case, with 67% of aneurysms reported as large or giant.3 In the IntrePED data base, as of 2013, fifty-eight percent of aneurysms were treated with a single device.4 Neither approach has so far been subjected to rigorous targeted investigation with respect to outcome. One may, therefore, argue that results of the best-controlled study to date—PUFS2—set the metrics of efficacy on the basis of using multiple-coverage constructs, thereby placing the burden of proof on the minimalist approach to demonstrate superiority or equipoise.
The deleterious geometric consequences of oversizing, a situation in which a device of a given nominal diameter is purposefully implanted in a vessel of smaller caliber, have been demonstrated in several publications.5,6 This issue frequently arises when a single device is used to cover an aneurysm with varied proximal and distal landing zone artery diameters. For the purpose of the subsequent discussion, the term “coverage” will be used interchangeably with “metal coverage,” defined as the percentage of artery surface area covered with the metal strands of the device. This is the inverse of the term “porosity,” which refers to the percentage of uncovered artery area. The percentage of metal coverage of all Pipeline devices decreases quickly and substantially under conditions of oversizing, also resulting in undesirable geometric effects at the transition zone between the recipient artery and the fusiform aneurysmal segment. The only effective strategy for minimizing these untoward effects relies on building multidevice constructs, with each device appropriately sized to its landing zone. To our knowledge, there is as yet no literature on the geometry or quantitative metal coverage of multidevice constructs. Existing animal data suggest the apparent feasibility of multidevice perforator coverage,7 though this information is not directly applicable to issues of treatment efficacy.
The PED is a self-expanding, cylindrical, braided device consisting of 48 strands of cobalt-chromium and platinum-tungsten wire, in a 3:1 respective ratio, braided to produce devices ranging from 2.5- to 5.0-mm nominal diameters, with lengths varying from 10 to 35 mm. The device is mounted within the delivery sheath by stretching, and its leading edge is packaged beneath a capture coil to protect the lead edges of the device filaments from damage during advancement within the microcatheter. During delivery, the device may expand to its maximum size, which is ∼0.25 mm larger than the nominal diameter if unconstrained in its deployment across a large or fusiform aneurysm neck, or it will conform to the diameter of the vessel in which it is implanted.
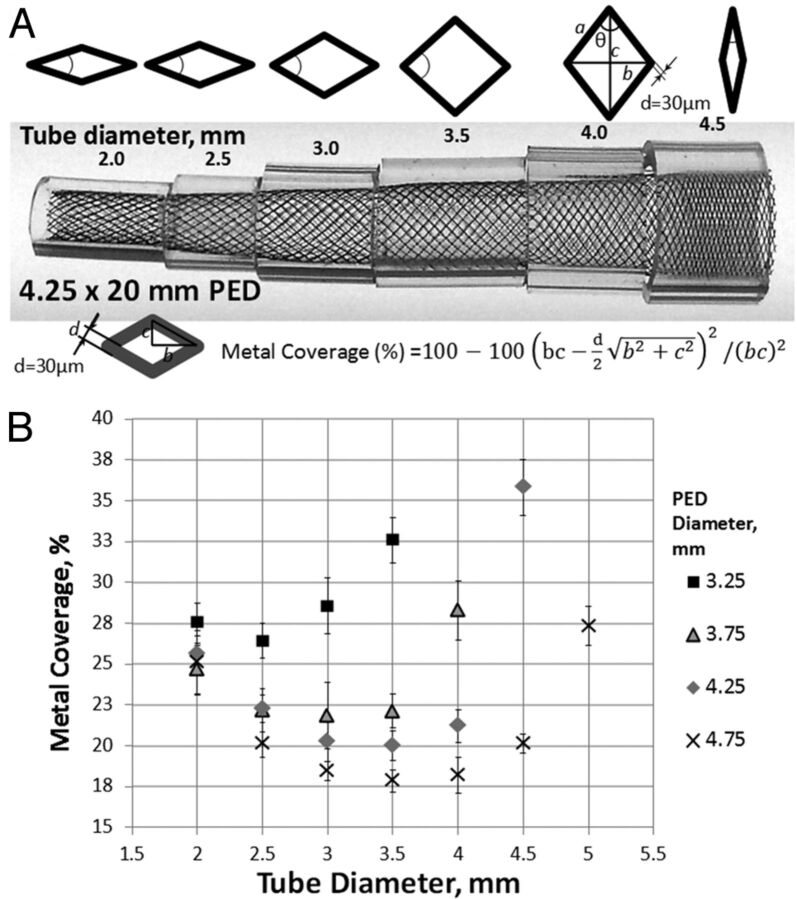
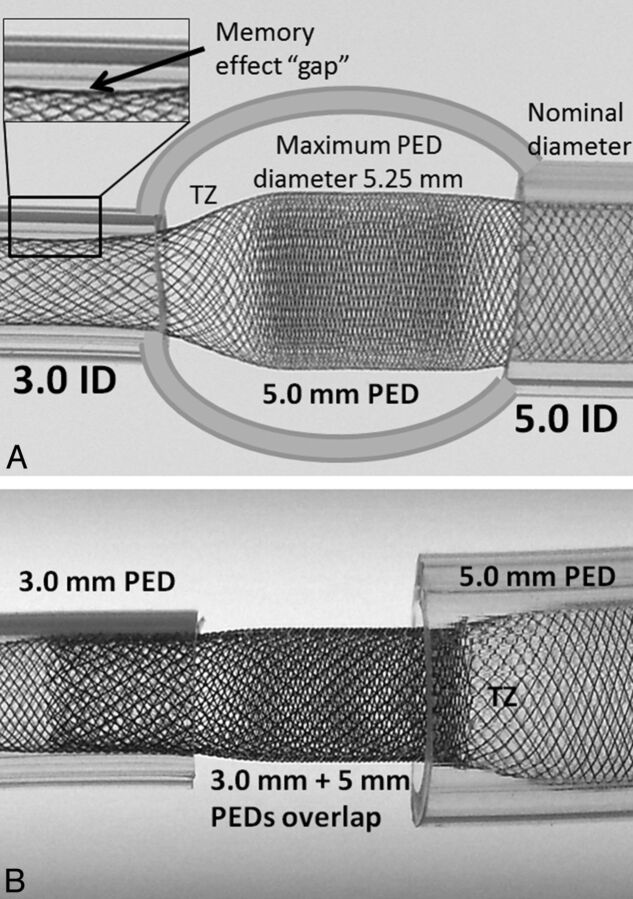
On close inspection, the ultrastructure of the device consists of a series of curved rhomboid cells (Fig 1A). The angle θ, or pitch, of the strands at nominal size is set during manufacture and, along with the diameter of the strand (mean diameter, 30 μm per manufacturer specifications) and the number of strands, determines the metal coverage and pore (cell) size of the device. However, when a device is placed into vessels of progressively smaller sizes relative to its nominal diameter, the pitch angle of the cells changes proportional to the degree of device constraint, resulting in lower coverage until a minimum value is reached. With even more oversizing, the cells again assume a diamond shape, now oriented along the long axis of the device, thus again increasing metal coverage (Fig 1A) and completing the parabolic relationship of coverage versus vessel diameter for each device (Fig 1B). In practice, metal coverage falls quickly with oversizing, reaching near-minimum values at recipient artery diameters approximately 1 mm smaller than the nominal device diameter. While coverage values at nominal expansion may be in the range of 30%–35%, with even minor degrees of oversizing, these values fall to 20%–25% and as low as 18% for larger nominal diameter devices (Fig 1B). Oversizing also creates geometric disturbances at the “transition zone” of lower metal coverage between the undersized recipient artery and the dysplastic aneurysmal segment that the device is intended to treat (Fig 2A). This low coverage zone cannot be compressed or otherwise changed by “loading” or pushing the device and may have negative consequences on the inflow and outflow dynamics of the aneurysm.6,8,9
Fig 1.
A, Representative image of a 4.25 × 20 mm Pipeline device inserted into plastic tubes of 0.5-mm incremental diameters. Variation in the degree of metal coverage is apparent. The configuration of cells is schematically depicted above the construct. Metal coverage can be calculated directly on the basis of measurements of the long and short diagonals of the rhombus and the diameter of each strand (30-μm), according to the formula above. Minimum coverage is seen when θ = 90°, corresponding to a square cell configuration. B, Scatterplot of tube diameter versus metal coverage for various device and “artery” combinations. All functions have a parabolic configuration. Note that absolute coverage values are higher for smaller diameter devices at each given tube diameter. The overall single-device coverage is, therefore, likely to be somewhat smaller for appropriately sized devices deployed in larger vessels.
Fig 2.
Consequences of device oversizing and the proposed solution. A, A model of a fusiform aneurysm with 3.0- and 5.0-mm landing zones, bridged by a single 5 × 20 mm device. A transition zone (TZ) of minimum coverage is created as the device is constrained from its fully opened state into the 3-mm landing zone. Despite adequate length of the “landing zone” at the 3.0-mm end, the “shape memory” of the transition zone, TZ, nevertheless produces a “gap” where the device remains unapposed to the inner wall of the tube. B, To address these issues, 2 devices are required, each of which is appropriately sized for its recipient artery. The first 3.0-mm device is deployed from the 3.0-mm-diameter vessel into the 5-mm recipient vessel, following which a second 5.0-mm diameter device is telescoped into the first, with the 5.0-mm device anchored into its 5.0-mm vessel. Thus, the transition zone, TZ, is shifted outside the aneurysm, while the aneurysmal segment receives the benefit of double-coverage.
To minimize these untoward geometric effects, one may use multidevice constructs, with overlapping devices intended for the proximal and distal landing zones, both appropriately sized to their target artery diameters (Fig 2B). Multiple devices are also often needed to bridge large or giant aneurysms to build a construct of sufficient structural integrity and produce adequate intra-aneurysmal stasis in the judgment of the operator.
This study was performed to investigate how metal coverage is affected by overlapping devices. For example, one may conceive of how 2 devices of identical diameter may be telescoped in a way that results in a near-perfect overlap of one device's braids with another, so that the actual metal coverage will only be minimally increased. On the other hand, a fortuitous phase shift of the braids by 50% would nearly double the percentage of coverage expected from each device alone. More complex results may be expected from using devices of different diameters, as seen below.
Materials and Methods
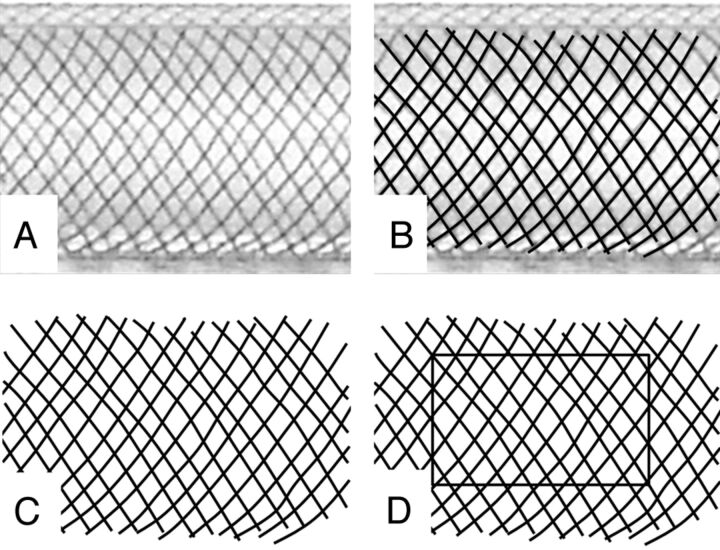
A number of various-diameter Pipeline Embolization Devices were deployed in clear plastic tubes of known inner diameters, with a representative sample shown in Fig 1A. In a previous study, metal coverage for each device/tube configuration was determined by direct measurement of the long and short axes of device cells and by calculating coverage on the basis of the 30-μm braid diameter specified by the manufacturer, according to the formula listed in Fig 1A.5 In the current study, a calibration ruler was placed alongside the deployed device and a photograph of the construct was uploaded into a PowerPoint (Microsoft, Redmond, Washington) slide. A curved black line was then traced over each device braid, with the line thickness calibrated to 30 μm by using the ruler as an internal reference standard. The resulting manually segmented image was then saved as a Portable Network Graphics image file and opened by using ImageJ freeware (National Institutes of Health, Bethesda, Maryland). Multiple rectangular regions of interest over the construct were drawn, and the “mean gray value” within each region, normalized to a standard “white” pixel value of 255 at 8 bits per pixel and corresponding to the percentage of metal coverage, was calculated for each area by using the “Measure” plug-in of the ImageJ tool (Fig 3): Metal Coverage (%) = 100−100 × (Mean Gray Value) / 255. Five random-area measurements were made for each segmented image and were averaged to produce a range of metal coverage values and SDs.
Fig 3.
Manual segmentation method of determining metal coverage. A, Photographic image of a 3.75-mm device deployed within a 3.5-mm plastic tube. A translucent fiberoptic rod is placed inside the construct to eliminate visualization of the “back” portion of the braids. B, Curved lines, with thickness corresponding to 30 μm (calibrated to a ruler placed alongside the construct) are traced along each braid. C, The underlying image is removed, leaving a black and white segmentation image. D, With the ImageJ measurement tool, the proportion of black pixels within a given rectangular area corresponds to the percentage of metal coverage, according to the formula listed in the “Materials and Methods” section.
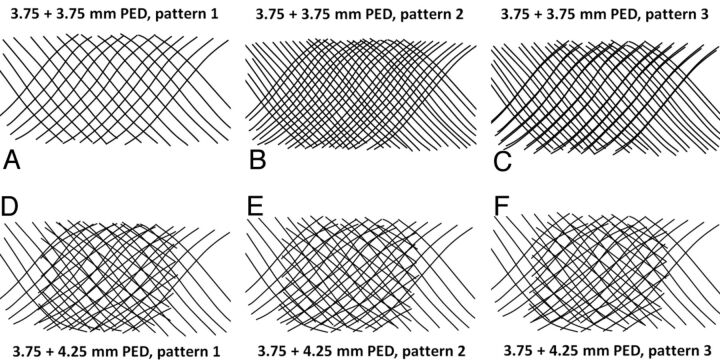
To determine combined-coverage values for overlapped devices, we “grouped” segmented curved lines derived for individual devices in PowerPoint and overlaid them on each other (Fig 4). For example, the segmented image of a 3.75-mm-diameter device placed into a 3.5-mm tube was overlaid on a segmented image of a 4.25-mm device deployed into the same-diameter 3.5-mm tube. The resulting overlapped image, representing an estimate of “double coverage” as might be achieved by actual deployment of one device inside another, was saved and uploaded into ImageJ, and the combined coverage was calculated by the method above. Because coverage varies with the degree of strand misregistration, especially when overlapping devices of identical diameter (in which perfect overlap of the braids might produce no change in surface metallic coverage, whereas a phase shift of 50% might almost double it), 3 separate patterns, in different phases of strand overlap, were created and analyzed to yield a range of coverage values and corresponding SDs for each device pairing (Fig 4).
Fig 4.
Overlapping segmentation images illustrating patterns of double coverage with identical-diameter (A–C) and different-diameter devices (D–F). It can be readily seen from Figs A–C that 2 overlapping 3.75-mm devices can result in a wide range of coverage, depending on the exact alignment of device braids of identical pitch relative to each other. In contrast, an overlap of 3.75- and 4.25-mm devices (Figs D–F), because of the different braid pitch for each device, produces a more consistent overall coverage pattern, regardless of the particular phase of overlap.
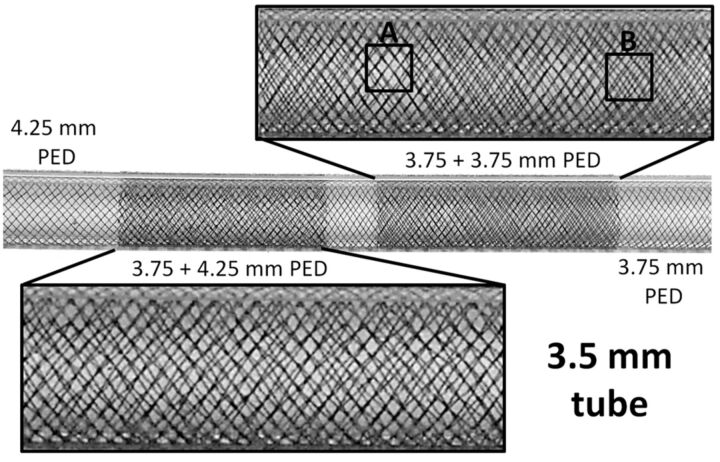
The minimum and maximum coverage values for each configuration are listed in the “Results” section, as representative of the range that might be expected from overlapping these particular devices in an artery of given size. The “overlap” segmentation method was validated by analysis of an actual in situ double-coverage construct created by sequential deployment of 3.75- and 4.25-mm devices into a 3.5-mm-diameter tube. Manual segmentation of the construct was performed, and its coverage values were compared with estimated values based on the overlap of separate segmented images of individual devices (Fig 5).
Fig 5.
Photographs of overlapping 3.75- and 4.25-mm-diameter devices deployed in a 3.5-mm tube. Visual appreciation of nonuniform coverage for two 3.75-mm devices: Area A shows near-perfect overlap of both device braids, with no practical increase in coverage for this segment, whereas the braid phase shift in area B produces significantly higher coverage. In contrast, overlap of 3.75- and 4.25-mm devices yields a more consistent pattern, with less potential variation in coverage values. The absolute value of such coverage is between the minimal and maximal potential values expected from overlapping two 3.75-mm devices.
Results
Images of coverage patterns resulting from the overlap of two 3.75-mm PEDs versus 3.75- and 4.25-mm-diameter PEDs, all deployed within the same 3.5-mm tube, are shown in Fig 5. It can be visually appreciated that the construct made with two 3.75-mm devices results in a wide range of local coverage, depending on the exact pattern of braid overlap. Because devices of identical diameter will have nearly identical braid pitch (allowing negligible differences in deployed diameters of inner and outer devices), near-exact overlap of the filaments may be possible, producing essentially no increase in surface metallic coverage (area A, Fig 5), whereas fortuitous alignment of device cells with a half-phase shift can substantially increase coverage (area B, Fig 5). In contrast, the overlap of 4.25- and 3.75-mm-diameter devices will produce a construct in which the filaments composing each device have different pitches, yielding a narrower (more consistent) range of coverage variation. The resulting coverage will be lower than the potentially achievable maximum when overlapping devices of identical diameter; however, it will be more consistent. The manually determined range of metal coverage for this construct is in excellent agreement with estimated values produced by overlapping individual segmented maps for each device (Table 1).
Table 1:
| 3.5-mm-Vessel Manual Segmentation | Manual | Estimated |
|---|---|---|
| 3.75 PED | 22% | |
| 3.75 + 4.25 PED | 36%–37% | 36%–37% |
| 4.25 PED | 18%–19% |
Manual segmentation was done by tracing curved lines over each braid in the double-coverage area and comparing the result with values estimated by overlapping segmented images from separate 3.75- and 4.25-mm devices individually deployed within a 3.5-mm artificial vessel. The 2 methods are in excellent agreement.
In this fashion, a range of metal-coverage values for devices placed in tubes of 3, 3.5, 4, and 4.5-mm diameters was calculated, as shown in Table 2. Again, for each vessel size, the widest range of potential combined coverage values is seen with overlapping devices of identical diameter. For example, telescoping two 3.75-mm devices in a 3.5-mm vessel leads to a range of metal coverage from 24% to 41%, as seen in Table 2. If instead of overlapping two 3.75-mm devices, a combination of 3.75- and 4.75-mm devices is used, the result is a much more consistent range of 33% to 34%—values that lie between the 24% and 41% extremes of identical device use. Thus, use of progressively different-diameter PEDs yields a correspondingly tighter range of coverage, as seen in Table 2.
Table 2:
The range of coverage values expected from overlap of various size devices in tubes of 3, 3.5, 4, and 4.5-mm diametersa
| 3-mm Vessel |
||||
|---|---|---|---|---|
| 3.25 | 3.75 | 4.25 | 4.75 | |
| 3.25 | 30%–47% | 30%–40% | 31%–37% | 34%–37% |
| 3.75 | 20%–37% | 30%–37% | 30%–35% | |
| 4.25 | 21%–35% | 31%–34% | ||
| 4.75 | 20%–36% | |||
| 3.5-mm Vessel |
|||
|---|---|---|---|
| 3.75 | 4.25 | 4.75 | |
| 3.75 | 24%–41% | 36%–37% | 33%–34% |
| 4.25 | 22%–36% | 31%–32% | |
| 4.75 | 18%–31% | ||
| 4-mm Vessel |
|||
|---|---|---|---|
| 3.75 | 4.25 | 4.75 | |
| 3.75 | 38%–46% | 37%–39% | 36%–37% |
| 4.25 | 21%–35% | 29%–33% | |
| 4.75 | 22%–32% | ||
| 4.5-mm Vessel |
||
|---|---|---|
| 4.25 | 4.75 | |
| 4.25 | 36%–57% | 40%–44% |
| 4.75 | 25%–34% | |
Note that the broadest range of coverage for each device/artery combination is always observed during overlap of identical-diameter devices. Use of devices with progressively different diameters produces correspondingly narrower ranges of coverage (due to the more consistent misregistration of strands arising from the differing pitches imposed on devices of different diameters constrained within a given diameter vessel), with absolute coverage values falling in-between the potential minima and maxima expected from overlap of identical devices.
From these Tables, it can be appreciated that most coverage values obtained by using different-diameter devices are at least in the 30% range, whereas telescoping identical devices could lead to values as low as 20%. Thus, when the first device is appropriately sized to the parent artery, adding a second device of slightly larger diameter is expected to more consistently produce coverage in mid-to-high 30% values, which may be predictive of clinical success.10,11
Discussion
The substantial decrease in coverage resulting from even modest oversizing of a single device relative to the diameter of its recipient artery5 and the frequent need to use multiple devices in bridging and securing complex aneurysm constructs are 2 factors that prompted this study of multidevice geometry. We see our results as arguing against telescoping identical-diameter devices because metal coverage along the length of overlap in this scenario is likely to be highly variable. This variability will be manifested on a pore-to-pore basis, with areas of low coverage, as seen in Fig 4, underscoring the distinction between coverage and individual pore size, as illustrated by Lieber and Sadasivan.12 These relatively bare patches may fail to undergo endothelialization, resulting in persistent communication between the aneurysm and new vessel lumen and perhaps contributing to unexpected treatment failures, notwithstanding apparently complete or near-complete angiographic occlusion.
Despite the plausibility of this hypothesis, the clinical significance of our observations, as they relate to the degree of flow diversion, thrombus formation, endothelialization scaffolding, and ultimate cure, is as yet largely undetermined in human subjects. There is some evidence in animal models supporting a 35% neck-coverage benchmark as highly predictive of treatment success.10 Values in this range are practically impossible to achieve with single PED use, especially because this strategy frequently necessitates oversizing the device at 1 (usually distal) landing zone. The behavior of multidevice constructs is expected to be even more complex at sites of curvature, where conditions are substantially more varied. It is critical to note that results of our study are only applicable to the Pipeline device. Other flow diverters have substantially different geometries and will not behave in the same manner under conditions of single-device oversizing13—and by extension during overlap.
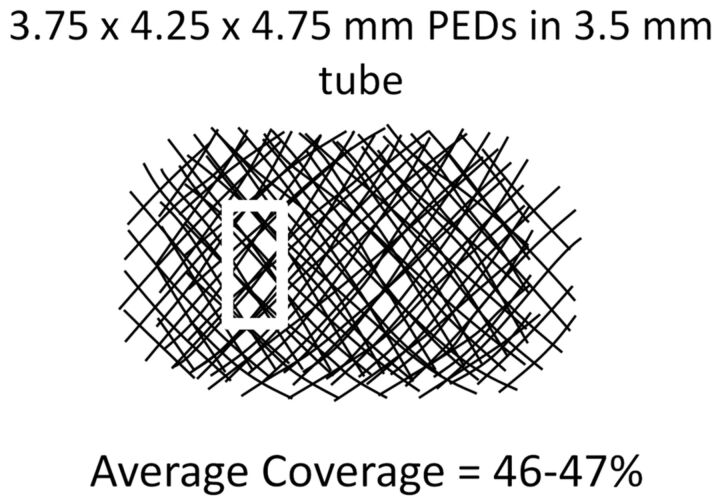
The presently used methodology of overlapping individually segmented images to produce a robust estimate of double coverage can be easily and quickly extended to study triple and higher coverage conditions (Fig 6), keeping in mind that aggregate PED wall thickness may eventually play a role in reducing the diameter of the construct and impacting flow across the overall mesh. One intriguing property of these triple-coverage constructs is that despite shifting segmented device images relative to each other, there will nearly always remain several pores where no substantial overlap will take place, so that coverage will be nearly as low and pore size as large as would be expected from a single device (Fig 6, white rectangle). It is perhaps this mechanism that is responsible for some treatment failures, especially when characterized by the presence of focal residual inflow into the aneurysm. Nevertheless, it is difficult to estimate the applicability of these in vitro observations to in vivo scenarios. Effort is ongoing by several groups to study in vivo device coverage by using cross-sectional methods derived from CT and rotational angiography methods. These cross-sectional approaches have the potential to become clinically practical methods for evaluating the functional degree of coverage and may be used in combination with presently shown in vitro high-resolution studies to help devise optimal treatment strategies.
Fig 6.
Example of triple coverage with 3 different-diameter stents. Note that despite overall relatively high coverage, areas of lower coverage and significantly larger pore size remain (white rectangle).
Conclusions
We present bench top observations on the geometric properties of the Pipeline Embolization Device under conditions of multidevice coverage. Our findings quantitatively illustrate that building multistent constructs by using devices of different diameters can create a more uniform pattern of metal coverage than would be expected from use of identical- or near-identical-diameter devices, thus achieving a more consistent coverage outcome. In extrapolated clinical scenarios, overlapping 2 appropriately sized devices appears to reliably provide coverage of 30% and higher—values that are rarely attainable with single-device use. These results support the need to consider vessel size and the strategic selection of overlapping devices to achieve the desired degree and pattern of coverage necessary to maximize the overall efficacy of treatment.
ABBREVIATIONS:
- PED
Pipeline Embolization Device
- PUFS
Pipeline for Uncoilable or Failed Aneurysms
Footnotes
Disclosures: Maksim Shapiro—UNRELATED: Consultancy: Covidien, Comments: Pipeline proctor and consultant with Covidien, Payment for Development of Educational Presentations: Pipeline proctor and consultant with Covidien. Tibor Becske—RELATED: Consulting Fee or Honorarium: Covidien, Comments: I am a consultant and proctor with ev3 Neurovascular, a division of Covidien, manufacturer of the Pipeline device, Support for Travel to Meetings for the Study or Other Purposes: Covidien, Comments: I received reimbursement/support for travel to meetings in the past to talk about Pipeline, UNRELATED: Consultancy: Covidien, Comments: As stated above, I am a consultant and proctor for ev3 Neurovascular, a division of Covidien, Payment for Lectures (including service on Speakers Bureaus): Covidien, Payment for Development of Educational Presentations: Covidien, Comments: I was actively involved in developing and implementing FDA-mandated physician training in the use of the Pipeline device. I received payments from Covidien in this role. Peter K. Nelson—RELATED: Consulting Fee or Honorarium: Covidien, Comments: reimbursement for clinical proctoring, UNRELATED: Patents (planned, pending or issued): Stryker,* Comments: issued patents, held by New York University, Royalties: Stryker,* Comments: royalties for Neuroform and Wingspan patents held by New York University, paid to New York University. *Money paid to the institution.
Pipeline devices used for this research were donated by Covidien.
REFERENCES
- 1. Nelson PK, Lylyk P, Szikora I, et al. The Pipeline embolization device for the intracranial treatment of aneurysms trial. AJNR Am J Neuroradiol 2011;32:34–40 [DOI] [PMC free article] [PubMed] [Google Scholar]
- 2. Becske T, Kallmes DF, Saatci I, et al. Pipeline for uncoilable or failed aneurysms: results from a multicenter clinical trial. Radiology 2013;267:858–68 [DOI] [PubMed] [Google Scholar]
- 3. Molyneux A, White PM. Update on the UK Flow Diverter Registry. In: Proceedings of the 51st Annual Meeting of the American Society of Neuroradiology, San Diego, California; May 18–23, 2013:570 [Google Scholar]
- 4. Kallmes D. Safety of flow diversion: results from a multicentre registry. In: Proceedings of the 10th Annual Meeting of the Society of Neurointerventional Surgery, Miami, Florida; July 29-August 1, 2013 [Google Scholar]
- 5. Shapiro M, Raz E, Becske T, et al. Variable porosity of the Pipeline embolization device in straight and curved vessels: a guide for optimal deployment strategy. AJNR Am J Neuroradiol 2014;35:727–33 [DOI] [PMC free article] [PubMed] [Google Scholar]
- 6. Mut F, Cebral JR. Effects of flow-diverting device oversizing on hemodynamics alteration in cerebral aneurysms. AJNR Am J Neuroradiol 2012;33:2010–16 [DOI] [PMC free article] [PubMed] [Google Scholar]
- 7. Dai D, Ding YH, Kadirvel R, et al. Patency of branches after coverage with multiple telescoping flow-diverter devices: an in vivo study in rabbits. AJNR Am J Neuroradiol 2012;33:171–74 [DOI] [PMC free article] [PubMed] [Google Scholar]
- 8. Makoyeva A, Bing F, Darsaut TE, et al. The varying porosity of braided self-expanding stents and flow diverters: an experimental study. AJNR Am J Neuroradiol 2013;34:596–602 [DOI] [PMC free article] [PubMed] [Google Scholar]
- 9. Bing F, Darsaut TE, Salazkin I, et al. Stents and flow diverters in the treatment of aneurysms: device deformation in vivo may alter porosity and impact efficacy. Neuroradiology 2013;55:85–92 [DOI] [PubMed] [Google Scholar]
- 10. Wang K, Huang Q, Hong B, et al. Correlation of aneurysm occlusion with actual metal coverage at neck after implantation of flow-diverting stent in rabbit models. Neuroradiology 2012;54:607–13 [DOI] [PubMed] [Google Scholar]
- 11. Wang K, Yuan S. Actual metal coverage at the neck is critical for flow-diverting stents in treating intracranial aneurysms. AJNR Am J Neuroradiol 2013;34:E31–32 [DOI] [PMC free article] [PubMed] [Google Scholar]
- 12. Lieber BB, Sadasivan C. Endoluminal scaffolds for vascular reconstruction and exclusion of aneurysms from the cerebral circulation. Stroke 2010;41:S21–25 [DOI] [PMC free article] [PubMed] [Google Scholar]
- 13. Aurboonyawat T, Blanc R, Schmidt P, et al. An in vitro study of Silk stent morphology. Neuroradiology 2011;53:659–67 [DOI] [PubMed] [Google Scholar]


