Abstract
BACKGROUND AND PURPOSE:
Flow-diverter stents modify intra-aneurysmal blood flow and induce the progressive thrombosis of intracranial aneurysms followed by stable vascular reconstruction. The aim of this study was to report a new method for the appraisal of intracranial blood flow from DSA performed during endovascular treatment procedures.
MATERIALS AND METHODS:
A cohort of 24 patients with unruptured IAs who underwent FDS implantation was prospectively recruited. Pre- and post-DSA sequences in combination with 3D rotational angiography were acquired. The quantification of arterial and intra-aneurysmal flow was accomplished by using an optical flow approach. Flow reduction was assessed by using a new metric termed the mean aneurysm flow amplitude ratio. The correlation between the MAFA ratio and the incidence of aneurysm thrombosis was assessed by using receiver operating characteristic analysis and the Fisher exact test when the optimum Youden index was found.
RESULTS:
The quantification of flow was successfully achieved in 21 of 24 patients (87.5%). On the imaging follow-up, 18 aneurysms developed complete thrombosis (87.5%) and 3 displayed residual circulation (12.5%). The threshold analysis of the MAFA ratio significantly predicted thrombosis at 12 months below a threshold of 1.03 (P = .035). There was no significant correlation between the time for complete occlusion of the aneurysm and contrast stagnation inside the aneurysm after treatment (P > .05).
CONCLUSIONS:
The MAFA ratio based on DSA flow quantification appears to be a reliable predictor for the assessment of stent treatment outcomes in this small study. These results open the door for perioperative flow quantification and provide indices that may help clinicians make appropriate intraprocedural decisions.
Intracranial aneurysms are a prevalent medical condition, and their rupture can have a significant adverse impact on patients' lives.1 The pathophysiology of IAs is not well-understood.2 Preventive treatment can avoid the rupture of aneurysms, but the indication for preventive treatment remains controversial.3,4 The latest therapeutic tool for the treatment of IAs is a new generation of intracranial stents called flow-diverter devices. These devices have an attenuated porosity that is capable of modifying the intra-aneurysmal blood flow, inducing progressive thrombosis and vascular remodeling. This development brings the neurovascular field into a “Hemodynamic Era.” However, questions have been raised concerning the mode of use, efficacy, and postprocedural bleeding risk of the FDS and the expected time for complete aneurysmal thrombosis after treatment.5 Moreover, we have no standard guidelines to aid our selection of the better therapeutic strategy: 1-layer flow diverter, multiple-layer flow diverter, or flow diverter associated with coils.6 Subjective analysis of the contrast stagnation has been proposed but never tested or proved to be efficient.7 Nevertheless, the assessment of real flow modifications induced by FDS placement has not yet been accomplished. In this article, a new method to appraise blood flow by using DSA sequences acquired during endovascular treatment procedures is described. We also evaluated the ability of the proposed method to predict long-term outcomes after flow diverter placement in patients presenting with unruptured IAs.
Materials and Methods
Patient Selection and Data Collection
A prospective consecutive series of 24 patients with unruptured intracranial aneurysms was considered following the approval of the institutional ethics committee of a protocol submitted for epidemiology and hemodynamic investigations on IAs (NEC 07-056). We included patients with unruptured saccular aneurysms who had elected to have FDS implantation.
All patients were evaluated under general anesthesia. The patients were premedicated with 100 mg aspirin and 75 mg clopidogrel for 5 days before endovascular treatment and were maintained on 2 antiplatelet aggregation agents for 3 months thereafter. Using a 6F femoral approach, we selectively placed a 5F/0.038-inch catheter (Torcon NB; Cook, Bloomington, Indiana) either in the internal carotid artery (3 cm after the common carotid bifurcation) or in the V2 segments of the vertebral artery. The same catheter was used for the pre- and poststent sequences and was positioned at the same location to, as closely as possible, produce the same angiogram conditions. The angiographic examinations were performed with a monoplane angiographic C-arm Allura FD20 (Philips Healthcare, Best, the Netherlands). A 3D rotational angiographic examination was performed to identify the optimal projection angle for the 2D flow sequence to avoid overlapping vessels on the aneurysm projection and to provide vessel geometry for the quantitative volumetric blood flow measurements. A projection view was chosen to perform the high-speed DSA (60 frames per second) before and after FDS placement. The injection duration was fixed at 3 seconds, and the injection rate was ≤2 mL/s. The contrast agent used was iopamidol (Iopamiro 300; Bracco, Milan, Italy), which was injected by using an angiographic contrast injector (Imaxeon Avidia; Medrad, Indianola, Pennsylvania).
Quantification of Flow: DSA-Based Optical Flow Approach
A dedicated iterative technique was developed to measure 2D velocity fields on the basis of DSA sequences by using the optical flow principle.8 During the injection, the contrast material was diluted in the blood stream and modulated by the cardiac cycle through the vascular network. The pulsating effect of the dye-blood mixing flow was the cornerstone in our algorithm. Unlike in other works, the physiologically modulated signal was preliminarily decoupled from the nonmodulated wash-in–washout component. This component, called the “contrast wave,” was propagated through the arterial anatomy, creating moving patterns that “optical flow” techniques were tracking in evaluating vector velocity fields. The contrast wave was extracted with a bandpass temporal filter, adapted to the cardiac pulsation and applied on the full x-ray video densitometry sequence. Therefore, only the moving structures with observable temporal and spatial variations remained and were related to the application of mass-conserving OF equation 1. Noise reduction was performed to cancel high-frequency temporal noise, along with spatial smoothing, hence improving the estimate of temporal and space gradients involved in the OF equation. The algorithm measured the 2D vector flow fields with an iterative scheme. Applying a warping transformation on the first image, based on the estimated motion field, iteratively minimized the quadratic error of the difference of 2 successive images. The quadratic error estimation was done locally, by using a Gaussian kernel-averaging step. The iteration process stopped when the remaining error no longer decreased. Such an iterative process has extended the standard OF limits to cope with the high-flow estimate. Both a high-acquisition frame rate and flat panel technology were key factors in producing adequate contrast wave sequences compatible with the OF principle. The pulsating component of the contrast pattern was described by the mass-conserving equation 1:
where r
 (x,y) in the aneurysm region of interest or r
 z in the parent artery region of interest. The bold character represents vector notation. The advection term in equation 1 compensates the temporal variation of x-ray intensity C(t,r). The solution of this equation was the velocity profile V(t,r).
In the parent artery, the velocity profiles were converted into volume flow by curvilinear integration along the artery length (Pereira VM, June 2011, unpublished date).8 Centerlines and cross-sections are provided by the 3DRA reconstruction.
MAFA and MAFA Ratio
To evaluate pre- and postoperative intra-aneurysmal flow modifications after FDS placement, we defined 2 indicators: the MAFA and the MAFA ratio (R). The velocity fields in the aneurysm volume are integrated along the line of sight, and their positive values on the detector plane are averaged over space and time during 1 cardiac cycle. The MAFA, measured in the aneurysm region of interest, is defined in equation 2:
where S is the surface of the patent aneurysm region of interest, T is the period of the cardiac cycle measured from the pulsatile component of CA pattern, and ‖V (t, r)‖ is the absolute value of 2D velocity measured in the aneurysm region of interest by using the OF approach.
The MAFA ratio describes the flow modifications induced by the FDS implantation. The MAFA values calculated before and after stent placement are normalized to their respective parent artery volume flows. The latter was measured from fusion of the same DSA sequence and 3DRA, with the optical flow algorithm applied to the internal carotid artery (Fig 1). This normalization is required to consider the possible changes in the arterial flow conditions before and after the procedure due to different physiologic conditions induced by the level of anesthesia, vasospasm, or the use of vasodilators. The selected aneurysm and vessel ROIs defined on the prestent angiograms were reused for the poststent DSA acquired in the same geometric conditions (FOV and C-arm angulation).
Fig. 1.
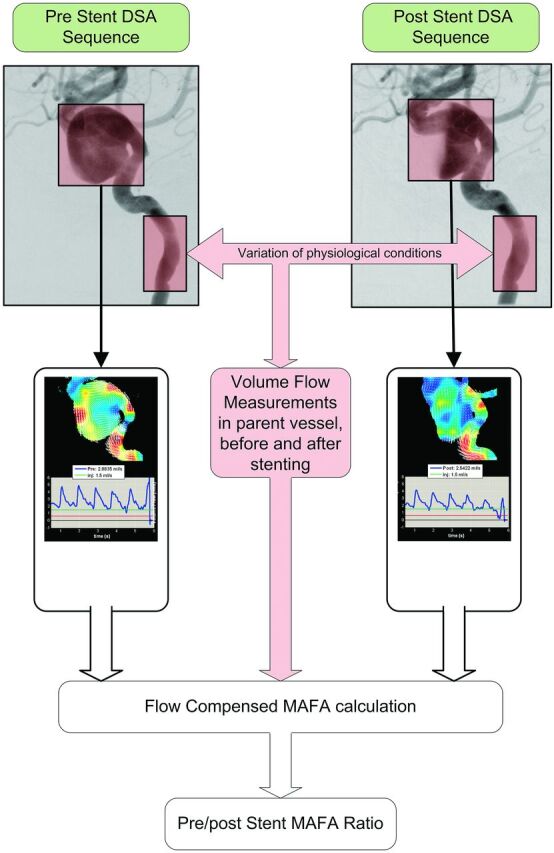
Workflow of the MAFA ratio calculation for patient 7 showing the selection of the region of interest to be analyzed inside the aneurysm and in the artery before and after stent placement to calculate the MAFA ratio.
The MAFA ratio R is defined in the equation below:
where Q is the volume flow measured in the parent artery. The indices pre and post in the R expression represent prestent and poststent conditions.
Stent Implantation and Follow-Up Protocol
We included 24 patients (On-line Table) harboring unruptured sidewall IAs treated with placement of a single FDS. We performed a pre- and postprocedural evaluation. Two different FDS devices were used: the Silk stent (Balt Extrusion, Montmorency, France) and the Pipeline embolization device (ev3/Chestnut Medical, Menlo Park, California). There was no specific selection between the stents; we used the Silk stent in the first 13 patients; and after its regulatory approval in Europe, the Pipeline device was used on the last 11 aneurysms. The clinical and imaging follow-up occurred at 3, 6, 12, and 24 months, by using DSA or MRA examinations (time-of-flight sequences with contrast agent injection). By protocol, we decided to use 1 single layer of an FDS and to follow the patients for at least 12 months before considering a second FDS placement in cases of incomplete occlusion. Clinical, procedural, and follow-up information from patients treated with FDS have been registered in a prospective data base.
Stagnation Indicators
In parallel, we proposed in our study to define a parameter describing the stagnation of the CA after the FDS implantation. The idea was to oppose the MAFA thrombosis predictor, a simple parameter “instinctively” used by radiologists to evaluate intraprocedural flow changes.9 The stagnation parameter is defined as the time between the arrival of contrast material at the level of the aneurysm neck and the complete washout, which typically lasts up to 13 seconds (maximum duration of runs in common practice). Similarly, the “eclipse” sign was also reported in our results as a stagnation indication.
Statistical Analysis
The MAFA ratio performance was tested against the thrombosis incidence at 3, 6, and 12 months by using the receiver operating characteristic analysis performance test corroborated by univariate logistic regression analysis. A threshold analysis was used to determine the MAFA ratio optimum threshold corresponding to optimum Youden index. Diagnostic odds ratios and P values related to the empiric area under curve and the corresponding standard error were estimated along with the Fisher exact test for the optimum threshold, given the smallness of numbers in the contingency table. Receiver operating characteristic analysis performance tests and logistic regression analysis were also used to estimate the impact of geometric factors in stent-treatment outcomes. The performances of both stents were compared with regard to thrombosis at 3, 6, and 12 months by using χ2 tests. The Wilcoxon rank-sum test was used to compare the performance of stents with regard to prestent and poststent stagnation-time difference and to ensure that comparison between stents was not biased by either geometry or patient age factors. The aneurysm location was tested against thrombosis issues with a median Mann-Whitney U test.
Results
The Table summarizes the subject population with regard to age, aneurysm site, aneurysm size (millimeters), aneurysm neck length (millimeters), aneurysm volume (cubic centimeters), aneurysm aspect ratio, and FDS type.
MAFA Ratio as a Thrombosis Predictor
The mean size, neck, and volume of the 24 aneurysms were similar to those reported by other studies6 at 9.3 mm, 6 mm, and 0.95 cm3, respectively. No significant influence was found on the stent treatment evaluation by the aneurysm size (P = .161), neck (P = .147), or volume (P = .08).
Of a total of 24 measurement attempts, we were able to obtain the flow parameters in 21 cases (87.5%). The evaluation failed in 3 cases (12.48%) because the volume flow measurements in the vessel could not be achieved. In 2 patients, a poor agreement between the 3D reconstruction and the DSA sequences could not be achieved due to patient movement between the 2 acquisitions. The third patient, who presented with very low flow in the inlet vessel after stent placement, could not be measured.
For all included patients, follow-up was from 6 to 36 months, including 19 patients with at least 12 months of follow-up. The On-line Table also summarizes the procedural and follow-up information of patients. Concerning the procedures, we experienced no problems during stent deployment or apposition to the vessel wall, except in 1 case (patient 15) in which angioplasty was performed with a soft intracranial balloon (HyperGlide; ev3) to improve the expansion of the stent. Two transient ischemic complications (8.3%) occurred among the 24 cases immediately after the procedure, with complete recovery occurring a few days later. During follow-up, 18 aneurysms demonstrated complete thrombosis (87.5%), whereas 3 aneurysms remained patent (12.5%). All patients had a modified Rankin Scale score of <2.
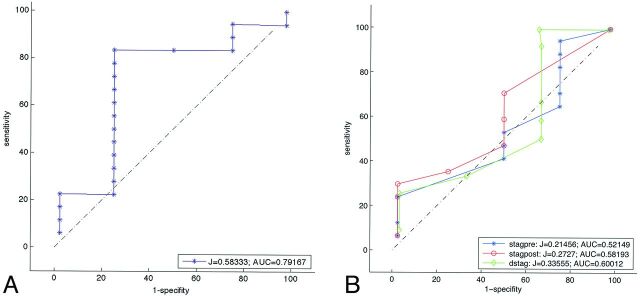
We calculated the MAFA before and after stent placement for each patient to obtain the MAFA ratio. The optimum MAFA ratio threshold for the prediction of complete aneurysm thrombosis at 12 months of follow-up was determined to be 1.03 + 0.17 (P < .035). Using this value, we predicted aneurysm thrombosis with a sensitivity of 88% (95% CI, 73%–100%) and a specificity of 73% (95% CI, 33%–95%) (Fig 2A). The diagnostic odds ratio was 23 ± 4, corresponding to an area under the curve of 73% (95% CI, 48%–98%). The classification rate (accuracy) was 86%. The test was very sensitive and moderately specific.
Fig. 2.
A, Receiver operating characteristic analysis curve of the MAFA ratio with respect to thrombosis (follow-up at 12 months for 21 patients). The test against the value 1.03 significantly predicts thrombosis (P = .035). B, Receiver operating characteristic analysis curves for wash-in/washout stagnation characteristic times at 12 months of follow-up: blue (stagpre, the stagnation time before stent placement), red (stagpost, the stagnation time after stent placement), green (dstag, the difference between the post- and prestent stagnation times). Stagnation is not a significant predictor of thrombosis (P > .05).
If we excluded cases where MAFA ratio could not be calculated, the optimum ratio threshold at 12 months of follow-up for the Silk devices specifically (12 patients) was 0.96 (P = .009), and the classification rate (accuracy) was 90%. All patients treated with Pipeline devices (9 patients) developed complete IA occlusion within the first 6 months, with an MAFA ratio test sensitivity of 1 (100%). Logistic regression analysis with bootstrap simulation yielded specificity close to 1 (P = .02). The results of the comparison of performance for the different stents with respect to aneurysm thrombosis were as follows: at 3 months: P = .0012 (Pipeline, 0.55; Silk, 0.53; deviation, 0), at 6 months: P = .078 (Pipeline, 1.0; Silk, 0.58; deviation, 0.51), and at 12 months: P = .17 (Pipeline, 1.0; Silk, 0.67; deviation, 0.49). We hypothesized that the Pipeline stent was more efficient at inducing complete occlusion within the first 6 months. However, at 12 months, both stents demonstrated similarly good performances.
CA Stagnation is Not Correlated with Intracranial Aneurysm Thrombosis
We evaluated CA stagnation in regular DSA in terms of wash-in/washout times before and after stent placement and the tendency to predict complete occlusion at 12 months. The receiver operating characteristic analysis (Fig 2B) demonstrated that CA stagnation was unable to predict thrombosis at 6 and 12 months (P = .109 and P = .484) (see examples in Figs 3–5). In the longer time course, the wash-in/washout time difference does not appear to be a good thrombosis predictor (P > .05). However, this time was measured from a 2-image/s DSA, which represents a normal frame rate during interventional neuroradiology procedures.
Fig. 3.
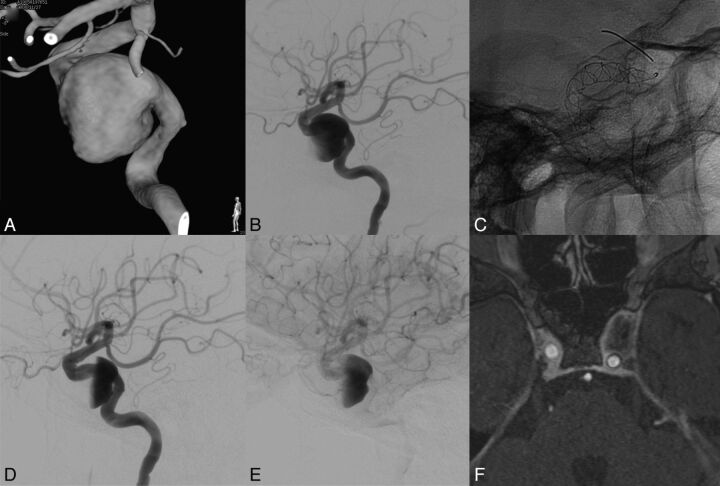
Patient with a left internal carotid cavernous aneurysm presenting with compression of cranial nerves (III and IV). MAFA ratio = 0.916. The natural evolution was predicted by the parameter. A, 3DRA of the left carotid artery. B, DSA, left ICA injection, lateral view. Pretreatment imaging. C, Nonsubtracted radiographic image. Lateral view. FDS implanted at the level of the left ICA covering the aneurysm neck region. D and E, DSA, left ICA injection, lateral view. Posttreatment imaging. Observe the contrast stagnation inside the aneurysm after the FDS placement. F, MR image. Postgadolinium 3D T1 image obtained at 12 months showing complete aneurysm resolution, vascular remodeling, and decompression of the cavernous sinus.
Fig. 4.
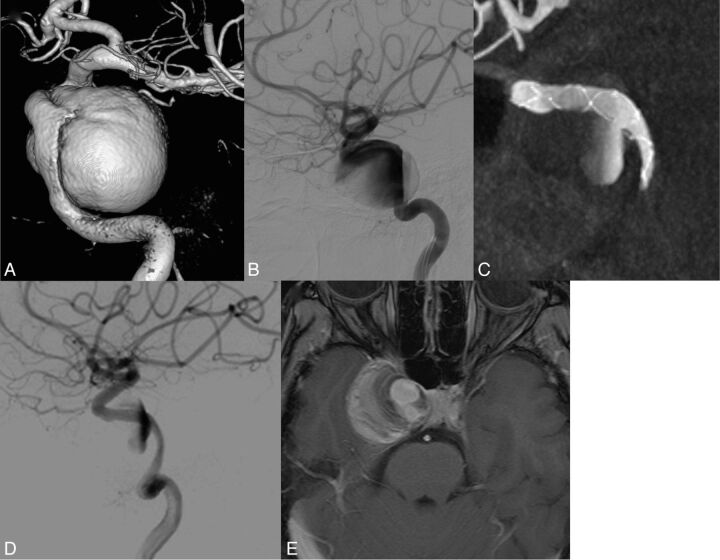
Patient presenting with a right internal carotid cavernous aneurysm with compression of cranial nerves. MAFA ratio = 1.24. The natural evolution was predicted by the parameter. A, 3DRA from the DSA of the right carotid artery. B, DSA, right ICA injection, lateral view. Pretreatment imaging. C, XperCT (Phillips Healthcare). Lateral view. Image after FDS implanted at the level of the ICA covering the aneurysm neck region. D, DSA, right ICA injection, lateral view. Posttreatment imaging. Observe the contrast stagnation inside the aneurysm after the FDS placement. E, MR image. Postgadolinium 3D T1 imaging at 12 months showing the partially thrombosed aneurysm. Note persistence of a circulating part close to the aneurysm neck and persistence of clinical signs of compression of the cavernous sinus.
Fig. 5.
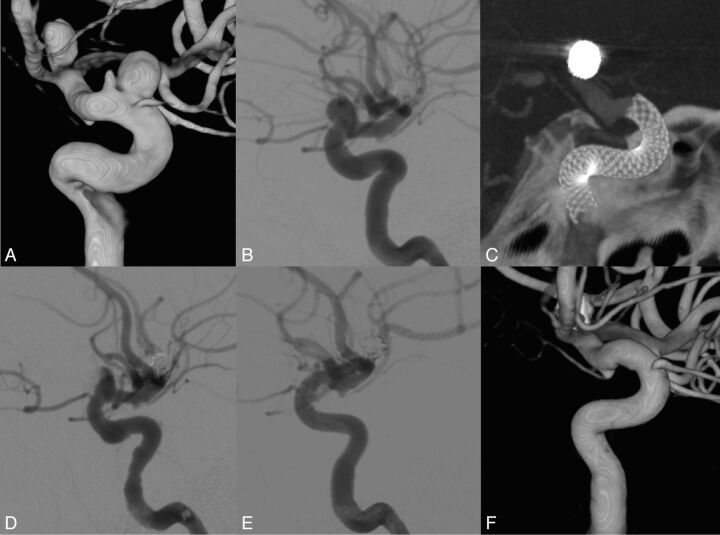
Patient presenting with 2 unruptured aneurysms over the ophthalmic segment of the left internal carotid aneurysm. History of a ruptured left bifurcation aneurysm. The MAFA ratio (0.68) was able to predict the radiologic evolution of the patient. A, 3DRA from DSA of the left carotid artery. B, DSA, right ICA injection, lateral view. Pretreatment imaging. C, XperCT (Phillips Healthcare). Lateral view. Image after FDS implantation at the level of the ICA covering the aneurysm neck region. Pipeline embolization device. D and E, DSA, left ICA injection, lateral view. Posttreatment imaging. Observe the contrast stagnation inside the aneurysm after the FDS placement. F, 3DRA from the DSA imaging of the left carotid artery. Control angiogram at 6 months shows complete vascular remodeling.
Discussion
Clinical Application and Evaluation of Flow-Diverter Devices
The FDS has been proved to be an efficacious therapeutic option for the treatment of intracranial aneurysms6,10,11 with the goal of obtaining a significant and effective flow modification to produce progressive thrombosis. The clinical results are very exciting and promising, but fundamental questions remain regarding clinical guidelines6,7,9,11–16: How can the flow change be quantified in relation to the complete aneurysm occlusion issue? How many devices should be used to efficiently resorb aneurysms? To date, no clinically applicable method is available to evaluate the flow modifications induced by the FDS.15,16 Lieber et al developed diffusion-advection modeling; nevertheless, clinical decisions are still based on CA stagnation or partial filling (eg, the eclipse sign).9,17 However, most of those aneurysms will occlude completely even though no such signs are observed. In our study, we established that the scales based on stagnation did not appropriately address the required flow change by inducing a complete thrombosis at 6 and 12 months (P = .109 and P = .484, respectively). We suggest instead a novel kinetic quantitative indicator, based on DSA, to predict thrombosis in aneurysms. This indicator, termed the MAFA ratio (R), could be measured in 21 of our 24 patients.
MAFA Ratio as an Aneurysm Thrombosis Predictor
The 21 patients were implanted with either the Silk (n = 12) or Pipeline embolization device (n = 9) FDS. The MAFA ratio R was able to predict thrombosis at 12 months with a sensitivity of 88% and a specificity of 73%. In our study protocol, 1 FDS layer without associated coiling was used because there were no clear recommendations or guidelines from companies about FDS usage. This strategy also allowed the evaluation of flow diverter performance without any confounding events (eg, coiling or multiple layers). Our systematic follow-up demonstrated that 70% of the aneurysms treated with 1 FDS layer achieved complete thrombosis by 1 year. Lylyk et al6 reported a 93% complete occlusion rate after Pipeline treatment at 6 months of follow-up in a series of 53 patients harboring 63 aneurysms. Lubicz et al18 reported a 69% complete occlusion rate at 6 months in a series of patients by using the Silk device. In our series, we observed that the Pipeline device performed significantly faster than the Silk device with regard to complete aneurysmal thrombosis at 3 (P = .012) and 6 (P = .024) months. At 12 months, however, there was no significant difference between the 2 devices (P = .17).
The threshold analysis established that below R = 1.03, the likelihood of thrombosis in the aneurysm was significant (sensitivity = 0.88, specificity = 0.73). Univariate logic regression analysis and the receiver operating characteristic analysis performance test established together that diagnostic odds ratio = 23. This ratio expresses the attenuated degree of flow reduction in the nonstagnating aneurysm area immediately after stent placement. Indeed, poststent DSA sequences show that the aneurysm area is sometimes split in 2 flow parts: stagnating and circulating. The MAFA takes into account the circulating area alone. Therefore, the velocity reduction that may occur in stented aneurysms will be damped by both the circulating surface reduction and the parent artery flow normalization. The resulting poststent MAFA could then be higher than the prestent MAFA, and consequently the R larger than 1, hence preventing thrombosis. It is remarkable that this assessment was made during a transient state that would no longer prevail when the CA washes out. The aneurysm could become fully patent and thrombogenesis may or may not be triggered, following a normal course.
Limitations
The method described herein requires no displacement of the patient between 3DRA and DSA acquisitions to avoid 2D/3D registration failure. For 2 patients, the 3DRA registration failed to match with the 2D images; consequently, it was not possible to quantify arterial flow and therefore the MAFA ratio. For a third patient, the intensity of the contrast resolution of the DSA sequences was too low to be significantly measured.
The small number of negative thrombosis issues analyzed (n = 4) and observed in the cohort study is due to the good therapeutic efficacy of the FDS used in this small series (n = 24). Although limited in sample size, the series was homogeneous with regard to single stent implantation, unlike other FDS studies.6,9,11
The discussion of OF clinical application limits was reported previously. These limits were assessed by comparing the arterial flow quantification based on DSA sequences and 3DRA with that measured with Doppler sonography. Essentially, the flow quantification was shown to be sensitive to the contrast agent injection rate below 2 mL/s, and the method was reliable in assessing volume flows below 6 mL/s. However, at injection rates closer to 3 mL/s, the OF method was less accurate. At this limit, the CA patterns lacked physiologic pulsatility, which is a common situation for OF approach application.
We expect the potential biases of the OF approach to have a limited impact on the MAFA ratio estimates. Indeed, the bias corresponding to the same injection rate would apply similarly to the pre- and poststent measurement conditions (eg, projection, FOV). In this context, it is also expected that the MAFA ratio would stay invariant when the DSA projection view changes. Indeed, the field velocity both before and after the stent may change but in such a way as to conserve the MAFA ratio estimated from other projection views.
In the present study, the respect of acquisition standards (ie, injection and acquisition conditions) adapted to the constraints and the reproducibility of the measurements between the pre- and postangiograms were important points guaranteeing the consistency of the data.
Periprocedural Measurements
The main added value of this DSA-based functional technique is to allow clinicians to use perioperative assessment of flow change after stent placement and to adapt the procedure accordingly. For instance, if the thrombosis prognosis provided by the MAFA ratio is below the determined threshold, the interventionalist could adapt the treatment by adding coils or extra FDS layers.
Conclusions
The assessment of the intra-aneurysmal flow change induced by flow-diverter stents by using DSA motion estimation can offer new insights into FDS treatment. In this pilot study, an objective blood flow parameter, the mean aneurysm flow amplitude, was defined on the basis of high-frame-rate DSA acquisitions with preservation of the physiologic flow information. The MAFA ratio between the post- and prestent conditions was successfully evaluated for its utility as an aneurysm thrombosis prognostic indicator. On the other hand, the hypothesis of flow stagnation as a potential predictor of FDS treatment outcomes was not confirmed in the present study. Further prospective multicenter data from a larger population are required to validate this method. This functional assessment may potentially help the clinician to adapt the treatment in real-time during the procedure.
Supplementary Material
ABBREVIATIONS:
- CA
contrast agent
- 3DRA
3D rotational angiography
- FDS
flow-diverter stent
- IAs
intracranial aneurysms
- MAFA
mean aneurysm flow amplitude
- OF
optical flow
Footnotes
Disclosures: Vitor Mendes Pereira—RELATED: Grant: Swiss National Science Foundation.* Odile Bonnefous—UNRELATED: Employment: I am a Philips Healthcare employee. Rafik Ouared—RELATED: Grant: Swiss National Science Foundation. Jean Stawiaski—UNRELATED: Employment: Philips Research employee. Hans Aerts—UNRELATED: Employment: Philips Healthcare employee. Daniel Ruijters—UNRELATED: Employment: Philips Healthcare employee. Karl Schaller—UNRELATED: Grants/Grants Pending: German Research Foundation,* Swiss National Fund for Science (SNF),* Geneva Cancer League,* Rothschild Foundation;* Payment for Lectures (including service on Speakers Bureaus): concerns travel costs and, several times, honoraria when I had been invited as a speaker by a society or university, never by a company,* Payment for Manuscript Preparation: relates to the large comprehensive chapter on epilepsy surgery, which had been published for Neuroupdate, the journal club of the German Society of Neurosurgery,* Payment for Development of Educational Presentations: NeuroUpdate Germany,* Comments: This is a national journal club with 1 annual educational meeting. *Money paid to the institution.
This work was supported by Swiss National Fonds, SNF 32003B_141192.
References
- 1. Brisman JL, Song JK, Newell DW. Cerebral aneurysms. N Engl J Med 2006;355:928–39 [DOI] [PubMed] [Google Scholar]
- 2. Wiebers DO, Whisnant JP, Huston J, 3rd, et al. Unruptured intracranial aneurysms: natural history, clinical outcome, and risks of surgical and endovascular treatment. Lancet 2003;362:103–10 [DOI] [PubMed] [Google Scholar]
- 3. Naggara ON, White PM, Guilbert F, et al. Endovascular treatment of intracranial unruptured aneurysms: systematic review and meta-analysis of the literature on safety and efficacy. Radiology 2010;256:887–97 [DOI] [PubMed] [Google Scholar]
- 4. Juvela S. Prevalence of and risk factors for intracranial aneurysms. Lancet Neurol 2011;10:595–97 [DOI] [PubMed] [Google Scholar]
- 5. D'Urso PI, Lanzino G, Cloft HJ, et al. Flow diversion for intracranial aneurysms: a review. Stroke 2011;42:2363–68 [DOI] [PubMed] [Google Scholar]
- 6. Lylyk P, Miranda C, Ceratto R, et al. Curative endovascular reconstruction of cerebral aneurysms with the Pipeline embolization device: the Buenos Aires experience. Neurosurgery 2009;64:632–42, discussion 642–43, quiz N636 [DOI] [PubMed] [Google Scholar]
- 7. Wong GK, Kwan MC, Ng RY, et al. Flow diverters for treatment of intracranial aneurysms: current status and ongoing clinical trials. J Clin Neurosci 2011;18:737–40 [DOI] [PubMed] [Google Scholar]
- 8. Bonnefous O, Pereira VM, Ouared O, et al. Quantification of arterial flow with digital subtracted angiography. Med Phys 2012;39:6264–75 [DOI] [PubMed] [Google Scholar]
- 9. Nelson PK, Lylyk P, Szikora I, et al. The Pipeline embolization device for the intracranial treatment of aneurysms trial. AJNR Am J Neuroradiol 2011;32:34–40 [DOI] [PMC free article] [PubMed] [Google Scholar]
- 10. Lubicz B, Collignon L, Raphaeli G, et al. Pipeline flow-diverter stent for endovascular treatment of intracranial aneurysms: preliminary experience in 20 patients with 27 aneurysms. World Neurosurg 2011;76:114–19 [DOI] [PubMed] [Google Scholar]
- 11. Szikora I, Berentei Z, Kulcsar Z, et al. Treatment of intracranial aneurysms by functional reconstruction of the parent artery: the Budapest experience with the Pipeline embolization device. AJNR Am J Neuroradiol 2010;31:1139–47 [DOI] [PMC free article] [PubMed] [Google Scholar]
- 12. Byrne JV, Beltechi R, Yarnold JA, et al. Early experience in the treatment of intra-cranial aneurysms by endovascular flow diversion: a multicentre prospective study. PLoS One 2010;5:pii: e12492 [DOI] [PMC free article] [PubMed] [Google Scholar]
- 13. Cebral JR, Mut F, Raschi M, et al. Aneurysm rupture following treatment with flow-diverting stents: computational hemodynamics analysis of treatment. AJNR Am J Neuroradiol 2011;32:27–33 [DOI] [PMC free article] [PubMed] [Google Scholar]
- 14. Fiorella D, Sadasivan C, Woo HH, et al. Regarding “Aneurysm rupture following treatment with flow-diverting stents: computational hemodynamics analysis of treatment”. AJNR Am J Neuroradiol 2011;32:E95–97, author reply E98–100 [DOI] [PMC free article] [PubMed] [Google Scholar]
- 15. Kamran M, Yarnold J, Grunwald IQ, et al. Assessment of angiographic outcomes after flow diversion treatment of intracranial aneurysms: a new grading schema. Neuroradiology 2011;53:501–08 [DOI] [PubMed] [Google Scholar]
- 16. O'Kelly CJ, Krings T, Fiorella D, et al. A novel grading scale for the angiographic assessment of intracranial aneurysms treated using flow diverting stents. Interv Neuroradiol 2010;16:133–37 [DOI] [PMC free article] [PubMed] [Google Scholar]
- 17. Fischer S, Vajda Z, Aguilar Perez M, et al. Pipeline embolization device (PED) for neurovascular reconstruction: initial experience in the treatment of 101 intracranial aneurysms and dissections. Neuroradiology 2012;54:369–82 [DOI] [PMC free article] [PubMed] [Google Scholar]
- 18. Lubicz B, Collignon L, Raphaeli G, et al. Flow-diverter stent for the endovascular treatment of intracranial aneurysms: a prospective study in 29 patients with 34 aneurysms. Stroke 2010;41:2247–53 [DOI] [PubMed] [Google Scholar]
Associated Data
This section collects any data citations, data availability statements, or supplementary materials included in this article.


