SUMMARY:
The procedure presented quantitatively assesses thalamic lesions in the chronic phase of an ischemic episode. The structural MR images of 19 patients with ischemia in the thalamus were assessed by radiologic inspection. An independent rater allocated the damage to the thalamic nuclei. The assessments showed 89% accordance with the radiologic inspection (P < .001). This procedure ranks the extent of the damage to thalamic nuclei and accounts for postacute rearrangement of the neural tissue.
The improvement in resolution and sensitivity of MR imaging had a major impact on advancing the knowledge of structure-function relationships in the human brain.1 However, normalizing brain images of patients onto a standard space defined for functional imaging lacks the resolution required to assess the involvement of small lesioned structures. Additionally, normalization of paraventricular lesions poses significant problems.1,2 In the postacute phase of ischemic disease, the surviving tissue may shrink 3,4 and a ventricular enlargement may take place secondary to the ischemic episode.5,6 These local changes have not been addressed in previous lesion-symptom mapping studies.7
The present method serves to quantitatively assess the damage to thalamic substructures, taking these issues into account.
Technique
Nineteen outpatients (11 women and 8 men) of the Klinikum Dortmund (Germany) participated in the study. All patients had ischemia in the paramedian (n = 10, 2 bilateral) or tuberothalamic (n = 9, 2 bilateral) artery, leading to a partially different lesion localization and symptomatic profiles.5,6 We focused on chronic lesions (the lesion-test interval varied between 1 and 12 years; Table 1).
Table 1:
Demographic data of the patientsa
| Subject | Sex | Age (yr) | Age at Onset (yr) | Time since Lesion (yr) |
|---|---|---|---|---|
| P1 | M | 79 | 78 | 1.3 |
| P2 | F | 71 | 67 | 4.0 |
| P3 | F | 70 | 69 | 1.0 |
| P4 | F | 78 | 73 | 4.7 |
| P5 | F | 56 | 50 | 6.0 |
| P6 | F | 57 | 55 | 1.7 |
| P7 | M | 67 | 63 | 4.0 |
| P8 | M | 68 | 63 | 4.6 |
| P9 | F | 71 | 69 | 2.0 |
| P10 | M | 45 | 33 | 12 |
| P11 | F | 64 | 59 | 5.1 |
| P12 | F | 65 | 60 | 4.9 |
| P13 | F | 30 | 18 | 12 |
| P14 | M | 64 | 61 | 2.3 |
| P15 | M | 59 | 47 | 12 |
| P16 | F | 67 | 62 | 5.0 |
| P17 | F | 61 | 59 | 2.2 |
| P18 | M | 54 | 42 | 12 |
| P19 | M | 48 | 38 | 10 |
| Average | 61.7 | 56.1 | 5.6 | |
| SD | 12 | 15 | 4.0 |
Patients 1–9 form the tuberothalamic group. Patients 10–19 constitute the paramedian group.
The experimental procedure was approved by the ethics committee of the local Faculty of Medicine. All subjects gave their informed written consent before participation.
For each patient, the following images were acquired within a follow-up examination with a 3T scanner (Signa Hdx 3.0T, GE Healthcare, Milwaukee, Wisconsin): a T1 (fast-spoiled gradient-recalled BRAVO axial sequence: 0.9 × 0.9 × 1.2 mm voxel size; flip angle, 13°; FOV = 24.0; section thickness = 1.2 mm; section spacing = 0 mm; section number = 110) contrasted MR imaging scan; and a T2-weighted image (FLAIR axial sequence: 0.5 × 0.5 × 5.5 mm voxel size; TE = 120 ms; TR = 8000 ms; FOV = 24.0; section thickness = 5.0 mm; section spacing = 0.5 mm; section number = 25).
Lesion Assessment by Radiologic Inspection
Two experienced neurologists evaluated the T1 and T2 scans and divided the patients to 2 different groups (paramedian and tuberothalamic). Only patients for whom the 2 raters expressed the same diagnosis were included in the study. The location of the necrotic tissue was used as a criterion to diagnose which artery underwent ischemia and hence to assign patients to membership.
The affected thalamic substructures were determined for each individual patient by using a stereotactic atlas specific for the thalamus and basal ganglia.8 This procedure is a consolidated standard in the field.9,10 We report as “damaged” the nuclei that both raters judged to be involved in the lesion.
Quantitative Lesion Assessment
The quantitative assessment consisted of individually matching the high-resolution T1-weighted brain images on the same human atlas8 used for radiologic inspection and computing the volume loss in each nucleus. This assessment was performed by a third rater.
We used 2 complementary statistical approaches: 1) We tested whether the volume losses obtained could discriminate patients belonging to different groups on the basis of a nonparametric a posteriori statistic (Mann-Whitney U test); 2) we used a clustering algorithm (Statistical Package for the Social Sciences statistics engine, hierarchical clustering; SPSS, Chicago, Illinois) to test whether group membership could be attributed a priori to patients. Results from the automated classifications obtained by clustering were statistically examined by a Pearson χ2 test.
We selected 2 relevant and 2 control structures. The first relevant structure receives blood supply mainly from the tuberothalamic artery6 (VA-VLa; estimated volume on the atlas, 435 mm3); the second is irrigated mainly by the paramedian artery6 (ILN: center median, parafascicular, centrolateral; estimated volume, 498 mm3). The 2 control structures are supplied either by both arteries6 (MD; excluding the paralamellar portion belonging to the centrolateral nucleus11; estimated volume, 459 mm3) or by neither of the 26 (VP, supplied by the inferolateral artery; estimated volume, 285 mm3).
In case of patients with bilateral lesions, only the larger lesion was taken into account.
Step-by-Step Procedure
Brain images were anonymized.
Brain images were reoriented to match the reference system of the atlas used8 through rigid body transformation in SPM8 (http://www.fil.ion.ucl.ac.uk/spm/software/spm8/). For matching criteria, the anterior and posterior commissures required a coplanar center, and this plane was defined as the dorsoventral 0. The brain image had to be symmetric with respect to the dorsoventral axis in the coronal view.
The gray-scale images were converted, by using MRIcron (http://www.cabiatl.com/mricro/mricron/index.html), to false color images (rainramp palette) to achieve better discrimination of white matter, gray matter, and CSF.
The images were exported in separate axial sections 1 mm away from each other.
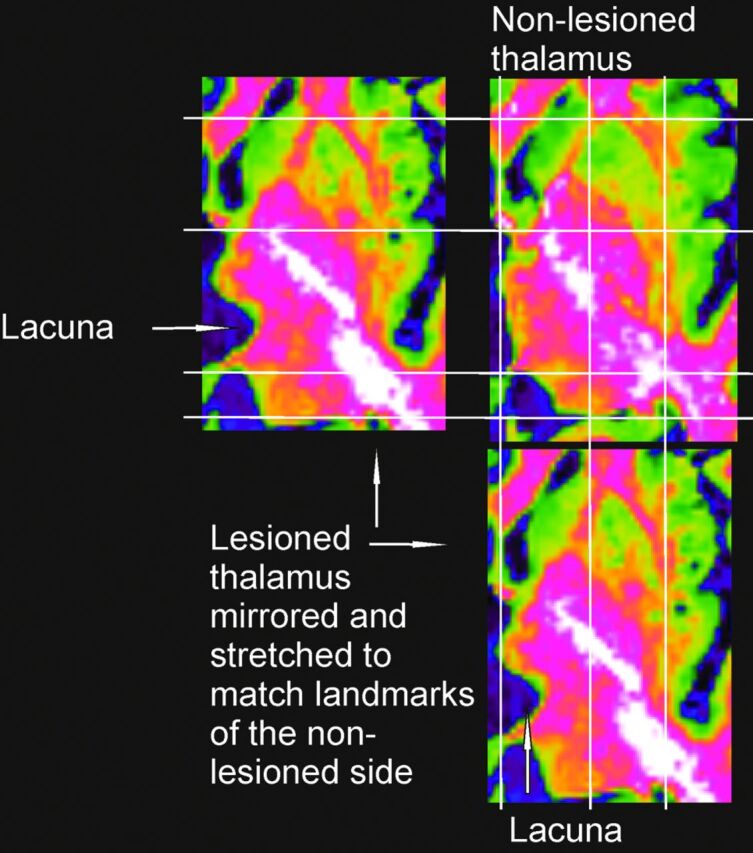
The image of the left thalamus was mirrored to match the atlas, which depicts a right thalamus. The nonlesioned side was used as a template to match the lesioned thalamus by using several landmarks (Fig 1): the anterior commissure, the posterior commissure, the internal capsula, the fornix, the borders of the basal ganglia, the ventricles, and the shape of the medial and caudal aspects of the thalamus. The transformations included linear enlargement or shrinking along the anteroposterior and lateromedial axis.
The nonlesioned thalamus was linearly transformed to match the atlas by using the landmarks mentioned above. Contextual to the transformation of the nonlesioned thalamus, the lesioned one was transformed, avoiding direct matching of the lesioned thalamus onto the atlas.
The atlas image was superimposed in transparent mode on the lesioned thalamus without further transformations.
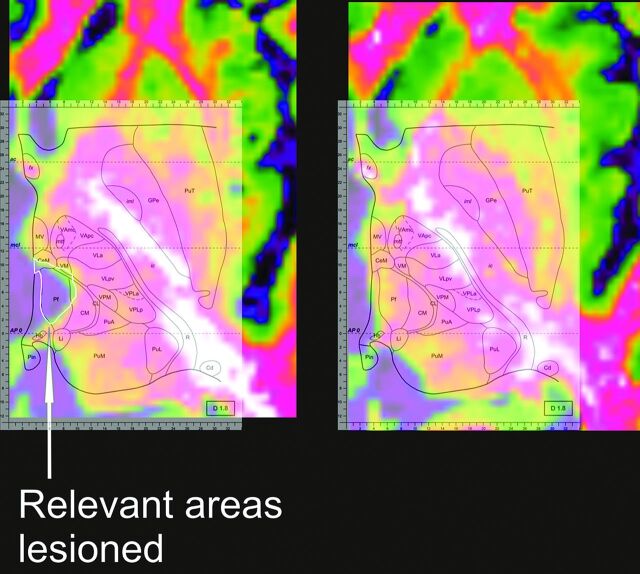
The lesion was manually traced by digitally sampling points on its borders and connecting them through a line (Fig 2).
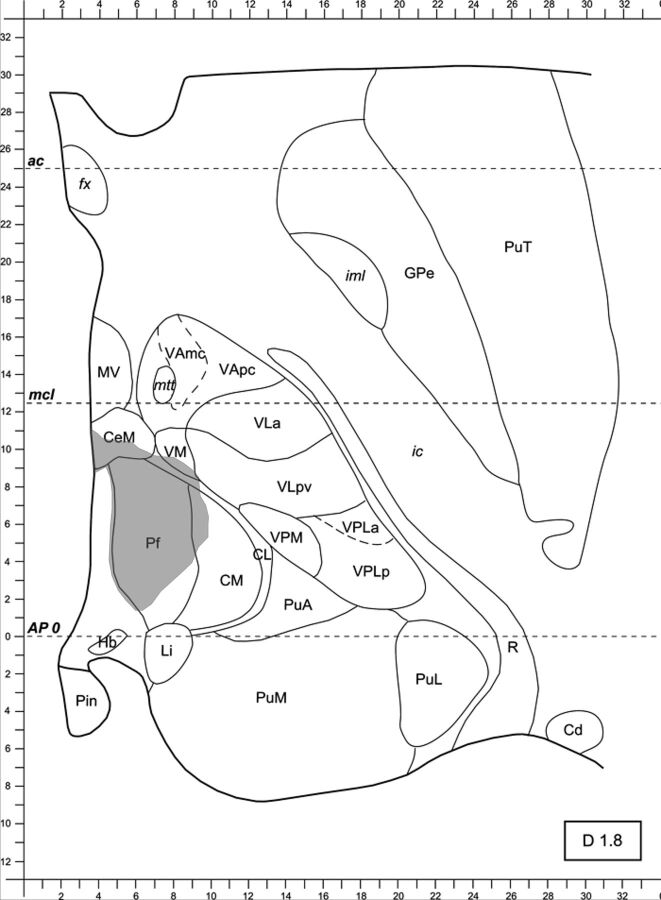
For each lesioned structure in each section, the surface of the lesioned area (Fig 3) was computed by using the software CellP̂ (Olympus, Japan, http://www.microscopy.olympus.eu/microscopes/Software_cell_P.htm) The same software served to estimate the total volume of the single thalamic structures depicted on the atlas. We took note of the voxel-to-millimeter ratio of each picture, which varied slightly across the sample. The native resolution of the JPEG files was always 200 dpi.
The volume of the necrotic tissue in each structure included in the atlas was computed by averaging the damaged area over the number of sections in the atlas (26) and then multiplying it by the whole length of the thalamus along the dorsoventral axis according to the atlas (22.1 mm).
The row lesion size in cubic millimeters was divided by the estimated volume of the same structures (based on the atlas) to obtain the percentage of volume lost due to ischemia.
Images were reattributed to individual patients.
Fig 1.

The lesioned and the nonlesioned thalamus after matching.
Fig 2.
The lesioned thalamus has been matched to the atlas. The lesion has been manually traced, bordering the ischemic lacuna. PuT indicates putamen; fx, fornix; GPe, globus pallidus pars externa; ic, internal capsula; iml, medullary lamina; MV, medioventral nucleus of the thalamus; mtt, mammillothalamic tract; VAmc, ventral anterior nucleus of the thalamus, magnocellular portion; VApc, ventral anterior nucleus of the thalamus, magnocellular portion; CeM, center median nucleus of the thalamus; VLpv, ventrolateral nucleus of the thalamus, posteroventral portion; Pf, parafascicular nucleus of the thalamus; CM, centromedian nucleus of the thalamus; CL, centrolateral nucleus of the thalamus; VPM, ventral posterior medial nucleus of the thalamus; VPLa, ventral posterior lateral nucleus of the thalamus, anterior portion; VPLp, ventral posterior lateral nucleus of the thalamus, posterior portion; PuA, anteror pulvinar; PuM, medial pulvinar; PuL, lateral pulvinar; Hb, habenular nucleus of the thalamus; Pin, posterior intralaminar nucleus of the non-lemniscal pathway; Li, limitans nucleus of the thalamus; R, reticular nucleus of the thalamus; Cd, caudate nucleus. (Modified from Morel.8)
Fig 3.
The image is ready for surface measurement. PuT indicates putamen; fx, fornix; GPe, globus pallidus pars externa; ic, internal capsula; iml, medullary lamina; MV, medioventral nucleus of the thalamus; mtt, mammillothalamic tract; VAmc, ventral anterior nucleus of the thalamus, magnocellular portion; VApc, ventral anterior nucleus of the thalamus, magnocellular portion; CeM, center median nucleus of the thalamus; VLpv, ventrolateral nucleus of the thalamus, posteroventral portion; Pf, parafascicular nucleus of the thalamus; CM, centromedian nucleus of the thalamus; CL, centrolateral nucleus of the thalamus; VPM, ventral posterior medial nucleus of the thalamus; VPLa, ventral posterior lateral nucleus of the thalamus; anterior portion; VPLp, ventral posterior lateral nucleus of the thalamus, posterior portion; PuA, anterior pulvinar; PuM, medial pulvinar; PuL, lateral pulvinar; Hb, habenular nucleus of the thalamus; Pin, posterior intralaminar nucleus of the non-lemniscal pathway; Li, limitans nucleus of the thalamus; R, reticular nucleus of the thalamus; Cd, caudate nucleus. (Modified from Morel.8)
Results
Table 2 summarizes the structures lesioned in the present patient sample, according to radiologic examination and quantitative assessment.
Table 2:
Results of the lesion assessmenta
| Subject | Radiologic Inspection | Absolute Damage | Relative Damage |
|---|---|---|---|
| P1 | Left VL | Left VL | Left VM |
| P2 | Left VA, VL; right VL | Left VA, VL; right MD | Left MID |
| P3 | Left VL | Left VL, ILN | |
| P4 | Left VA, VL, MD | Left VA, VL, MD | Left MD, VL, MID |
| P5 | Right VA | Right VA, MID | Right VA, MID |
| P6 | Right VL, VA, MD | Right VL, VA, MD | Right VL, VA, MD, MID, ILN |
| P7 | Left MD, bilateral VP | Left MD, Pu; right ILN | Left MD, VP, ILN, MID; right LP, ILN |
| P8 | Left VL | Left VL | Left VL, VM |
| P9 | Left VL, anterior MD | Left MID, MD | Left MID |
| P10 | Right VA, MD | Right VA, MD, MID | Right MD, MID |
| P11 | Right MD | Right MD, ILN | Right MID |
| P12 | Left MD, ILN | Right MD, ILN | Left MD, ILN, MID, VM |
| P13 | Left MD | Left MD, MID | Left MD, MID |
| P14 | Right MD | Right MD, ILN | Right MID, ILN, VM |
| P15 | Left MD | Left MD, ILN | Left MID |
| P16 | Right MD | Right MD | Right MD |
| P17 | Right MD | Right MD, ILN | Right MD, MID, ILN |
| P18 | Left VL, right VL, VA | Left VL, right Pu | Left VP |
| P19 | Right VL, bilateral MD | Right VL, bilateral MD, ILN | Right VA, VL, bilateral MD, ILN, MID |
Note:—Pu indicates pulvinar; VL, ventrolateral nucleus of the thalamus.
First column indicates the results of the radiologic inspection; second column, structures having the greatest volume loss (absolute damage); third column, structures having >10% volume loss (relative damage).
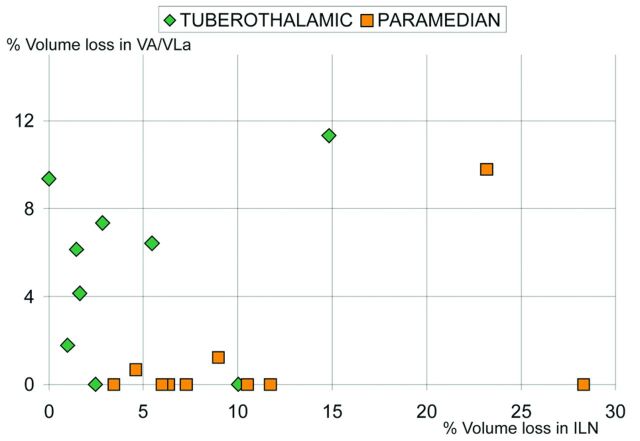
Damage to the relevant structures discriminated groups (VA-VLa, U = 19.0, P = .035 [exact, 2-tailed]; ILN, U = 16.0, P = .017 [exact, 2-tailed]), but damage to the control structures did not (MD, U = 31.0, P = .28 [exact, 2-tailed]; VP, U = 35.0, P = .45 [exact, 2-tailed]).
The hierarchical clustering algorithm correctly classified 17 of 19 patients (89%, χ2 = 12.3, P < .001) when the relevant variables were used, and 13 of 19 (68%, χ2= 2.56, P = .11) when using the nonrelevant variables.
Figure 4 plots the data used for automated classification.
Fig 4.
Scatterplot of the data on which statistical analyses and automated classification were based. The data points lying on the x-axis and belonging to the 2 tuberothalamic patients have been incorrectly classified as paramedian.
Discussion
The current approach is unique because it accounts for postlesion shrinkage by matching the lesioned thalamus to the nonlesioned one. Quantitative assessment yields the information available to radiologic inspections and provides more information about damage to smaller structures, which potentially affect large cortical areas (Table 2). The procedures classified patients group membership with an agreement close to 90%. Control variables did not discriminate between the groups. The fact that damage attributed to VA-VLa and to ILN dissociated the groups (Fig 4), as expected on the basis of the literature,6 supports the conclusion that matching onto the template was successful.
The main issue relating to reliability of the present procedure is to what extent MR images allow quantitative measurements of brain damage. One should take into account several sources of uncertainty: 1) the image resolution; 2) the interindividual variability in dimension and localization of the thalamic nuclei; 3) the definition of the lesion borders; and 4) local changes and rearrangements secondary to ischemia.
1) The image resolution was 0.94 × 0.94 × 1.2 mm. The uncertainty on the volumes measured has the dimension of 1 voxel (1.1 mm3). Each measurement involved 2 decisions: determination of the lesion border and determination of the border of the anatomic landmarks considered for matching onto the atlas. The maximal uncertainty on the volume measured can thus be approximated to 2.2 mm3. This source of uncertainty can be considered of limited importance when measuring structures whose size is 2 orders of magnitude higher (ie, >100 mm3).
2) Interindividual variability is usually countered by increasing sample size. The interindividual variability of the thalamus and basal ganglia is lower than cortical variability.8 A sample size comparable with that used in many neuroimaging studies (10–20 subjects) should suit the present procedure.
3) Definition of ischemic lesion borders on MR imaging−generated gray-scale images has been found reliable on histologic examination,12,13 even for small lesions.14 The procedure likely results in underestimation of the damage.3 Despite this limitation, our procedure provided a statistically reliable allocation of the extent of the damage to specific structures.
4) Local changes and secondary rearrangements due to postlesional alterations may constitute a major source of uncertainty.3 Nonuniform thalamic shrinkage and rearrangement of the landmarks used may bias attempts to quantify the volume loss. The current procedure allows recognition of such issues, during the first match of the lesioned thalamus to the nonlesioned one.
ABBREVIATIONS
- ILN
intralaminar nuclei of the thalamus
- MD
mediodorsal nucleus of the thalamus
- MID
midline nuclei of the thalamus
- PU
pulvinar
- VA
ventral anterior nucleus of the thalamus
- VP
ventroposterior nucleus of the thalamus
- VLa
ventrolateral nucleus of the thalamus, anterior portion
- VM
ventromedial nucleus of the thalamus
Footnotes
Disclosures: Michael Schwarz—UNRELATED: Board Membership: Schwarz Pharma, Payment for Lectures (including service on speakers bureaus): Orion, Glaxo, Teva.
This work was supported by the Novobrain Programme (Marie Curie FP6, Early-Stage Training).
References
- 1. Seghier ML, Ramlackhansingh A, Crinion J, et al. Lesion identification using unified segmentation-normalisation models and fuzzy clustering. Neuroimage 2008;41:1253–66 [DOI] [PMC free article] [PubMed] [Google Scholar]
- 2. Stamatakis EA, Tyler LK. Identifying lesions on structural brain images: validation of the method and application to neuropsychological patients. Brain Lang 2005;94:167–77 [DOI] [PubMed] [Google Scholar]
- 3. Kraemer M, Schormann T, Hagemann G, et al. Delayed shrinkage of the brain after ischemic stroke: preliminary observations with voxel-guided morphometry. J Neuroimaging 2004;14:265–72 [DOI] [PubMed] [Google Scholar]
- 4. Kalowska E, Rostrup E, Rosenbaum S, et al. Acute MRI changes in progressive ischemic stroke. Eur Neurol 2008;59:229–36 [DOI] [PubMed] [Google Scholar]
- 5. Carrera E, Bogousslavsky J. The thalamus and behavior: effects of anatomically distinct strokes. Neurology 2006;66:1817–23 [DOI] [PubMed] [Google Scholar]
- 6. Schmahmann JD. Vascular syndromes of the thalamus. Stroke 2003;34:2264–78 [DOI] [PubMed] [Google Scholar]
- 7. Karnath HO, Fruhmann BM, Kuker W, et al. The anatomy of spatial neglect based on voxelwise statistical analysis: a study of 140 patients. Cereb Cortex 2004;14:1164–72 [DOI] [PubMed] [Google Scholar]
- 8. Morel A. Stereotactic Atlas of the Human Thalamus and Basal Ganglia. New York: Informa Healthcare USA; 2007:1–29 [Google Scholar]
- 9. Peterburs J, Pergola G, Koch B, et al. Altered error processing following vascular thalamic damage: evidence from an antisaccade task. PLoS ONE 2011;6:e21517. Epub 2011 Jun 23 [DOI] [PMC free article] [PubMed] [Google Scholar]
- 10. Perren F, Clarke S, Bogousslavsky J. The syndrome of combined polar and paramedian thalamic infarction. Arch Neurol 2005;62:1212–16 [DOI] [PubMed] [Google Scholar]
- 11. Jones EG. The Thalamus. Cambridge, UK: Cambridge University Press; 2007:1184 [Google Scholar]
- 12. Stoffel M, Blau C, Reinl H, et al. Identification of brain tissue necrosis by MRI: validation by histomorphometry. J Neurotrauma 2004;21:733–40 [DOI] [PubMed] [Google Scholar]
- 13. Flossmann E, Redgrave JN, Briley D, et al. Reliability of clinical diagnosis of the symptomatic vascular territory in patients with recent transient ischemic attack or minor stroke. Stroke 2008;39:2457–60 [DOI] [PubMed] [Google Scholar]
- 14. Steffenhagen N, Campos CR, Poppe AY, et al. Reliability of measuring lesion volumes in transient ischemic attack and minor stroke. Stroke 2010;41:814–16 [DOI] [PubMed] [Google Scholar]


