

Abstract
BACKGROUND AND PURPOSE:
ARHSP-TCC is characterized by progressive leg spasticity, ataxia, and cognitive dysfunction. Although mutations in the human SPG11 gene were identified as responsible for ARHSP-TCC, the cerebral fiber integrity has not been assessed systemically. The objective of this study was to assess cerebral fiber integrity and its clinical significance in patients with ARHSP-TCC.
MATERIALS AND METHODS:
Five patients from 2 families who were clinically and genetically confirmed to have ARHSP-TCC were examined by neuropsychological evaluation and DSI of the brain. We performed voxel-based GFA analysis for global white matter evaluation, tractography-based analysis for tract-to-tract comparisons, and tract-specific analysis of the CST to evaluate microstructural integrity along the axonal direction.
RESULTS:
The neuropsychological evaluation revealed widespread cognitive decline across all domains. Voxel-based analysis showed global reduction of GFA in the cerebral white matter. Tractography-based analysis revealed a significant reduction of the microstructural integrity in all neural fiber types, while commissure and association fibers had more GFA reduction than projection fibers (P < .00001). Prefrontal and motor portions of the CC were most severely affected among all fiber tracts (P < .00001, P = .018). Tract-specific analysis of the CST validated a “dying-back” phenomenon (R2 = 0.68, P < .00001).
CONCLUSIONS:
There was a characteristic gradation in the reduction of microstructural integrity among fiber types and within the CC in patients with the SPG11 mutation. The dying-back process in CST might explain the pathogenic mechanisms for ARHSP-TCC.
Autosomal recessive hereditary spastic paraparesis is a progressive neurodegenerative disease with at least 12 genetic loci reported to be involved.1,2 The specific thin corpus callosum associated with ARHSP has been classified as an independent disease entity (ARHSP-TCC). Clinically, ARHSP-TCC is characterized by slow but progressive spastic paraparesis with cognitive impairment, which usually starts during the second decade of life.3 Cognitive impairment is first noticeable during adolescence and precedes leg spasticity. These symptoms progress insidiously to a level of severe functional disability for 10–20 years.4 Mutations in the human SPG11 (KIAA1840) gene, which map to chromosome 15q21.1, have been found to be responsible for ARHSP-TCC.5
DTI has been used to demonstrate widespread loss of cerebral white matter in patients with ARHSP-TCC.6,7 However, the pattern of involvement for individual fiber tracts remains to be clarified. To address this issue, we used DSI to evaluate our patients because of its superior ability to resolve crossed fibers and its reliability in the reconstruction of fiber pathways.8,9 DSI tractography has been successfully applied to examine the microstructural integrity of major fiber pathways such as the CC, arcuate fasciculus, cingulum bundle, and CST in various neurologic or mental diseases.10–13 With the advantage of DSI, our study performed a tractography-based analysis for reliable tract-to-tract comparisons and aimed to establish the pattern of white matter degeneration of ARHSP-TCC.
Despite the well-known genetic cause of ARHSP-TCC, the pathogenesis of this disease remains unclear. A noninvasive method for examining axonal function could be a potentially important step in revealing the genesis of ARHSP-TCC. Because disturbed axonal transport is the key mechanism that causes distal end anatomic changes and the dying-back phenomenon, assessing microstructural integrity along the axonal direction would be a logical first step.14–16 However, most fiber tracts are composed of axons in both directions, thus are unsuitable for such investigation. The CST, a bundle of projection fibers that consists mostly of unidirectional axons, is an ideal target for investigating axonal functions. Therefore, we focused on the CST owing to its unique axonal directionality and used a tract-specific analysis to evaluate the microstructural integrity of the CST in its axonal direction as it extends distally.
Materials and Methods
Subjects
Five patients from 2 families (3 siblings, P1, P2, and P3 from family 1; and 2 brothers, P4 and P5, from family 2) were recruited (Table 1). P3 and P5 were first noticed in the clinic due to progressive spastic paraparesis without parental involvement in the diagnosis. Thinning of the corpus callosum was evident in both patients, and ARHSP-TCC was confirmed by genetic diagnosis. The other patients (P1, P2, and P4) were prospectively discovered by genetic screening of the 2 families. All siblings (3 of 3 in family 1; and 2 of 2 in family 2) were affected. All 5 patients had spastic paraparesis and thinning of the corpus callosum as determined by MR imaging. Genetically, patients in family 1 carried compound heterozygous mutations at c.6091C>T and c.4461..4462delGT, whereas the brothers from family 2, involving a consanguineous marriage, carried a homozygous deletion at c.4461..4462delGT.17 All patients underwent neuropsychological assessments and took part in the DSI study. Ten sex- and age-matched healthy subjects were also included in the DSI study. The study was approved by the Research Ethics Committee of National Taiwan University Hospital. The procedures and purpose of the study were clearly explained to the subjects before participation, and written informed consent was obtained.
Table 1:
Personal profiles and cognitive functions for patients with ARHSP-TCC with SPG11 mutations
| Family 1 |
Family 2 |
||||
|---|---|---|---|---|---|
| P1 | P2 | P3 | P4 | P5 | |
| Sex/age at examination (yr) | F/34 | F/28 | M/25 | M/35 | M/30 |
| Age at onset (yr) | |||||
| Cognitive decline | 9 | 15 | 9 | 12 | 10 |
| Gait disturbance | 17 | 18 | 13 | 16 | 15 |
| Neuropsychological tests | |||||
| WAIS-III | |||||
| Full-scale IQ | 47a | 47a | 50b | 49a | 49a |
| Verbal IQ | 45a | 47a | 48b | 44a | 45a |
| Performance IQ | 46a | 44a | 51b | 52b | 49a |
| MMSE | |||||
| Full score | 13a | 19b | 19b | N | 14a |
| Orientation | 3/10 | 6/10 | 9/10 | 4/10 | |
| Attention and calculation | 0/5 | 0/5 | 1/5 | 0/5 | |
| Registration | 3/3 | 3/3 | 2/3 | 2/3 | |
| Memory (3-object recall) | 2/3 | 2/3 | 1/3 | 0/3 | |
| Language and construction | 5/9 | 8/9 | 6/9 | 8/9 | |
| Lower limb pyramidal signs | |||||
| Hyperreflexiac | +++ | +++ | ++++ | ++++ | +++ |
| Spasticityd | 2 | 2 | 3 | 4 | 3 |
Note:—P indicates patient; F, female; M, male; N, not performed; +++, XXX; ++++, XXX; ++, XXX; WAIS-III, Weichsler Adult Intelligence Scale-III; MMSE, Mini-Mental State Examination.
Last 0.1 Percentile.
Last percentile.
Tendon Reflex Grading Scale.
Modified Ashworth Scale.
MR Imaging Acquisition
All participants were scanned on a 3T MR imaging system (Magnetom Trio; Siemens, Erlangen, Germany) by using a 12-channel phased array head coil. All images were prescribed in the transaxial plane parallel to the anterior/posterior commissure line. For anatomic normalization, T2-weighted MR images were acquired with TR/TE = 5920/102 ms, section thickness = 3.9 mm, flip angle = 150°, acquisition matrix = 256 × 256, and FOV = 25 × 25 cm.
DSI was performed by using a pulsed gradient spin-echo single-shot EPI sequence; a twice-refocused balanced echo was incorporated into the sequence to minimize the image distortion due to eddy current effects.18 Forty-five sections were acquired encompassing the whole brain. For each brain volume, 203 diffusion-weighted images were acquired by applying 203 diffusion-sensitive gradients corresponding to Cartesian grid points within a sphere of the q-space with a radius of 3 units. The sequence parameters were maximum diffusion sensitivity (bmax) = 6000 s/mm2, TR/TE = 9100/142 ms, 128 × 128 acquisition matrix, and isotropic resolution of 2.9 mm3. The total acquisition time for the T2-weighted images and DSI was approximately 40 minutes.
DSI Data Analysis
DSI Data Reconstruction.
DSI data analysis was performed with an in-house program developed in Matlab 7.0 (Mathworks, Natick, Massachusetts). Data analysis of the diffusion probability attenuation function at each voxel was performed with Fourier transform of the DSI signal in the q-space.19 To do this, we filled 8 corners of the cube in the q-space that were not sampled by DSI and applied a Hanning filter of 17-inch width to the q-space data. 3D Fourier transform was then performed on the filtered data to obtain the probability attenuation function.20 The orientation distribution function in 362 radial directions (6-fold tessellated icosahedron) was obtained by computing the second moment of probability attenuation function along each corresponding direction. Having obtained the orientation distribution function, we derived an index similar to fractional anisotropy, called GFA,21 from the original orientation distribution function (See On-line Appendix for details).
The value of GFA depends on the directional coherence, attenuation, and myelination of the fibers.22 Like fractional anisotropy, GFA has been used to investigate microstructural integrity.23 To determine the intravoxel fiber orientations, we used an iterative approach to decompose the original orientation distribution function into several constituent Gaussian orientation distribution functions corresponding to the primary orientations within each voxel.24
Template-Based Region-of-Interest Selection.
We analyzed major cerebral fiber tracts including the CC, arcuate fasciculus, cingulum bundle, and CST. To perform tractography reconstruction objectively, we used an expert-monitored multiple region-of-interest strategy with whole-brain seeding.12 To do this, we coregistered each individual's DSI dataset to his or her own T2-weighted MR images by 3D affine transform. T2-weighted images of each subject were mapped to a standard Montreal Neurological Institute template by 3D nonlinear transform. Predefined cortical/subcortical regions were selected on the template by using MARINA software (Bender Institute of Neuroimaging, Giessen, Germany). Because the CC is composed of a large collection of commissure fibers, we subdivided it into 7 portions (orbitofrontal, prefrontal, motor, sensory, parietal, temporal, and occipital) according to the innervated cortical regions. Two ROIs on the bilateral orbitofrontal gyri were identified for the orbitofrontal portion of the CC. Bilateral prefrontal, precentral, postcentral, parietal, temporal, and occipital gyri were selected according to the same algorithm (Fig 1A). For the arcuate fasciculus, 2 ROIs on the ipsilateral inferior frontal and superior temporal gyri were identified (Fig 1B). For the cingulum bundle, 3 ROIs on the ipsilateral anterior, middle, and posterior cingulate gyri were identified (Fig 1C). For the CST, 2 ROIs on the ipsilateral precentral gyrus and whole pyramids on the lower medulla were identified (Fig 1D). Thirteen sets of ROIs were identified for 13 fiber tract bundles, namely the bilateral arcuate fasciculi, bilateral cingulum bundles, bilateral CSTs, and 7 portions of the CC. After identifying the ROIs on the Montreal Neurological Institute template, we mapped each of the coordinates of each region of interest back to the subject's brain through inverse transformation as determined above. The spatial normalization was performed by using the built-in functions of SPM5 (Wellcome Department of Imaging Neuroscience, London, UK).
Fig 1.

Examples of ROIs and reconstructed tracts. A, ROIs of orbitofrontal (green and yellow), motor (light and dark brown), and occipital (greenish blue and blue) portions of the CC. B, ROIs (blue and yellow) of the left arcuate fasciculus. C, ROIs (dark brown, light brown, and yellow) of the left cingulum bundle. D, ROIs (yellow, dark brown, and light brown) of the bilateral CSTs. The fiber tracts are pseudocolored in 3D according to the local tract orientation with respect to the image coordinates.
DSI Tractography.
After ROIs were transformed to each individual's DSI dataset, tractography was performed on the basis of the resolved fiber vector fields provided by DSI under a streamline-based fiber tracking algorithm. The voxels with GFA values higher than a given threshold of 0.05 were selected as the white matter regions and were used as seed voxels for tractography over the whole brain. For each seed voxel, the proceeding orientation for the next step was decided by the angular deviation between the primary orientation within the seed and all the fiber orientations of its nearest voxels; the most coincident orientation with the minimum angular deviation was chosen. By moving the seed point a proceeding length of 0.5 voxels for each step along the most coincident orientation, we then obtained the new starting point. Note that once all the angle deviations were higher than a given angular threshold, in our case 30°, the tracking would stop. These procedures were repeated, and the fiber tracts over the whole brain were then obtained. Each tract was defined by those reconstructed fibers that fulfilled the corresponding region-of-interest constraints. The DSI tractography was reconstructed and visualized by using in-house software (DSI Studio, http://dsi-studio.labsolver.org), which provided the reconstruction and real-time interactive visualization of the tractography.
For tractography-based analysis, GFA was used as the index of the microstructural integrity of the white matter to be compared.21 GFA values corresponding to different fiber bundles were sampled according to the position coordinates of the tracts, and the mean GFA value for each fiber bundle was calculated as an index for tract-to-tract comparisons.
Tract-specific analysis was performed on the basis of a mean path algorithm developed in-house.12 For each step, the algorithm calculated the mean direction of the fiber tract and mean GFA values along the tract. Because the fiber direction and length varied in each individual, especially in the cortical and subcortical white matter regions, the total step amount also varied between tracts. To perform point-to-point comparisons reliably, we reassigned and normalized the step count along each reconstructed CST to 31 steps between 2 anatomic landmarks, the internal capsule and the pyramid. The landmarks were chosen for 2 reasons: First, brain stem structures were relatively conserved across all individuals; and second, CST fibers were condensed between the internal capsule and the pyramid.
Statistical Analysis
The Statistical Package for the Social Sciences, Version 13.0 (SPSS, Chicago, Illinois) was used for the following analyses. Raw GFA values were used for pair-wise comparisons, and normalized GFA values were used for multigroup or post hoc comparisons. Normalized GFA values were defined as the GFA value of individual tracts in patients divided by GFA values in corresponding controls (GFA patient/GFA control). All subjects' GFA maps were coregistered to a healthy control's GFA map by using SPM5. Whole-brain voxel-based analysis was applied to analyze voxel-by-voxel differences in GFA between the 2 groups, and a voxelwise t test was performed to demonstrate the statistical difference. For tractography-based analysis, nonparametric tests or correction methods were conducted to avoid false-positive results that can occur because of small sample sizes. Mann-Whitney U tests were performed for mean GFA comparisons of each fiber tract between patients and healthy subjects. Beyond analysis of each tract, we also conducted group analysis among different fiber types including commissure fibers (7 portions of the CC), association fibers (arcuate fasciculus, cingulum bundle), and projection fibers (CST). Two-factorial ANOVA (Group × Fiber Type) with Bonferroni correction was used to differentiate microstructural integrity between the different groups, and post hoc pair-wise comparisons were used between each of the 7 portions of the CC. For the tract-specific analysis, we used a linear logistic regression to measure the GFA decrement along the CST.
Results
Five patients (3 men, 2 women; mean age, 30.4 years) were examined. The demographic data and neuropsychological features are summarized in Table 1. In addition to progressive leg spasticity and gait disturbances, the patients had already developed widespread cognitive decline. On the basis of the Weichsler Adult Intelligence Scale-III test, the full-scale intelligence quotient score fell between 47 and 50, which was conspicuously lower than an age-matched population of control subjects. Both language- (verbal IQ) and nonlanguage- (performance IQ) related domains were involved in this test. The Mini-Mental State Examination also showed a moderate-to-severe cognitive dysfunction, ranging from 13 to 19 points, with involvement of all categories to various degrees.
Voxel-based analysis of GFA revealed a generalized reduction of GFA in patients (Fig 2A). Fiber reconstruction and GFA reduction of each tract are summarized in Fig 2 and Table 2. For the group analysis, GFA values in patients were significantly reduced in all fiber types (2-way ANOVA, GFA × Fiber Type, F(1,124) = 134.591, P < .000001). Post hoc analysis among fiber types (commissure, association, and projection) showed that both commissure and association fibers were significantly worse than the projection fibers (Bonferroni correction, both P < .00001, Fig 3A). Detailed analysis of each individual tract revealed that prefrontal and motor parts were most severely involved among all portions of the CC (Bonferroni correction, P < .0001 and P = .0178 respectively, Fig 3B). The association fibers, including the arcuate fasciculus and cingulum bundle, were equally affected (Bonferroni correction, P > .99 in all pair-wise comparisons). The CST was less involved than all portions of the CC and association fibers (Bonferroni correction, P < .0001 in all pair-wise comparisons). Finally, the involvement of both sides of the association fibers and CST was comparable (Bonferroni correction, P = 1).
Fig 2.
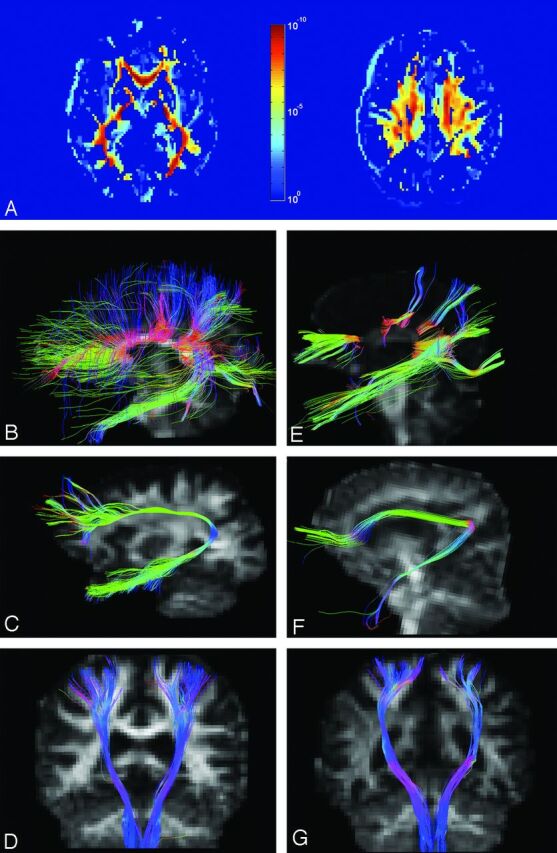
P value map and tractography in patients and controls. A, P value map shows significant differences in microstructure integrity of white matter between patients and controls. B–D, Reconstructive tracts of the CC, arcuate fasciculus, and CST in a control subject. E–G, Corresponding tracts in patient 3.
Table 2:
Comparison of GFAs in different fiber types and individual tracts
| HSP (n = 5) |
Control (n = 10) |
HSP (n = 5) |
Control (n = 10) |
||||
|---|---|---|---|---|---|---|---|
| Mean | Mean | P Valuea | Mean | Mean | P Valuea | ||
| Commissure | 0.14 ± 0.08 | 0.33 ± 0.04 | <.0001 | CC_orbitofrontal | 0.13 ± 0.04 | 0.29 ± 0.02 | .008 |
| CC_prefrontal | 0.05 ± 0.07 | 0.31 ± 0.04 | .008 | ||||
| CC_motor | 0.12 ± 0.11 | 0.34 ± 0.03 | .008 | ||||
| CC_sensory | 0.17 ± 0.10 | 0.31 ± 0.02 | .008 | ||||
| CC_parietal | 0.16 ± 0.04 | 0.32 ± 0.04 | .008 | ||||
| CC_temporal | 0.18 ± 0.05 | 0.33 ± 0.02 | .008 | ||||
| CC_occipital | 0.29 ± 0.04 | 0.38 ± 0.03 | .008 | ||||
| Association | 0.14 ± 0.06 | 0.29 ± 0.03 | <.0001 | AF_left | 0.15 ± 0.09 | 0.27 ± 0.03 | .015 |
| AF_right | 0.13 ± 0.08 | 0.30 ± 0.03 | .008 | ||||
| CB_left | 0.13 ± 0.03 | 0.28 ± 0.03 | .008 | ||||
| CB_right | 0.16 ± 0.02 | 0.30 ± 0.03 | .008 | ||||
| Projection | 0.28 ± 0.03 | 0.33 ± 0.03 | .009 | CST_left | 0.28 ± 0.03 | 0.33 ± 0.03 | .032 |
| CST_right | 0.29 ± 0.04 | 0.32 ± 0.04 | .151 | ||||
Note:—HSP indicates hereditary spastic paraparesis; AF, arcuate fasciculus; CB, cingulum bundle.
P values were calculated by Mann-Whitney U tests.
Fig 3.

Quantitative evaluation of microstructural integrity of fiber tracts. A, Mean GFA values of commissure, association, and projection fibers in patients (white bars) and controls (gray bars) and normalized GFA values (patients/controls, black bars) in each fiber type (double asterisks indicate P < .0001; asterisk, P < .001). B, Normalized GFA value of each fiber tract of the corpus callosum (double asterisks indicate P < .0001; asterisk, P = .0178). C, Mean GFA value of controls (black line, filled circles) and patients (gray line, open circles) along the CSTs from the motor cortices (step 71, x-axis) to the pyramid (step 1, x-axis). D, Normalized GFA value of CSTs between the pyramid to the internal capsule and the linear regression values.
A tract-specific analysis was conducted along the CST (Fig 3C) and anatomically normalized between the pyramid (step 1) and internal capsule (step 31). Point-to-point comparison along this segment showed a strong negative correlation (R2 = 0.687, P < .00001, Fig 3D), which indicated a progressive reduction of GFA from the internal capsule to the pyramid.
Discussion
Thinning of the CC and the presence of periventricular white matter lesions are the major hallmarks of patients with ARHSP-TCC and are typically associated with cognitive impairment.25,26 Most of the previous studies focused on novel mutations within the SPG11 gene, and only 2 DTI studies reported the white matter changes.6,7 Both studies used voxel-based analysis of fractional anisotropy and found diffuse white matter involvement in the areas related to the CC, cerebellum, thalamus, brain stem, internal capsule, cingulum, and superior and inferior longitudinal fascicles. Our results of voxel-based analysis showed a global reduction in the white matter GFA, consistent with that in previous reports.6,7 In addition, we calculated the GFA values along each tract bundle, providing information about microstructural integrity specific to the tracts of interest. This result was achieved owing to the superior ability of DSI to resolve crossed fibers, making tractography-based analysis feasible. With the advantages of DSI, there were 3 novel findings in patients with ARHSP-TCC: 1) The prefrontal and motor portions of the CC were preferentially affected; 2) the association fibers shared similar severity as commissure fibers, while projection fibers were less involved; and 3) tract-specific analysis in CST identified a gradual reduction of microstructural integrity along the rostral-caudal fiber direction.
Thinning of the CC is a key manifestation in ARHSP-TCC. Our results suggest that there is a preferential involvement of the CC prefrontal and motor areas; the decrease of GFA in these 2 areas, though severe, may still be underestimated. Direct visualization of the reconstructed fibers (Fig 2E) shows that callosal fibers in the prefrontal and motor portions of the CC are actually sparse, implying that GFA in these 2 portions of the CC fell below the tractography threshold of 0.05. In the current analysis, we also found that the occipital portion of the CC was least affected among all CC fibers (Table 2). This finding is consistent with those in previous imaging studies demonstrating that thinning of the CC was relatively spared in the splenium of patients with ARHSP-TCC.25,27 The preserved occipital portion of the CC may help explain the fact that no visual symptoms have been observed in the clinical spectrum of ARHSP-TCC. On the other hand, the preferential involvement of the prefrontal portions of the CC may relate to a consistent observation of the slow mental executive speed in patients.
Early and widespread involvement of cognitive functions across all domains is a well-known phenomenon in ARHSP-TCC.3,26 On the other hand, thinning of the CC is the predominant and often only imaging feature found in early ARHSP-TCC. Verbal and memory functions are related to interlobule connections and remain unaffected after callosotomy.28,29 This functional-anatomic dissociation can be partially explained by cerebral hypometabolism at bilateral sensorimotor cortices, thalami, and probably medial frontal cortices in later stages of the disease.25,30,31 Our results revealed that association fibers were affected diffusely with severity comparable to that in colossal fibers. Severely impaired microstructural integrity in association fibers might be another theory explaining diffuse cognitive deficits with respect to the current theory of restricted cerebral hypometabolism. Most interesting, we observed that the GFA of the association fibers tended to have a positive correlation with the full and performance IQ in patients. However, our study is limited by the small sample size; as such, the correlation between cognitive tasks and microstructural integrity awaits bigger cohorts or meta-analysis.
In this study, we selected the CST for tract-specific analysis because most of the fibrils here align in the rostral-caudal direction instead of reciprocal innervations. We consistently observed a progressive decrease of GFA along the path of CST in all patients. The finding strongly indicates a dying-back process, which is compatible with the clinical observation that spastic paraparesis emerges from the lower limbs, because the dying-back phenomenon is the principal manifestation of disturbed axonal transport.32 Spatacsin, the SPG11 product, is strongly expressed in both human and rat central nervous systems. It is colocalized with protein-trafficking vesicles, endoplasmic reticulum, and microtubules, all of which are crucial elements of axonal transport.33 In sural nerve biopsies from patients with ARHSP-TCC, the axonal loss and accumulation of pleomorphic membranous materials in unmyelinated axons are suggestive of disturbed axonal transport.25 Our tract-specific analysis is the first to noninvasively observe the dying back phenomenon in ARHSP-TCC, and this finding suggests that disturbed axonal transport might be a key pathogenesis of CNS fiber degeneration in ARHSP-TCC.
Conclusions
In patients with ARHSP-TCC with known SPG11 mutations, we demonstrated a characteristic gradation in the reduction of microstructural integrity between different fiber types and within the corpus callosum. The projection fibers are relatively preserved, and the prefrontal regions of the CC are most severely affected. The dying-back pattern in the CST suggests that disturbed axonal transport, also observed in sural nerves, might be one of the mechanisms of tract degeneration. Tractography-based analysis and tract-specific analysis based on DSI are potentially promising tools to evaluate the microstructural integrity in hereditary spastic paraparesis and to reveal the possible pathogenesis of the disease.
Supplementary Material
Acknowledgments
We thank all the patients who participated in this study.
ABBREVIATIONS:
- ARHSP-TCC
autosomal recessive hereditary spastic paraparesis with thin corpus callosum
- CC
corpus callosum
- CST
corticospinal tract
- DSI
diffusion spectrum imaging
- GFA
generalized fractional anisotropy
Footnotes
Disclosures: Ming-Jen Lee—RELATED: Grant: National Science Council (NSC99-3112-B-002-012).* Wen-Yih Tseng—RELATED: Grant: National Science Council (Taiwanese government), grant number NSC 5-2314-B-002-142-MY3, NSC98-2752-M-002-005-PAE.* *Money paid to the institution.
This work was supported by the National Science Council, Taiwanese government: grant number NSC 5-2314-B-002-142-MY3, and NSC98-2752-M-002-005-PAE.
References
- 1. Reid E. Science in motion: common molecular pathological themes emerge in the hereditary spastic paraplegias. J Med Genet 2003;40:81–86 [DOI] [PMC free article] [PubMed] [Google Scholar]
- 2. Schüle R, Schols L. Genetics of hereditary spastic paraplegias. Semin Neurol 2011;31:484–93 [DOI] [PubMed] [Google Scholar]
- 3. Ueda M, Katayama Y, Kamiya T, et al. Hereditary spastic paraplegia with a thin corpus callosum and thalamic involvement in Japan. Neurology 1998;51:1751–54 [DOI] [PubMed] [Google Scholar]
- 4. Nakamura A, Izumi K, Umehara F, et al. Familial spastic paraplegia with mental impairment and thin corpus callosum. J Neurol Sci 1995;131:35–42 [DOI] [PubMed] [Google Scholar]
- 5. Stevanin G, Santorelli FM, Azzedine H, et al. Mutations in SPG11, encoding spatacsin, are a major cause of spastic paraplegia with thin corpus callosum. Nat Genet 2007;39:366–72 [DOI] [PubMed] [Google Scholar]
- 6. Chen Q, Lui S, Wang JG, et al. Diffusion tensor imaging of two unrelated Chinese men with hereditary spastic paraplegia associated with thin corpus callosum. Neurosci Lett 2008;441:21–24 [DOI] [PubMed] [Google Scholar]
- 7. França MC, Jr, Yasuda CL, Pereira FR, et al. White and grey matter abnormalities in patients with SPG11 mutations. J Neurol Neurosurg Psychiatry 2012;83:828–33 [DOI] [PubMed] [Google Scholar]
- 8. Lin CP, Wedeen VJ, Chen JH, et al. Validation of diffusion spectrum magnetic resonance imaging with manganese-enhanced rat optic tracts and ex vivo phantoms. Neuroimage 2003;19:482–95 [DOI] [PubMed] [Google Scholar]
- 9. Wedeen VJ, Wang RP, Schmahmann JD, et al. Diffusion spectrum magnetic resonance imaging (DSI) tractography of crossing fibers. Neuroimage 2008;41:1267–77 [DOI] [PubMed] [Google Scholar]
- 10. Chiu CH, Lo YC, Tang HS, et al. White matter abnormalities of fronto-striato-thalamic circuitry in obsessive-compulsive disorder: a study using diffusion spectrum imaging tractography. Psychiatry Res 2011;192:176–82 [DOI] [PubMed] [Google Scholar]
- 11. Liu IC, Chiu CH, Chen CJ, et al. The microstructural integrity of the corpus callosum and associated impulsivity in alcohol dependence: a tractography-based segmentation study using diffusion spectrum imaging. Psychiatry Res 2010;184:128–34 [DOI] [PubMed] [Google Scholar]
- 12. Lo YC, Soong WT, Gau SS, et al. The loss of asymmetry and reduced interhemispheric connectivity in adolescents with autism: a study using diffusion spectrum imaging tractography. Psychiatry Res 2011;192:60–66 [DOI] [PubMed] [Google Scholar]
- 13. Tang PF, Ko YH, Luo ZA, et al. Tract-specific and region of interest analysis of corticospinal tract integrity in subcortical ischemic stroke: reliability and correlation with motor function of affected lower extremity. AJNR Am J Neuroradiol 2010;31:1023–30 [DOI] [PMC free article] [PubMed] [Google Scholar]
- 14. Coleman M. Axon degeneration mechanisms: commonality amid diversity. Nat Rev Neurosci 2005;6:889–98 [DOI] [PubMed] [Google Scholar]
- 15. Coleman MP, Perry VH. Axon pathology in neurological disease: a neglected therapeutic target. Trends Neurosci 2002;25:532–37 [DOI] [PubMed] [Google Scholar]
- 16. Donat JR, Wisniewski HM. The spatio-temporal pattern of Wallerian degeneration in mammalian peripheral nerves. Brain Res 1973;53:41–53 [DOI] [PubMed] [Google Scholar]
- 17. Lee MJ, Cheng TW, Hua MS, et al. Mutations of the SPG11 gene in patients with autosomal recessive spastic paraparesis and thin corpus callosum. J Neurol Neurosurg Psychiatry 2008;79:607–09 [DOI] [PubMed] [Google Scholar]
- 18. Reese TG, Heid O, Weisskoff RM, et al. Reduction of eddy-current-induced distortion in diffusion MRI using a twice-refocused spin echo. Magn Reson Med 2003;49:177–82 [DOI] [PubMed] [Google Scholar]
- 19. Wedeen VJ, Hagmann P, Tseng WY, et al. Mapping complex tissue architecture with diffusion spectrum magnetic resonance imaging. Magn Reson Med 2005;54:1377–86 [DOI] [PubMed] [Google Scholar]
- 20. Callaghan PT, Coy A, MacGowan D, et al. Diffraction-like effects in NMR diffusion studies of fluids in porous solids. Nature 1991;351:467–69 [Google Scholar]
- 21. Tuch DS. Q-ball imaging. Magn Reson Med 2004;52:1358–72 [DOI] [PubMed] [Google Scholar]
- 22. Basser PJ, Pierpaoli C. Microstructural and physiological features of tissues elucidated by quantitative-diffusion-tensor MRI. J Magn Reson B 1996;111:209–19 [DOI] [PubMed] [Google Scholar]
- 23. Takagi T, Nakamura M, Yamada M, et al. Visualization of peripheral nerve degeneration and regeneration: monitoring with diffusion tensor tractography. Neuroimage 2009;44:884–92 [DOI] [PubMed] [Google Scholar]
- 24. Yeh CH, Cho KH, Lin HC, et al. Reduced encoding diffusion spectrum imaging implemented with a bi-Gaussian model. IEEE Trans Med Imaging 2008;27:1415–24 [DOI] [PubMed] [Google Scholar]
- 25. Hehr U, Bauer P, Winner B, et al. Long-term course and mutational spectrum of spatacsin-linked spastic paraplegia. Ann Neurol 2007;62:656–65 [DOI] [PubMed] [Google Scholar]
- 26. Rajakulendran S, Paisan-Ruiz C, Houlden H. Thinning of the corpus callosum and cerebellar atrophy is correlated with phenotypic severity in a family with spastic paraplegia type 11. J Clin Neurol 2011;7:102–04 [DOI] [PMC free article] [PubMed] [Google Scholar]
- 27. Vucic S, Lye T, Dunn G, et al. Autosomal recessive hereditary spastic paraparesis with thin corpus callosum; report of two sisters. J Clin Neurosci 2004;11:427–30 [DOI] [PubMed] [Google Scholar]
- 28. Campo P, Leon-Carrion J, Dominguez-Roldan JM, et al. Pre-postoperative neuropsychological evaluation in the surgical treatment of epilepsy. Rev Neurol 1998;27:616–25 [PubMed] [Google Scholar]
- 29. Ojemann GA. Surgical therapy for medically intractable epilepsy. J Neurosurg 1987;66:489–99 [DOI] [PubMed] [Google Scholar]
- 30. Orlén H, Melberg A, Raininko R, et al. SPG11 mutations cause Kjellin syndrome, a hereditary spastic paraplegia with thin corpus callosum and central retinal degeneration. Am J Med Genet B Neuropsychiatr Genet 2009;150B:984–92 [DOI] [PubMed] [Google Scholar]
- 31. Samaranch L, Riverol M, Masdeu JC, et al. SPG11 compound mutations in spastic paraparesis with thin corpus callosum. Neurology 2008;71:332–36 [DOI] [PubMed] [Google Scholar]
- 32. Griffin JW, Watson DF. Axonal transport in neurological disease. Ann Neurol 1988;23:3–13 [DOI] [PubMed] [Google Scholar]
- 33. Murmu RP, Martin E, Rastetter A, et al. Cellular distribution and subcellular localization of spatacsin and spastizin, two proteins involved in hereditary spastic paraplegia. Mol Cell Neurosci 2011;47:191–202 [DOI] [PubMed] [Google Scholar]
Associated Data
This section collects any data citations, data availability statements, or supplementary materials included in this article.