We read with great interest the recent study published in the American Journal of Neuroradiology on November 22, 2012, entitled “T1-Weighted Dynamic Contrast-Enhanced MR Evaluation of Different Stages of Neurocysticercosis and Its Relationship with Serum MMP-9 Expression.”1
In the Materials and Methods section, the authors describe their dynamic contrast-enhanced (DCE) study protocol as follows: “A series of 384 images during 32 time points for 12 sections were acquired (temporal resolution, 5.65 seconds).” However, 32 time points × 5.65 seconds of temporal resolution results in a 3-minute-long DCE-MR study. The specific pharmacokinetic model and the postprocessing software used for calculation of the transfer constant (Ktrans); rate constant between extracellular extravascular space and blood plasma (Kep); and leakage space (Ve) are not stated in the article.
We have been using DCE-MR imaging as a part of our tumor protocol since 2010. We usually perform a 4-minute DCE study. With a study of this length, the washout phase is not usually reached in brain tumors. Inflammatory lesions such us neurocysticercosis are known to wash out much later than tumors as the result of their low permeability surface area product (PS).
In their article published in 1991, Tofts and Kermode2 generated families of tracer concentration in tissue [Ct(t)] curves from their equation and demonstrated that for fixed permeability, increasing Ve has no effect on the initial slope but does affect the maximum concentration reached and delays the time to peak enhancement. From this assessment, we infer that reaching the washout phase is needed to obtain Ve and Kep.
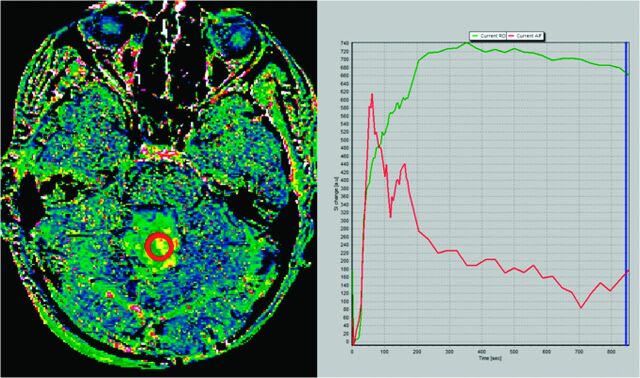
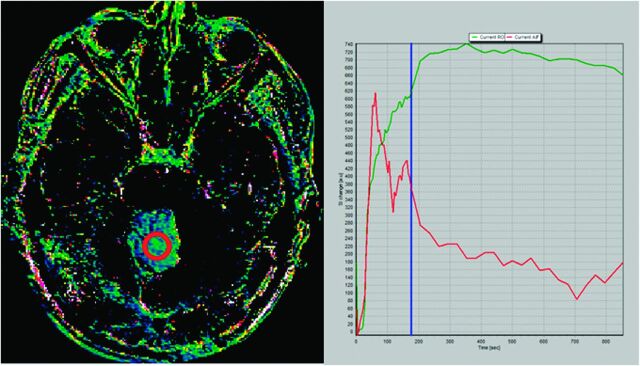
To confirm our hypothesis, we performed a 14-minute DCE study in a patient with pilocytic astrocytoma. Maximum enhancement is reached at 5.8 minutes, and a slow washout curve then begins. We performed 2 different Kep calculations: the first one by use of the first 3 minutes of the DCE study and the second one by use of the whole 15-minute sequence. Resulting Kep values are as different as Kep (3-minute DCE): 0.50 minutes−1 and Kep (14-minute DCE): 0.13 minutes−1. T1 kinetic analysis was based on the 2-compartment extended pharmacokinetic model of Tofts and Kermode by use of nordicICE software (NordicImagingLab, Bergen, Norway) (Figs 1 and 2).
Fig 1.
Kep map obtained at 14 minutes in a cerebellar pilocytic astrocytoma (left image). Green curve represents the time–signal intensity curve of a region of interest (red circle in left image); red curve represents measured arterial input function; blue line corresponds to the last image considered for calculation (14 minutes) (right image). Kep value calculated for the whole 14-minute DCE study was 0.13 minutes−1.
Fig 2.
Kep map obtained at 3 minutes in a cerebellar pilocytic astrocytoma (left image). Green curve represents the time–signal intensity curve of a region of interest (red circle in left image); red curve represents measured arterial input function; blue line corresponds to the last image considered for calculation (3 minutes) (right image). At 3 minutes, the washout phase has not been reached and Kep value in this region of interest was 0.50 minutes−1.
To sum up, the effect of not collecting for long enough to reach the washout phase would be that Ve and Kep would be imprecise (ie, poor repeatability), and the performance of those biomarkers would be compromised. Available DCE software provides Kep and Ve maps even without the data needed to support those calculations, and we should be aware of this fact.
Acknowledgments
We thank Professor Paul Tofts for his help.
References
- 1. Gupta RK, Awasthi R, Garg RK, et al. T1-weighted dynamic contrast-enhanced MR evaluation of different stages of neurocysticercosis and its relationship with serum MMP-9 expression. AJNR Am J Neuroradiol 2012. November 22, 2012 [Epub ahead of print] [DOI] [PMC free article] [PubMed] [Google Scholar]
- 2. Tofts PS, Kermode AG. Measurement of the blood-brain barrier permeability and leakage space using dynamic MR imaging, 1: fundamental concepts. Magn Reson Med 1991;17:357–67 [DOI] [PubMed] [Google Scholar]


