

Abstract
BACKGROUND AND PURPOSE:
Simultaneous EEG/fMRI is an effective noninvasive tool for identifying and localizing the SOZ in patients with focal epilepsy. In this study, we evaluated different thresholding strategies in EEG/fMRI for the assessment of hemodynamic responses to IEDs in the SOZ of drug-resistant epilepsy.
MATERIALS AND METHODS:
Sixteen patients with focal epilepsy were examined by using simultaneous 92-channel EEG and BOLD fMRI. The temporal fluctuation of epileptiform signals on the EEG was extracted by independent component analysis to predict the hemodynamic responses to the IEDs. We applied 3 different threshold criteria to detect hemodynamic responses within the SOZ: 1) PA, 2) a fixed threshold at P < .05 corrected for multiple comparison (FWE), and 3) FAV (4000 ± 200 activated voxels within the brain).
RESULTS:
PA identified the SOZ in 9 of 16 patients; FWE resulted in concordant BOLD signal correlates in 11 of 16, and FAV in 13 of 16 patients. Hemodynamic responses were detected within the resected areas in 5 (PA), 6 (FWE), and 8 (FAV) of 10 patients who remained seizure-free after surgery.
CONCLUSIONS:
EEG/fMRI is a noninvasive tool for the presurgical work-up of patients with epilepsy, which can be performed during seizure-free periods and is complementary to the ictal electroclinical assessment. Our findings suggest that the effectiveness of EEG/fMRI in delineating the SOZ may be further improved by the additional use of alternative analysis strategies such as FAV.
One key to achieving a successful outcome of epilepsy surgery is the precise identification of the SOZ, defined as the “area of the cortex from which clinical seizures are actually generated.”1 Approximately 30% of presurgical candidates are not considered for epilepsy surgery, mainly due to a lack of unambiguous localization of the SOZ.2 Recent studies of the use of simultaneous EEG/fMRI during the seizure-free period have reported concordance between interictal hemodynamic responses (ie, the irritative zone) and ictal electroclinical data.3–7 These findings corroborate previous EEG studies showing strong correlation between the zone of earliest (interictal) spike and the SOZ, indicating a common epileptogenic brain area.8 The irritative zone may thus encompass the SOZ. BOLD signal correlates of IEDs, similar to ictal SPECT recordings,9 may be widespread and multifocal.9 Thus, the identification of those that correspond to the SOZ—of crucial interest in presurgical evaluation—is sometimes equivocal.10,11
IC analysis is increasingly recognized as a helpful additive for the analysis of complex neurophysiologic signals and fMRI data.12,13 Recently, we have introduced IC analysis as a novel approach to extracting epileptic activity from combined EEG/fMRI recordings. The IC-based approach resulted in a decrease of nonlocalizing coactivations and increased sensitivity in the delineation of the irritative zone compared with established methods of manual spike detection.6,14,15 A principal advantage of the IC-based approach is the ability to model epileptic activity more physiologically, taking into account variation in amplitude, duration, and shape of IEDs, especially when high-resolution EEG is performed.16 Integration of individual amplitudes of IEDs in EEG/fMRI analysis has been recently reported to yield BOLD signal correlates that are more confined to the SOZ.17 A good reliability of the IC-based approach has been reported to identify factors coding for the epileptic activity.18
A principal limitation in EEG/fMRI analysis is related to the selection of the optimal thresholding strategy to limit hemodynamic responses along propagation pathways (so-called coactivations) without eliminating the hemodyanamic responses at the SOZ. Currently, 2 strategies are used. The first applies a fixed threshold of P < .05 corrected for FWE and commonly results in variable interpretations of BOLD signal correlates from “no activation” to “widespread clusters” of activation.10,11 Both no activation and widespread activation patterns provide no reliable clues for delineating a focal SOZ. The second, the PA strategy, identifies the cortical zone of the maximum correlation between the BOLD signal and the IEDs. The PA criterion is thought to reflect the most active hemodynamic response to IEDs, which is reported to be confined to epileptogenic brain areas.19 Previous studies applying the PA criterion reported convergence between BOLD responses and the SOZ.19–24 However, the BOLD signal change due to IEDs is not uniform, as indicated by variously positive or negative BOLD correlates co-localizing to the SOZ in focal epilepsies.22,25
The potential disadvantage of using these 2 approaches is an increased risk of missing the true effects at the SOZ. The largest study of EEG/fMRI in presurgical work-up to date recommended analysis of recordings at alternative thresholds in equivocal cases to enhance the localizing value of EEG/fMRI.26 For the routine use of combined EEG/fMRI, however, standardization of criteria regarding clinical analysis is mandatory.27 We have thus added an additional analysis criterion, a predefined FAV,28 to account for intra- and interindividual differences and fluctuations in epileptic activity. We analyzed these threshold criteria (FWE, PA, and FAV) with respect to detection of hemodynamic responses in the SOZ and overlap with ictal EEG and clinical outcomes after surgery.
Materials and Methods
Subjects
Patients (11 women, 5 men; mean age, 40 years; range, 20–68 years) with drug-resistant focal epilepsies were prospectively recruited from our presurgical epilepsy program. An inclusion criterion for evaluation by EEG/fMRI recordings was the detection of IEDs on previous standard scalp EEG recordings. Patient clinical characteristics are summarized in the On-line Table.
Patients were evaluated by board-certified neurologists with a subspecialization in epileptology (K.S., K.M.). All patients underwent surface EEG with 19 electrodes placed according to the international 10–20 system and high-resolution structural MR imaging on a 3T system (Magnetom Trio TIM; Siemens, Erlangen, Germany), according to the local epilepsy protocol. All patients were evaluated by long-term video-EEG for diagnosis and seizure classification.29 Patients 1, 5, 6, and 9 were also recorded with subdural foramen ovale electrodes according to Wieser et al.30 Patients 8 and 11–16 underwent invasive EEG recording with subdural strips and placement of depth electrodes along the longitudinal axis of the hippocampus according to Spencer.31 Presurgical classification of the underlying epileptic syndrome was as follows: 10 patients (1–10) with MTLE; 4 patients (11, 14–16) with LTLE, 1 patient (12) with frontal lobe epilepsy, and 1 patient (13) with parietal lobe epilepsy. The electroclinically defined SOZ in MTLE was identified as the hippocampal formation and amygdala on the symptomatic side. In neocortical epilepsies, the SOZ was defined as the area enclosed by a 10-mm radius from the point at which invasive EEG electrodes documented seizure onset.
Eleven patients underwent epilepsy surgery (6 patients with MTLE underwent selective anterior amygdalohippocampectomy, 1 underwent anterior temporal lobectomy, 4 patients with neocortical epilepsy underwent tailored resection). The area of resection was defined on the postoperative structural MR imaging. Nine of 11 patients were seizure-free (Engel class Ia) after surgery, patient 7 was classified as Engel class II, and patient 8 was classified as Engel class IV. Mean follow-up was 32 months (range, 13–53 months).
Written informed consent was obtained from all patients. The study was approved by the institutional ethics committee.
Setup, Recording, Preprocessing, and Data-Analysis Procedures
Setup, recording, preprocessing, and data analysis of the EEG and fMRI data were performed as described in Jann et al.6 The IC factor is isolated on the EEG dataset that represents the interictal epileptic activity and is convolved with a standard double-γ hemodynamic response function (γ1/max[γ1] − dip × γ2/max[γ2]) scaled so that its total integral is zero (positive peak/FWHM, 5.4/5.2 seconds; negative peak/FWHM, 10.8/7.35 seconds; coefficient of the negative dip, 0.35). The representative IC factor was used as the event-related predictor for the fMRI BOLD signal in the correlation estimation (see On-line Appendix for a detailed description of the methods).
Correlation Estimation
Voxelwise correlations between the BOLD signal and the IC-based predictor were computed by using a general linear model. Volumes with artifacts in the corresponding EEG epoch (eg, motion and so forth) were excluded.
Peak Activation
The cluster with the maximum correlation to the IEDs was determined. Concordance of the SOZ with the identified BOLD signal correlate was defined as presence of the PA cluster within the area of resection in surgical patients with good clinical outcomes (Engel class I/II, 10 patients) and, in all patients, within the SOZ as defined by electroclinical data.
Family-Wise Error
Correlation maps were thresholded at P < .05 corrected for multiple comparisons (FWE). Consistent with previous studies, BOLD signal correlates with t < |3.1| and a minimum cluster size of 40 mm3 were considered significant.20,21 Concordance of the SOZ with BOLD signal correlates was defined as the presence of an activated cluster within the resected area and/or SOZ. For patients with MTLE, the analysis was determined to be equivocal if BOLD signal correlates in the mesiotemporal lobe were found bilaterally.
Fixed Numbers of Activated Voxels
The analysis was performed at an individual statistical threshold (P values), resulting in a total volume of activated BOLD clusters of 4000 ± 200 mm3 within the brain tissue. Correction for multiple comparisons and false-positives was done by estimating the minimal cluster sizes for a given threshold.32,33 Concordance was defined as the presence of an activated cluster within the SOZ as defined above. For patients with MTLE, the analysis was rated equivocal if BOLD signal correlates in the mesiotemporal lobe were bilateral.
Results
Two patients with MTLE (patients 5 and 8) lacked IEDs during EEG/fMRI recordings. In 14 patients, an IC-factor coding for the IEDs was identified on the basis of temporal dynamics and spatial distribution. Patients 1 and 2 were included in a previous methodologic study of IC-based EEG/fMRI.6
BOLD Correlates in MTLE
Results are summarized in the Table. Figure 1 summarizes findings in patient 6.
Concordance of electroclinical data and the EEG/fMRI analysis in MTLE
| No. | MTLE | OP/Engel Class | EEG/fMRI: | PA | FWE | FAV |
|---|---|---|---|---|---|---|
| 1 | R | Yes/Ia | + | + | + | |
| 2 | R | Yes/Ia | + | − (bilat) | + | |
| 3 | R | Yes/Ia | − (PrG L) | − (no) | + | |
| 4 | R | No | − (ACgG L) | + | + | |
| 5 | R | Yes/Ia | No IEDs | |||
| 6 | L | No | + | + | + | |
| 7 | R | Yes/II | + | + | + | |
| 8 | R | Yes/IV | No IEDs | |||
| 9 | R | Yes/Ia | − (PCgG R) | + | + | |
| 10 | R | Yes/Ia | + | + | + |
Note:—R indicates right; L, left; Op, operation; bilat, bilateral; + indicates unilateral BOLD signal cluster in the epileptogenic hippocampal formation; −, no or bilateral BOLD cluster in the hippocampal formation; PCgG, posterior cingulate gyrus; PrG, precentral gyrus; ACgC, anterior cingulate gyrus. For PA in brackets the localization of the PA cluster.
Fig 1.

Left MTLE (patient 6). A, Scalp EEG (average reference montage) and IC-factor coding for the interictal spike with left temporal maximum. B, PA BOLD signal cluster in the left hippocampus head. C, If one applies the FAV criterion, BOLD signal correlates encompass the left hippocampal formation (diagnostic cluster) and parts of the epileptic network in MTLE, including the ipsilateral insula, frontal operculum, and fronto-orbital and temporo-occipital brain areas. D, The FWE approach discloses additional bilateral BOLD signal clusters not identified in B and C.
Peak Activation
The PA was detected within the resected tissue in 3 of the 6 patients with good postoperative outcomes. When the electroclinical definition of the SOZ was used, the PA matched the SOZ in 5 of 10 patients (Fig 1). In 3 patients, the PA was detected outside the mesiotemporal lobe (contralateral precentral gyrus, patient 3; contralateral anterior cingulate gyrus, patient 4; and posterior cingulate gyrus, patient 9).
Family-Wise Error
The FWE criterion resulted in a variable number of activated clusters (mean, 46; range, 0–106), covering an average brain volume of 109 cm3. BOLD signal correlates in the mesiotemporal lobe restricted to the side of seizure onset were present in 3 of 6 patients with good postoperative outcomes and in 6 of 10 patients in which the electroclinical definition was used. Bilateral mesiotemporal lobe activations were detected in patient 2; in patient 3, no voxels exceeded the threshold. The average volume of the BOLD signal cluster within the SOZ was 1.3 cm3, comprising 1.2% (range, 0%–17.6%) of the volume of the total activated voxels.
Fixed Numbers of Activated Voxels
The FAV threshold criterion resulted in BOLD signal correlates within the resected tissue in 5 of 6 patients with good clinical outcomes. In 8 of 10 patients in whom the electroclinical definition was used, a BOLD response was present within the SOZ (Fig 1). On average, the cluster within the SOZ contained 0.4 cm3 of the total of 4 cm3 of activated brain parenchyma, comprising 9.8% (range, 3.6%–14.6%) of the activated volume. Clusters outside the mesiotemporal lobe (mean, 15) were mainly distributed among brain areas with known ictal functional connectivity to the mesiotemporal lobe in MTLE.34,35 In patients 4 and 7, BOLD responses within the SOZ were negative. Negative BOLD signal correlates within the presumed SOZ have been reported in interictal as well as ictal EEG/fMRI recordings in approximately 30% of cases.10,25
BOLD Correlates in Neocortical Epilepsies
Peak Activation
The PA was found inside the resected tissue in 2 of 4 surgical patients and in the SOZ (defined electroclinically) in 4 of 6 patients. In patient 12 (Fig 2), the PA lay in the right inferior parietal lobule, distant from the resected dysplastic cortex as indicated by postoperative outcome (Engel class Ia). In patient 16, the PA was found in the contralateral occipital lobe, as part of widespread bi-hemispheric negative BOLD signal correlates. In a patient with dual pathology in the temporal lobe (patient 15), PA and FAV pointed to focal cortical dysplasia and not to the mesiotemporal lobe.
Fig 2.
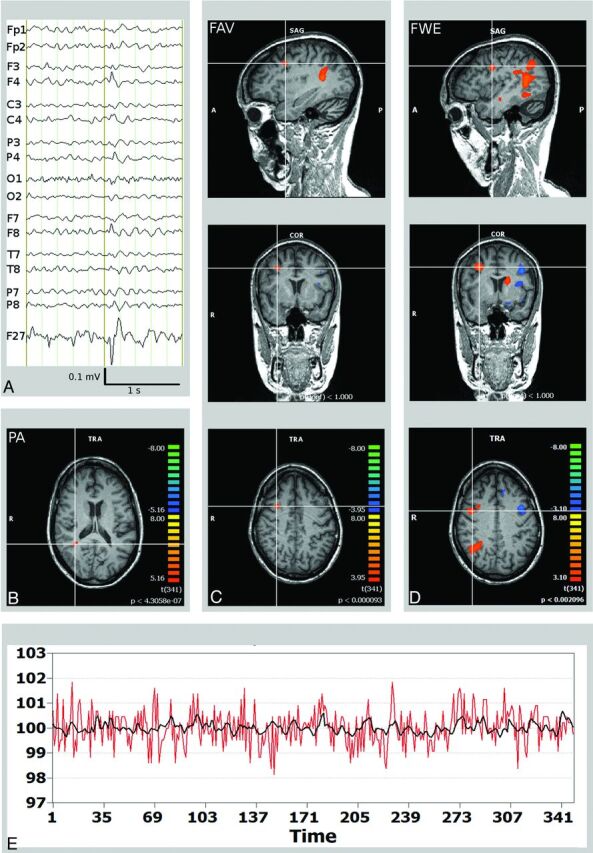
Right frontal lobe epilepsy and frontal focal cortical dysplasia (patient 12). A, Scalp EEG (average reference montage) and IC-factor coding for the interictal spike with right frontal maximum. B, Misleading localization of the PA in the right inferior parietal lobule (crosshair). C, FAV delineates a BOLD signal cluster matching the right frontal focal cortical dysplasia/SOZ (crosshair). D, The widespread BOLD signal correlates obtained by the FWE were not of use in planning of invasive EEG recordings. E, BOLD time course of the right frontal SOZ (red, in a percentage of signal change). Time course of the independent component factor derived from the EEG data after convolution with the hemodynamic response function representing the epileptic activity (black).
Family-Wise Error
The FWE criterion resulted in extensive and multifocal clusters (mean, 111 cm3; range, 9–198 cm3; mean number of clusters, 37; range, 6–50). BOLD signal correlates were present in the resected area in 3 of 4 patients and in the SOZ (defined electroclinically) in 4 of 6 patients. On average, the cluster within the SOZ covered 5.6 cm3, corresponding to 5.0% (range, 0%–23%) of the activated voxels.
Fixed Numbers of Activated Voxels
BOLD signal correlates were present in the resected area in 3 of 4 patients and in the SOZ (defined electroclinically) in 5 of 6 patients. The portion of activated voxels located within the SOZ was 20.7% (range, 0%–45%), and the average number of distant clusters was 13 (range, 6–21). Notably, in 2 patients without lesions detectable on structural MR imaging (patients 11 and 14), the results of EEG/fMRI recording facilitated the placement of the invasive EEG electrodes.
Discussion
Simultaneous EEG/fMRI is an effective noninvasive tool for identifying and localizing the SOZ in patients with focal epilepsy. In this study, we evaluated different thresholding strategies in EEG/fMRI for the assessment of hemodynamic responses to IEDs in the SOZ of drug-resistant epilepsy. The best matches of the BOLD signal correlates and the SOZ (13 of 16 patients) were achieved when applying the FAV criterion based on a predefined number of activated voxels in the brain parenchyma. Thus, FAV has been applied for the first time to EEG/fMRI in a postsurgical outcome study, illustrating 1 way to standardize the analysis, while accounting for inter- and intraindividually varying amounts and character of epileptic activity.
MTLE
Combined EEG/fMRI recordings have not yet been specifically validated in a large cohort of patients with MTLE. The present study evaluated EEG/fMRI recordings in 10 patients with MTLE by using the IC approach on the EEG dataset; this procedure has been reported to improve the characterization of the underlying epileptogenic brain areas in MTLE.6,14 Interictal epileptic activity in MTLE mainly originates from the paleocortex of the mesiotemporal lobe, and most of the interictal paroxysms are not detected by scalp EEG.36,37 These specific properties of MTLE create challenges for EEG/fMRI recordings because IEDs in the surface EEG are usually restricted. Most of the IEDs in the mesiotemporal lobe have no correlate on visual scalp EEG and may thus erroneously be attributed to the baseline signature of the fMRI correlation. Incorporating epileptic activity extracted by an IC may partially overcome this limitation. The IC-factor coding for epileptic activity is selected on the basis of the temporal and spatial distribution of a subset of unequivocal IEDs and represents a statistically independent pattern of time courses fluctuating during the acquisition period. Thus, the identified IC factor represents not only the IEDs fulfilling surface EEG criteria but also temporal fluctuations of epileptic activity, which would otherwise be ignored. In our series, 8 of 10 patients with MTLE showed BOLD signal correlates represented by the IC-factor, facilitating the calculation of hemodynamic responses within the SOZ.
The selection of the strongest cluster (PA) matched the SOZ in a limited number of patients (5 of 10). Three recordings localized the PA outside the SOZ within the cingulate gyrus and ipsilateral precentral gyrus, cortical areas embedded in a distant part of the MTLE network.34,35,38 The cluster with the highest correlation may thus represent the effects of propagation.36 Although the SOZ is usually considered to generate the most intensive increase in blood flow and consequently the most robust BOLD signal change,39–43 the magnitude of the BOLD response in the hippocampal formation is smaller than that in neocortical areas.44 Hence, epileptic activity in the mesiotemporal lobe may result in a less significant correlation with the hemodynamic responses.
The FWE threshold (t > 3.1 and cluster size > 40 mm3) produced a variable spatial extent of the resulting BOLD clusters. In 1 patient, no significant cluster cleared the threshold, and in another patient, bilateral mesiotemporal lobe activation hindered interpretation. Fixed threshold strategies referring to an alternative definition (ie, t > 4.7)24 may result in concordant results in individual patients but may obscure otherwise concordant results in patients with less significant correlation estimations. These findings corroborated results from previous studies applying a fixed statistical threshold20 and motivated the application of an alternative threshold as proposed by earlier presurgical EEG/fMRI studies.26 FAV is based on a predefined volume (4 cm3) of the BOLD signal cluster correlating with the IEDs. The selected volume is based on results of previous work.28 Among the 3 threshold criteria we compared in MTLE, the FAV yielded the best matches of the BOLD signal correlates to the SOZ (8 of 10 patients). The localization of the SOZ was confirmed in 5 patients by surgery and good clinical outcome and in 3 patients by ictal video telemetry. These results are comparable with findings from ictal SPECT and interictal PET studies.45–47
Neocortical Epilepsies
In all patients with focal cortical dysplasia, the invasive EEG recordings confirmed a tight spatial relationship with the corresponding structural epileptogenic lesion. PA matched the SOZ in 4 of 6 patients in our series. In 1 patient (Fig 2), the PA criterion identified a region beyond the dysplastic cortex, indicating the need for caution when relying on a single threshold criterion in EEG/fMRI analysis.
The added value of noninvasive EEG/fMRI in neocortical epilepsies is not to ensure that a structural abnormality detected by high-resolution MR imaging is the cause of the epilepsy but to facilitate the targeting of invasive recordings needed to delineate the SOZ. Numerous distant clusters limited the use of the FWE criterion in the planning of the implantation of grid and strip electrodes. However, similar problems limit the utility of other functional neuroimaging techniques such as PET and ictal SPECT recordings. These methods bring additional costs and limitations, such as the need for ictal injections and radiation exposure, and seizure localization by such techniques is influenced by the duration of seizures, propagation speed of seizures, and pathways of ictal discharge spreading.48 Thus, EEG/fMRI should be strongly considered as an important complement to EEG and clinical semiology.
In the present study, the FAV strategy provided the best localization value, accurately detecting the SOZ in 5 of 6 patients with neocortical epilepsies. An inherent limitation of FWE and FAV thresholding strategies is the fact that the presence of multifocal hemodynamic responses requires a pre-existing clinical hypothesis for the interpretation. Given a proper hypothesis, EEG/fMRI offers better spatial resolution and spatial specificity than scalp EEG and is comparable with PET and ictal SPECT.49 The use of functional imaging in the localization of the SOZ has been shown to benefit from the synthesis of multiple imaging modalities47,48; these include EEG/fMRI incorporating standardized approaches of interpretation, as proposed in this study.
Conclusions
We have demonstrated that simultaneous EEG/fMRI by using IC-based extraction of epileptic activity is a valuable tool for delineating hemodynamic responses related to IEDs in the presurgical work-up of patients with epilepsy. The procedure can be performed during seizure-free periods, and its effectiveness in delineating the SOZ may be further improved by the additional use of alternative standardized analysis such as FAV.
Supplementary Material
ABBREVIATIONS:
- BOLD
blood oxygen level–dependent
- EEG
electroencephalography
- FAV
fixed numbers of activated voxels
- FWE
family-wise error
- FWHM
full width at half maximum
- IC
independent component
- IED
interictal epileptic discharge
- LTLE
lateral temporal lobe epilepsy
- MTLE
mesial temporal lobe epilepsy
- PA
peak activation
- SOZ
seizure-onset zone
Footnotes
This project was funded by the Swiss National Science Foundation grant (320000-108321/1) and (33CM30-124089).
References
- 1. Rosenow F, Luders H. Presurgical evaluation of epilepsy. Brain 2001; 124 ( pt 9): 1683– 700 [DOI] [PubMed] [Google Scholar]
- 2. Berg AT, Vickrey BG, Langfitt JT, et al. The multicenter study of epilepsy surgery: recruitment and selection for surgery. Epilepsia 2003; 44: 1425– 33 [DOI] [PubMed] [Google Scholar]
- 3. Thornton R, Laufs H, Rodionov R, et al. EEG correlated functional MRI and postoperative outcome in focal epilepsy. J Neurol Neurosurg Psychiatry 2010; 81: 922– 97 [DOI] [PubMed] [Google Scholar]
- 4. Grova C, Daunizeau J, Kobayashi E, et al. Concordance between distributed EEG source localization and simultaneous EEG-fMRI studies of epileptic spikes. Neuroimage 2008; 39: 755– 74 [DOI] [PMC free article] [PubMed] [Google Scholar]
- 5. Vulliemoz S, Thornton R, Rodionov R, et al. The spatio-temporal mapping of epileptic networks: combination of EEG-fMRI and EEG source imaging. Neuroimage 2009; 46: 834– 43 [DOI] [PMC free article] [PubMed] [Google Scholar]
- 6. Jann K, Wiest R, Hauf M, et al. BOLD correlates of continuously fluctuating epileptic activity isolated by independent component analysis. Neuroimage 2008; 42: 635– 48 [DOI] [PubMed] [Google Scholar]
- 7. Grouiller F, Thornton RC, Groening K, et al. With or without spikes: localization of focal epileptic activity by simultaneous electroencephalography and functional magnetic resonance imaging. Brain 2011; 134 ( pt 10): 2867– 86 [DOI] [PMC free article] [PubMed] [Google Scholar]
- 8. Hufnagel A, Dumpelmann M, Zentner J, et al. Clinical relevance of quantified intracranial interictal spike activity in presurgical evaluation of epilepsy. Epilepsia 2000; 41: 467– 78 [DOI] [PubMed] [Google Scholar]
- 9. La Fougière C, Rominger A, Forster S, et al. PET and SPECT in epilepsy: a critical review. Epilepsy Behav 2009; 15: 50– 55 [DOI] [PubMed] [Google Scholar]
- 10. Aghakhani Y, Kobayashi E, Bagshaw AP, et al. Cortical and thalamic fMRI responses in partial epilepsy with focal and bilateral synchronous spikes. Clin Neurophysiol 2006; 117: 177– 91 [DOI] [PubMed] [Google Scholar]
- 11. Kobayashi E, Bagshaw AP, Benar CG, et al. Temporal and extratemporal BOLD responses to temporal lobe interictal spikes. Epilepsia 2006; 47: 343– 54 [DOI] [PubMed] [Google Scholar]
- 12. Caulo M, Esposito R, Mantini D, et al. Comparison of hypothesis- and a novel hybrid data/hypothesis-driven method of functional MR imaging analysis in patients with brain gliomas. AJNR Am J Neuroradiol 2011; 32: 1056– 64 [DOI] [PMC free article] [PubMed] [Google Scholar]
- 13. Rosazza C, Minati L, Ghielmetti F, et al. Functional connectivity during resting-state functional MR imaging: study of the correspondence between independent component analysis and region-of-interest-based methods. AJNR Am J Neuroradiol 2011; 33: 180– 87 [DOI] [PMC free article] [PubMed] [Google Scholar]
- 14. Marques JP, Rebola J, Figueiredo P, et al. ICA decomposition of EEG signal for fMRI processing in epilepsy. Hum Brain Mapp 2009; 30: 2986– 96 [DOI] [PMC free article] [PubMed] [Google Scholar]
- 15. Formaggio E, Storti SF, Bertoldo A, et al. Integrating EEG and fMRI in epilepsy. Neuroimage 2011; 54: 2719– 31 [DOI] [PubMed] [Google Scholar]
- 16. Hesse C, James C. Tracking epileptiform activity in the multichannel ictal EEG using spatially constrained independent component analysis. Conf Proc IEEE Eng Med Biol Soc 2005; 2: 2067– 70 [DOI] [PubMed] [Google Scholar]
- 17. Levan P, Tyvaert L, Gotman J. Modulation by EEG features of BOLD responses to interictal epileptiform discharges. Neuroimage 2010; 50: 15– 26 [DOI] [PMC free article] [PubMed] [Google Scholar]
- 18. Urrestarazu E, Iriarte J, Artieda J, et al. Independent component analysis separates spikes of different origin in the EEG. J Clin Neurophysiol 2006; 23: 72– 78 [DOI] [PubMed] [Google Scholar]
- 19. Liu Y, Yang T, Yang X, et al. EEG-fMRI study of the interictal epileptic activity in patients with partial epilepsy. J Neurol Sci 2008; 268: 117– 23 [DOI] [PubMed] [Google Scholar]
- 20. Kobayashi E, Hawco CS, Grova C, et al. Widespread and intense BOLD changes during brief focal electrographic seizures. Neurology 2006; 66: 1049– 55 [DOI] [PubMed] [Google Scholar]
- 21. Tyvaert L, Hawco C, Kobayashi E, et al. Different structures involved during ictal and interictal epileptic activity in malformations of cortical development: an EEG-fMRI study. Brain 2008; 131 ( pt 8): 2042– 60 [DOI] [PMC free article] [PubMed] [Google Scholar]
- 22. Salek-Haddadi A, Diehl B, Hamandi K, et al. Hemodynamic correlates of epileptiform discharges: an EEG-fMRI study of 63 patients with focal epilepsy. Brain Res 2006; 1088: 148– 66 [DOI] [PubMed] [Google Scholar]
- 23. Lazeyras F, Blanke O, Perrig S, et al. EEG-triggered functional MRI in patients with pharmacoresistant epilepsy. J Magn Reson Imaging 2000; 12: 177– 85 [DOI] [PubMed] [Google Scholar]
- 24. Moeller F, Tyvaert L, Nguyen DK, et al. EEG-fMRI: adding to standard evaluations of patients with nonlesional frontal lobe epilepsy. Neurology 2009; 73: 2023– 30 [DOI] [PMC free article] [PubMed] [Google Scholar]
- 25. Kobayashi E, Bagshaw AP, Grova C, et al. Negative BOLD responses to epileptic spikes. Hum Brain Mapp 2006; 27: 488– 97 [DOI] [PMC free article] [PubMed] [Google Scholar]
- 26. Zijlmans M, Huiskamp G, Hersevoort M, et al. EEG-fMRI in the preoperative work-up for epilepsy surgery. Brain 2007; 130 ( pt 9): 2343– 53 [DOI] [PubMed] [Google Scholar]
- 27. de Munck JC, Ossenblok PP. Towards clinical standards for EEG/fMRI. Clin Neurophysiol 2009; 120: 1617– 18 [DOI] [PubMed] [Google Scholar]
- 28. Knecht S, Jansen A, Frank A, et al. How atypical is atypical language dominance? Neuroimage 2003; 18: 917– 27 [DOI] [PubMed] [Google Scholar]
- 29. Ghougassian DF, d'Souza W, Cook MJ, et al. Evaluating the utility of inpatient video-EEG monitoring. Epilepsia 2004; 45: 928– 32 [DOI] [PubMed] [Google Scholar]
- 30. Wieser HG, Ortega M, Friedman A, et al. Long-term seizure outcomes following amygdalohippocampectomy. J Neurosurg 2003; 98: 751– 63 [DOI] [PubMed] [Google Scholar]
- 31. Spencer DD. Depth electrode implantation at Yale University. In: Engel J, Jr, ed. Surgical Treatment of the Epilepsies. New York: Raven Press; 1987: 603– 08 [Google Scholar]
- 32. Goebel R, Esposito F, Formisano E. Analysis of functional image analysis contest (FIAC) data with BrainVoyager QX: from single-subject to cortically aligned group general linear model analysis and self-organizing group independent component analysis. Hum Brain Mapp 2006; 27: 392– 401 [DOI] [PMC free article] [PubMed] [Google Scholar]
- 33. Forman SD, Cohen JD, Fitzgerald M, et al. Improved assessment of significant activation in functional magnetic resonance imaging (fMRI): use of a cluster-size threshold. Magn Reson Med 1995; 33: 636– 47 [DOI] [PubMed] [Google Scholar]
- 34. Weder BJ, Schindler K, Loher TJ, et al. Brain areas involved in medial temporal lobe seizures: a principal component analysis of ictal SPECT data. Hum Brain Mapp 2006; 27: 520– 34 [DOI] [PMC free article] [PubMed] [Google Scholar]
- 35. Bernhardt BC, Bernasconi N, Concha L, et al. Cortical thickness analysis in temporal lobe epilepsy: reproducibility and relation to outcome. Neurology 2010; 74: 1776– 84 [DOI] [PubMed] [Google Scholar]
- 36. Alarcon G, Guy CN, Binnie CD, et al. Intracerebral propagation of interictal activity in partial epilepsy: implications for source localisation. J Neurol Neurosurg Psychiatry 1994; 57: 435– 49 [DOI] [PMC free article] [PubMed] [Google Scholar]
- 37. Wennberg R, Valiante T, Cheyne D. EEG and MEG in mesial temporal lobe epilepsy: where do the spikes really come from? Clin Neurophysiol 2011; 122: 1295– 313 [DOI] [PubMed] [Google Scholar]
- 38. Mueller SG, Laxer KD, Barakos J, et al. Widespread neocortical abnormalities in temporal lobe epilepsy with and without mesial sclerosis. Neuroimage 2009; 46: 353– 59 [DOI] [PMC free article] [PubMed] [Google Scholar]
- 39. Tyvaert L, Levan P, Dubeau F, et al. Noninvasive dynamic imaging of seizures in epileptic patients. Hum Brain Mapp 2009; 30: 3993– 4011 [DOI] [PMC free article] [PubMed] [Google Scholar]
- 40. Gotman J. Epileptic networks studied with EEG-fMRI. Epilepsia 2008; 49 ( suppl 3): 42– 51 [DOI] [PMC free article] [PubMed] [Google Scholar]
- 41. Bagshaw AP, Aghakhani Y, Benar CG, et al. EEG-fMRI of focal epileptic spikes: analysis with multiple haemodynamic functions and comparison with gadolinium-enhanced MR angiograms. Hum Brain Mapp 2004; 22: 179– 92 [DOI] [PMC free article] [PubMed] [Google Scholar]
- 42. Bagshaw AP, Kobayashi E, Dubeau F, et al. Correspondence between EEG-fMRI and EEG dipole localisation of interictal discharges in focal epilepsy. Neuroimage 2006; 30: 417– 25 [DOI] [PubMed] [Google Scholar]
- 43. Benar CG, Grova C, Kobayashi E, et al. EEG-fMRI of epileptic spikes: concordance with EEG source localization and intracranial EEG. Neuroimage 2006; 30: 1161– 70 [DOI] [PubMed] [Google Scholar]
- 44. Dunn JF, Wadghiri YZ, Meyerand ME. Regional heterogeneity in the brain's response to hypoxia measured using BOLD MR imaging. Magn Reson Med 1999; 41: 850– 54 [DOI] [PubMed] [Google Scholar]
- 45. Knowlton RC. Multimodality imaging in partial epilepsies. Curr Opin Neurol 2004; 17: 165– 72 [DOI] [PubMed] [Google Scholar]
- 46. Lee SK, Lee SY, Kim KK, et al. Surgical outcome and prognostic factors of cryptogenic neocortical epilepsy. Ann Neurol 2005; 58: 525– 32 [DOI] [PubMed] [Google Scholar]
- 47. Kurian M, Spinelli L, Delavelle J, et al. Multimodality imaging for focus localization in pediatric pharmacoresistant epilepsy. Epileptic Disord 2007; 9: 20– 31 [DOI] [PubMed] [Google Scholar]
- 48. Lee SK, Lee SY, Yun CH, et al. Ictal SPECT in neocortical epilepsies: clinical usefulness and factors affecting the pattern of hyperperfusion. Neuroradiology 2006; 48: 678– 84 [DOI] [PubMed] [Google Scholar]
- 49. Willmann O, Wennberg R, May T, et al. The contribution of 18F-FDG PET in preoperative epilepsy surgery evaluation for patients with temporal lobe epilepsy: a meta-analysis. Seizure 2007; 16: 509– 20 [DOI] [PubMed] [Google Scholar]
Associated Data
This section collects any data citations, data availability statements, or supplementary materials included in this article.