

Abstract
BACKGROUND AND PURPOSE:
MSA-P and IPD have similar clinical presentations that may complicate accurate clinical diagnosis. Different iron-deposition patterns of those 2 diseases have been demonstrated in histopathology. The aim was to demonstrate the different iron-deposition patterns of MSA-P and IPD by using SWI phase images.
MATERIALS AND METHODS:
Sixteen patients with IPD, 8 with MSA-P, and 44 age-matched healthy controls underwent SWI of brain. The different phase shifts as well as the high iron percentage of the area in several gray nuclei were statistically evaluated. The putamen was divided into 4 subregions for further analysis.
RESULTS:
Patients with MSA-P had significantly higher iron deposition in the putamen and PT compared with those with IPD (P < .05). Moreover, ROC curves indicated slightly more sensitivity in differentiating MSA-P from IPD, by means of the high-iron-deposition-percentage area than the average phase shift (putamen: AUC = 0.88 versus 0.78; PT: AUC = 0.79 versus 0.62). Moreover, the lower inner region of the putamen was the most valuable subregion in differentiating MSA-P from IPD among the 4 subregions (AUC = 0.92 and 0.91 for high-iron-percentage area and average phase shift, respectively).
CONCLUSIONS:
Higher iron deposition in the putamen and PT may differentiate MSA-P from IPD, but the lower inner region of the putamen may be better compared with the PT and other subregions of the putamen. Moreover, the high iron percentage makes it possible to detect smaller increases in iron content more confidently in comparison with average phase shift.
Iron plays an important role in brain function1; however, brain iron deposition has been proposed to play an important role in the pathophysiology of neurodegenerative disease. It has been demonstrated that abnormal iron accumulation occurs in the brains of patients with various neurodegenerative diseases such as IPD, multiple system atrophy, Alzheimer disease, and MS.2–5
Parkinsonism is a clinical syndrome characterized by tremors, muscle rigidity, and bradykinesia. While the most prevalent form of parkinsonism remains IPD, other secondary causes exist, such as some metabolic diseases and side effects of several medications and toxins. IPD is a chronic progressive degenerative brain disorder for which no particular cause can be determined. Patients with IPD and MSA-P may show similar symptoms.6–9 Accurate diagnosis among the clinically similar parkinsonian syndromes remains one of the most challenging situations in neurology. Therefore, early diagnosis and discrimination of these diseases have important implications with respect to management and prognosis.
MR imaging has been demonstrated to be an important tool to quantify iron content in vivo. Many methods have been used to detect iron accumulation in neurodegenerative diseases.10–21 However, these methods may be insufficient for detecting subtle changes in iron components associated with disease progression and may not be sensitive enough to detect and discriminate IPD from MSA-P.22,23 SWI is a new technique that exploits the magnetic properties of iron content of tissues by using magnitude and phase images with a 3D fully velocity-compensated gradient-echo sequence. Compared with a standard T2* sequence, thin sections with 3D SWI are used to avoid background field T2* signal intensity loss and magnetic field variations. Moreover, phase images can enhance contrast to local changes in magnetic susceptibility, therefore, yielding increased sensitivity in detecting local changes in iron content.24–26 Nonheme iron, usually in the form of ferritin, is a highly paramagnetic molecule, which causes a phase shift in the local field correlated with the amount of iron deposition.25,27
We believe that SWI would be a very sensitive imaging sequence, better elaborating putative iron distribution or extent in the deep gray nuclei of patients with MSA-P and IPD. In this study, we aimed to demonstrate the different iron-deposition patterns of MSA-P and IPD by using SWI phase images.
Materials and Methods
Subjects
This was a prospective study approved by the ethics committee of Tongji Medical College of Huazhong University of Science and Technology. Written informed consent was obtained from all the participants. Fifty-four age-matched healthy volunteers ranging from 45 to 80 years of age were recruited from the local community and hospital staff. Twenty-one patients with IPD and 10 patients with MSA-P were recruited from the Department of Neurology, Wuhan Union Hospital. The diagnosis was made by neurologists who were experienced in movement disorders. IPD was diagnosed according to the UK Parkinson's Disease Society Brain Bank diagnostic criteria,28 and multiple system atrophy according to the consensus statement on the diagnosis of multiple system atrophy.29 Four healthy volunteers, 3 patients with IPD, and 2 patients with MSA-P were excluded because of motor artifacts; 6 healthy volunteers and 2 patients with IPD were excluded because of physiologic calcification in the GP. Finally, the study group consisted of 44 age-matched healthy volunteers, 16 patients with IPD and 8 patients with MSA-P.
MR Imaging Protocol
A set of images by using fully flow-compensated 3D high-resolution gradient-echo SWI sequences on a 1.5T MR imaging scanner (Avanto; Siemens, Erlangen, Germany) equipped with standard 8-channel head coil was obtained. The head was immobilized in the head coil with foam padding, avoiding any left-right tilt of the head. Sagittal T1-weighted images were first acquired to locate the precise positions of the anterior/posterior commissure. The SWIs were obtained parallel to the anterior/posterior commissure line with the following parameters; TR = 57 ms, TE = 40 ms, flip angle = 15°, section thickness = 2 mm, FOV = 256 mm, matrix size (Nx × Ny) = 512 × 256. Both phase and magnitude images were acquired, but only phase data were used for further analysis in this study.
Image Processing
Phase images were high-pass-filtered with a 64 × 64 low-spatial-frequency central kernel by using SPIN (MRI Institute for Biomedical Research, Detroit, Michigan) software to create high-pass-filtered phase images, removing varying phase shifts, which arise predominantly from background field inhomogeneities and air-tissue interfaces. The 64 × 64 filter was used with minimal effect on the contrast of small structures.30
The bilateral SN, RN, putamen, GP, CN, TH, and PT were identified and hand drawn according to the anatomic structures by an experienced neuroradiologist on the filtered phase images, and the bilateral values were averaged. The structures were zoomed-in by a factor of 4 to make the boundaries easier to determine. We analyzed only 1 section for each region that showed the largest area, demonstrated the most well-defined border, and represented the expected area for iron content deposition for each region (Fig 1).31 The iron deposition across the entire putamen is inhomogeneous. Therefore, the putamen was divided into 4 subregions30 to describe the iron distribution pattern more conveniently and accurately (Fig 2D). The iron deposition for both the entire putamen and its 4 subregions was quantitatively analyzed. All the regions of interest were remeasured 2 weeks later, on the same images, by the same neuroradiologist. For the second measurement, the image-presentation order was randomized, and the neuroradiologist was blinded to the order. The final values were the means of the 2 measurements.
Fig 1.
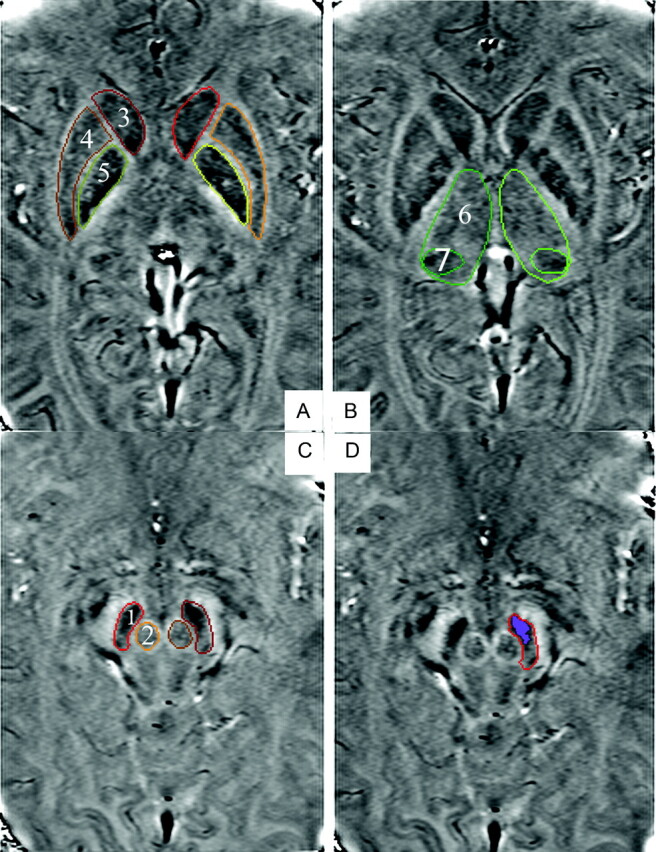
A−C, SWI high-passed filtered-phase images show regions of interest: 1 = SN, 2 = RN, 3 = CN, 4 = putamen, 5 = GP, 6 = TH, 7 = PT. D, Highlighted region indicates the high-iron-deposition area in the SN.
Fig 2.
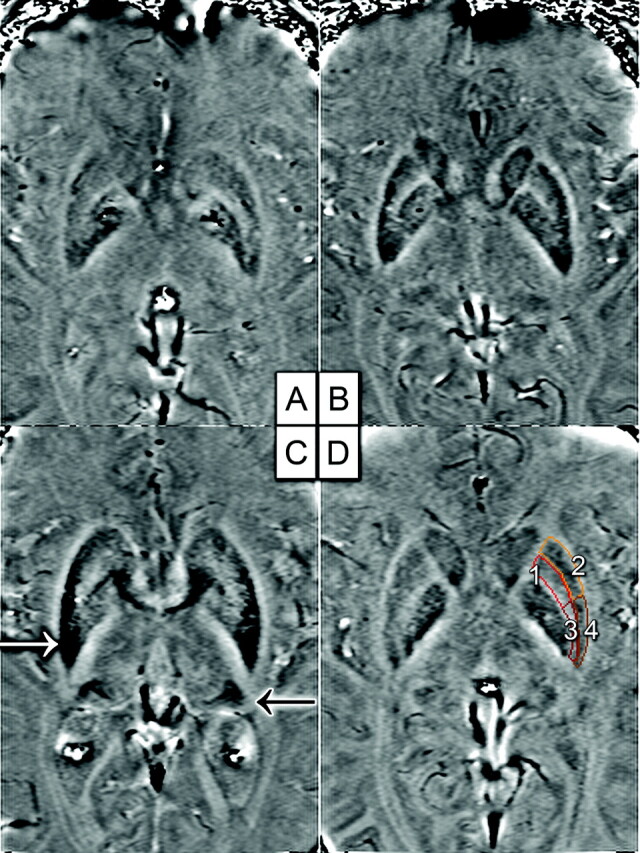
A−C, The patient with MSA-P (C) has higher iron deposition in the putamen (white arrow) and PT (black arrow) rather than the control (A) and the patient with IPD (B). D, Four subregions of the putamen: 1 = upper inner region, 2 = upper outer region, 3 = lower inner region, 4 = lower outer region.
A recently published study30 established a baseline of phase values in a number of brain regions for healthy people. It was found that each region showed specific phase values, and the 95% confidence interval of iron deposition, the phase values with a Gaussian-like distribution, was from a mean −1.96 SD to a mean +1.96 SD for healthy people. The value of mean −2 SD approximate to mean −1.96 SD was used as the threshold to separate high- from low-iron deposition in a previous study.31 In this study, we also chose mean −2 SD derived from 44 healthy volunteers in our study as the threshold or confidence level in the statistics to separate high- from low-iron deposition. More accurate differentiation of iron depositions between the neurodegenerative and healthy brains could be achieved by removing the partial overlap of the iron depositions between them, and more accurate comparisons between IPD and MSA-P with the high- and low-iron regions of analysis could also be made.
SPIN software was used to draw the regions of interest, and the total pixel number (N) and the average phase value (phase shift) within the region of interest could be calculated. Using the 2-region-of-interest analysis function in SPIN, the pixels in the high-iron-content region of each region of interest were highlighted and the pixel number (N1) could be calculated. Then, high-iron-deposition percentages (N1 / N) × 100% of each region of interest were measured.
Statistics
Age-matched comparisons were made among the patients with IPD and MSA-P and healthy volunteers. Continuous variables were expressed as the mean ± SD. The group comparisons among the control, IPD, and MSA-P groups were performed with the Kruskal-Wallis test, followed by the Student-Newman-Keuls test (as an analysis of variance), when a significant difference was found. A P value < .05 indicated a significant difference. Furthermore, ROC curves were plotted to assess the value of high iron percentage and average iron deposition in differentiating IPD from MSA-P. To verify the reproducibility of the findings, we calculated intraobserver variability by using intraclass correlation coefficients. The Statistical Package for the Social Sciences, Version 12.0 (SPSS, Chicago, Illinois) was used for statistical analysis.
Results
Subject Characteristics
Demographic and clinical characters of the subject groups are shown in Table 1.
Table 1:
Demographic and clinical characteristics of the subject groups
| Healthy | MSA-P | IPD | |
|---|---|---|---|
| Total No. | 44 | 8 | 16 |
| Age range (yr) | 45–80 | 50–82 | 47–80 |
| Age mean (yr) | 59.4 ± 11.8 | 66.7 ± 8.5 | 63.3 ± 10.6 |
| Sex (male/female) | 21:23 | 4:4 | 9:7 |
| Disease duration (r) | NA | 2.3 ± 1.1 | 2.5 ± 1.7 |
Note:—NA indicates not applicable.
Intraobserver Variability
The intraobserver agreement was good, and the intraclass correlation coefficients were >0.90 for all the regions. Data are listed in Table 2.
Table 2:
ICCs for each region
| SN | RN | GP | Putamen | CN | TH | PT | |
|---|---|---|---|---|---|---|---|
| High iron percentage | 0.95 | 0.91 | 0.94 | 0.98 | 0.95 | 0.93 | 0.96 |
| Average phase shift | 0.95 | 0.90 | 0.96 | 0.97 | 0.93 | 0.92 | 0.97 |
Phase Shifts and High Iron Percentage for Different Groups
The phase thresholds for each region are listed in Table 3. High-iron-content area percentages and average-total-iron-deposition values (phase shift) of both age-matched volunteers and patients for each region of interest are summarized in Fig 3. Significant differences of high iron depositions were observed in the SN, putamen, GP, and PT, whereas, no significant difference was found in the RN, CN, and TH.
Table 3:
Phase thresholds for each region
| SN | RN | GP | Putamen | CN | TH | PT | |
|---|---|---|---|---|---|---|---|
| Radians | 0.293 | 0.168 | 0.135 | 0.133 | 0.180 | 0.038 | 0.126 |
| Phase value | 2239 | 2158 | 2136 | 2134 | 2165 | 2073 | 2130 |
Fig 3.

Plot of high iron percentage and phase shift for each brain region in MSA-P, IPD, and control groups. The asterisk indicates a significant difference between IPD and control groups; the number sign, a significant difference between MSA-P and control groups; the dot, a significant difference between MSA-P and IPD (P < .05, Student-Newman-Keuls test).
Substantia Nigra
For the SN, the pars compacta appeared to be richer in iron content than the pars reticulate with larger highlighted areas. Significant differences were found in the SN (P < .05) when patients with IPD and MSA-P were compared with healthy controls. No statistical difference was found for patients with IPD versus MSA-P (P > .05).
Red Nucleus
For the RN, the vascularized (dark) part was highlighted compared with the nonvascularized (bright) part. The fusion of SN to RN was noticed in a patient with severe IPD due to high iron depositions. The RN did not reveal a statistically significant iron-deposition pattern in any of the comparisons (P > .05).
Caudate Nucleus
For the CN, the high iron deposition was confined to the region around the drainage vein; no particular iron-deposition pattern was observed in the statistics (P > .05).
Globus Pallidus
No distinct iron-deposition pattern was noticed in the GP. The GP had slightly higher percentage values for patients with IPD compared with healthy controls (P < .05). No statistical difference was found for patients with IPD compared with those with MSA-P and for patients with MSA-P versus healthy controls (P > .05).
Putamen
The iron deposition for the putamen was so inhomogeneous that the putamen was divided into 4 subregions. High iron deposition was mostly confined to the lower outer and lower inner regions. For patients with MSA-P, the high iron area extended to the upper outer region of the putamen. Significant differences were found in iron content deposition patterns among the groups; the high iron percentage and average iron deposition of the putamen were even higher in patients with MSA-P compared with those with IPD (P < .05) (Fig 2).
Thalamus
No particular iron-deposition pattern was observed in the TH. However, most interesting, the iron deposition of the PT appeared to be richer compared with the rest of the TH, especially in patients with MSA-P and IPD. Compared with patients with IPD, the high iron percentage and average iron deposition of the PT were even higher in patients with MSA-P (P < .05) (Fig 2).
Comparison of the Phase Shifts and High Iron Percentage
The AUC indicated that the putamen was the most valuable region in differentiating MSA-P from IPD; meanwhile, the high iron percentage for the putamen was superior to the average iron deposition (AUC = 0.88 versus 0.78). The high iron percentage for PT was also reliable in differentiating MSA-P from IPD with an AUC = 0.79, but other regions and the average iron deposition for the PT were less reliable with AUC values < 0.7 (Fig 4).
Fig 4.
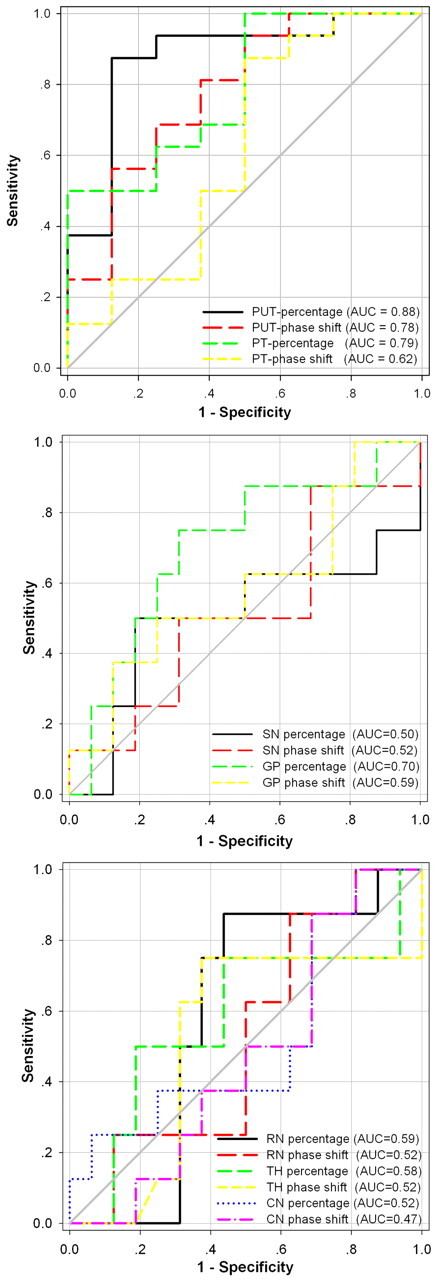
The AUC for iron depositions in 7 deep gray nuclei estimated by 2 methods is intuitively demonstrated in the differentiation of MSA-P from IPD.
Comparison of 4 Subregions of the Putamen
The AUC indicated that the lower inner region of the putamen was the most valuable subregion in differentiating MSA-P from IPD, with an AUC = 0.92 for high iron percentage and an AUC = 0.91 for average phase shift, followed by the upper outer and lower outer regions. The upper inner region was the least reliable in differentiating MSA-P from IPD with AUC values < 0.7 (Fig 5).
Fig 5.
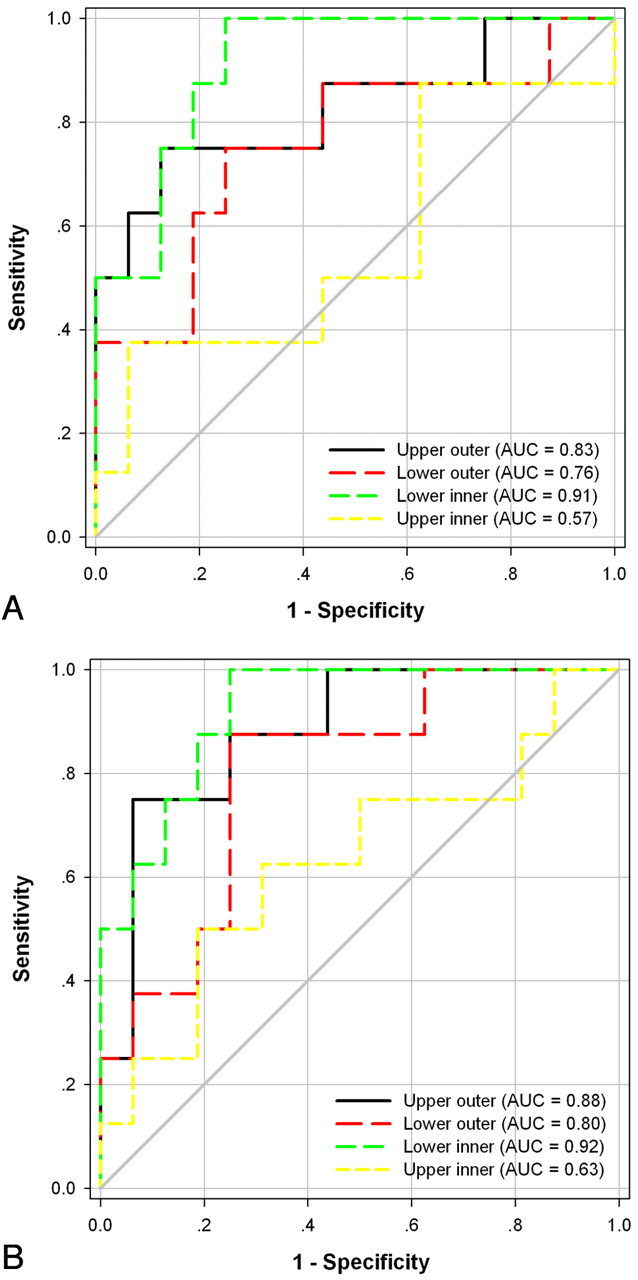
The AUC for iron depositions in 4 subregions of the putamen estimated by 2 methods is intuitively demonstrated in the differentiation of MSA-P from IPD. A, Average phase shift. B, High iron percentage.
Discussion
In this study, the value of SWI to detect iron-deposition patterns to differentiate the hypokinetic syndromes of MSA-P from IPD was investigated. We generated 3 main findings: first, with SWI phase images, both the total average iron content and high iron percentage results had great value in differentiating patients with MSA-P from those with IPD in the putamen and PT, which were better than other regions (eg, SN et al). Second, high iron percentage was superior to average iron deposition; iron deposition in the putamen was superior to that in the PT in differentiating MSA-P from IPD. Third, the lower inner region of the putamen was the most valuable subregion in differentiating MSA-P from IPD among 4 subregions.
Iron levels have been shown to increase with age in healthy individuals in the basal ganglia and white matter in many studies.25,27,31–33 Therefore, we used age-matched controls to eliminate this effect. The age and sex distributions in the MSA-P and IPD groups were similar. The thresholds for the TH, PT, and CN was similar to those reported in the previous study.31 However, the thresholds for SN, RN, putamen, and GP had some differences from those reported in the previous study. This may be due to the threshold being derived from different age groups between our study and the previous study.31
There were various histopathologic studies that showed increased iron concentration in the putamen of patients with multiple system atrophy.34–36 Higher iron concentrations in the putamen for multiple system atrophy were also detected by using MR imaging. Vymazal et al37 demonstrated that T2 was shortened in the putamen of patients with multiple system atrophy, mostly confined to the posterior region. Kraft et al38 reported that hypointense putamen signal-intensity changes were more often observed in multiple system atrophy compared with IPD by using T2*-weighted sequences, but not with T2-weighted sequences. Von Lewinski et al39 reported a signal-intensity loss of the dorsolateral putamen in T2*-weighted sequences of MSA with a high specificity (>0.91). They discriminated MSA from IPD by using a quantitative evaluation of putaminal signal intensities with a diagnostic accuracy (r) of ≤0.82. These results are in concordance with those in our study demonstrating increased iron deposition in the putamen in patients with MSA-P compared with those with IPD. It is generally accepted that neurodegeneration does not occur in the striatal and pallidal neurons in IPD, whereas MSA-P does involve those areas.36,40 The reason may be that imaging is only sensitive enough to demonstrate iron deposition in the putamen, where neurodegeneration occurs most.
Most of the prior studies focused on the signal-intensity changes of the putamen only to differentiate IPD from multiple system atrophy and did not investigate other deep gray nuclei.38,39,41 In the present study, there was no significant difference of iron-deposition patterns in the whole thalamus; however, significantly higher iron deposition in the PT in patients with MSA-P was observed, which corresponded partially to findings in the previous study using T1 and T2 values.37 To our knowledge, this relationship has not been described before with SWI. In another study, iron increased significantly in patients with MS in the PT,4 which indicated that iron deposition in the PT might be one of the underlying pathophysiologic mechanisms of some degenerative diseases.
Although iron deposition was noted to be higher in the SN and GP of patients with IPD, revealing a significant difference compared with controls, no significant difference between patients with MSA-P and IPD was observed. Our results are in concordance with several previous studies reporting increased iron depositions in the SN of patients with multiple system atrophy and IPD.15,42–47
A few studies48–50 used SWI images to detect putative iron content in the brain as a tool to differentiate MSA-P from IPD. Gupta et al49 investigated SWI for patterns of mineralization to differentiate progressive supranuclear palsy, IPD, and multiple system atrophy; minimum-intensity-projection images of SWI were used to obtain signal intensities of each nucleus, which did not demonstrate a significant difference between IPD and multiple system atrophy, though higher putaminal hypointensity scores were found in patients with multiple system atrophy compared with those with IPD. The discordant results of this study may be due to different methods used to calculate iron content. Feng et al48 reported that phase shift values at the bilateral putamen of the multiple system atrophy group were significantly lower than those of the IPD and the control groups, which are in concordance with our study. However, they did not take the PT and some other structures into account in their study, and they did not consider breaking the structure into high and low iron content regions. Moreover, the putamen was not divided into 4 subregions for further analysis in their study.
In this study, a new method for iron detection was used. With phase data, high-iron-deposition percentages within a region of interest were calculated. A new concept of a 2-region-of-interest analysis to study an area of high iron content in a given structure by breaking up iron deposition into low and high iron content regions was proposed recently, and it was proved to be a more sensitive method for calculating iron deposition as opposed to average total iron content calculations.30,31 In a recent study,30 and our study, the thresholds for each region were different; iron concentrations considered to be low in one region might be high in others. This is probably related to the fact that each deep gray matter structure needs different iron concentrations for its physiologic and metabolic processes and may have different tolerances for the iron-induced oxidative stress. In this study, it was demonstrated that high-iron-content region analyses could reveal more information that could not be revealed by the total average iron calculations. We believe that iron depositions in the deep gray matter could be uneven and focal, therefore decreasing the sensitivity and accuracy of calculations of iron depositions in methods using average iron depositions at specified regions of interest.
ROC curves were used to compare the diagnostic value of high-iron-content percentages with average-iron-content calculations in regions and to assess the diagnostic value of 4 subregions of the putamen. It was found that the AUC of high iron percentages showed a tendency to be larger than that of average total region iron calculations, especially in the putamen and PT. Therefore, it can be concluded that high-iron-percentage calculations may be an alternative and possibly a more sensitive method to evaluate subtle changes in iron content. The putamen was divided into 4 subregions to study the value of each subregion in differentiating MSA-P from IPD, and the lower inner region of the putamen was the most valuable subregion among the 4, followed by the upper outer and lower outer regions. To our knowledge, this comparison has not been described before.
von Lewinski et al39 reported a signal-intensity loss of the dorsolateral putamen in T2*-weighted sequences of multiple system atrophy with a high specificity (>0.91). Their dorsolateral putamen may be the lower outer region of the putamen in our study, maybe including part of lower inner region or lower outer region. Their findings corresponded partially with our study. Haacke et al30 reported that in the case of the putamen, the upper inner region was found to have little-to-no iron. The same result was also found in our study, and the iron deposition in the upper inner region was the least reliable in differentiating MSA-P from IPD. If the data were to be calculated in larger patient populations, it may be possible to obtain cutoff values with relatively high diagnostic accuracy.
There are several limitations to this study. First, the population size of our study was relatively small. Second, we used clinical criteria as an inclusion standard for patients with MSA-P and IPD, without pathologic confirmation. Third, we only analyzed the single and most ideal section for calculations to reduce artifacts, which may lead to miscalculations and may not reflect the actual total iron deposition in each respective nucleus. Fourth, the GP has variable mineralization; it is difficult to differentiate mineralization such as calcification versus iron deposition in SWI. Therefore, some subjects were excluded from this study. Studies with a larger population size and long-term follow-up would be better to demonstrate the relationship between iron deposition and diagnosis and differential diagnosis and progress of neurodegenerative disorders.
Conclusions
SWI is a more sensitive imaging method to detect susceptibility changes related to iron deposition with both total average phase values and a newly described method of high-iron-deposition-area percentage calculations. Our study provided further evidence for SWI in differentiating MSA-P from IPD. Both the entire putamen and PT showed increased iron deposition in patients with MSA-P, which demonstrated a more significant difference from IPD. In addition, our findings suggested that high iron percentage in the entire putamen may be better compared with the PT, and the lower inner region of the putamen was the most valuable subregion among 4 when used in differentiating MSA-P from IPD. Moreover, the high-iron-deposition-area percentage indicates slightly more sensitivity in comparison with average phase shift.
ABBREVIATIONS
- AUC
area under the ROC curve
- CN
caudate nucleus
- GP
globus pallidus
- IPD
idiopathetic Parkinson diseases
- MS
multiple sclerosis
- MSA-P
multiple system atrophy with predominant parkinsonism
- PT
pulvinar thalamus
- ROC
receiver operating characteristic analysis
- SN
substantia nigra
- RN
red nucleus
- TH
thalamus
Footnotes
This work was supported, in part, by the National Nature Science Foundation of China (grant 30770623) and the Nature Science Foundation of Hubei (grant 2009CDB008) as well as National Fundamental Key Projection of Science (grant 2007CB935800).
Disclosures: Mark E. Haacke is the president of MR Innovations, a company that processes MR imaging data (including MS data).
References
- 1. Stankiewicz J, Panter SS, Neema M, et al. Iron in chronic brain disorders: imaging and neurotherapeutic implications. Neurotherapeutics 2007; 4: 371– 86 [DOI] [PMC free article] [PubMed] [Google Scholar]
- 2. Thomas M, Jankovic J. Neurodegenerative disease and iron storage in the brain. Curr Opin Neurol 2004; 17: 437– 42 [DOI] [PubMed] [Google Scholar]
- 3. Zhu WZ, Zhong WD, Wang W, et al. Quantitative MR phase-corrected imaging to investigate increased brain iron deposition of patients with Alzheimer disease. Radiology 2009; 253: 497– 504 [DOI] [PubMed] [Google Scholar]
- 4. Haacke EM, Makki M, Ge Y, et al. Characterizing iron deposition in multiple sclerosis lesions using susceptibility weighted imaging. J Magn Reson Imaging 2009; 29: 537– 44 [DOI] [PMC free article] [PubMed] [Google Scholar]
- 5. Berg D, Hochstrasser H. Iron metabolism in Parkinsonian syndromes. Mov Disord 2006; 21: 1299– 310 [DOI] [PubMed] [Google Scholar]
- 6. van Royen E, Verhoeff NF, Speelman JD, et al. Multiple system atrophy and progressive supranuclear palsy: diminished striatal D2 dopamine receptor activity demonstrated by 123I-IBZM single photon emission computed tomography. Arch Neurol 1993; 50: 513– 16 [DOI] [PubMed] [Google Scholar]
- 7. Schulz JB, Klockgether T, Petersen D, et al. Multiple system atrophy: natural history, MRI morphology, and dopamine receptor imaging with 123IBZM-SPECT. J Neurol Neurosurg Psychiatry 1994; 57: 1047– 56 [DOI] [PMC free article] [PubMed] [Google Scholar]
- 8. Poewe W, Wenning G. The differential diagnosis of Parkinson's disease. Eur J Neurol 2002; 9 (suppl 3): 23– 30 [DOI] [PubMed] [Google Scholar]
- 9. Wenning GK, Colosimo C. Diagnostic criteria for multiple system atrophy and progressive supranuclear palsy. Rev Neurol (Paris) 2010; 166: 829– 33. Epub 2010 Sep 1 [DOI] [PubMed] [Google Scholar]
- 10. Ordidge RJ, Gorell JM, Deniau JC, et al. Assessment of relative brain iron concentrations using T2-weighted and T2*-weighted MRI at 3 Tesla. Magn Reson Med 1994; 32: 335– 41 [DOI] [PubMed] [Google Scholar]
- 11. Gelman N, Gorell JM, Barker PB, et al. MR imaging of human brain at 3.0 T: preliminary report on transverse relaxation rates and relation to estimated iron content. Radiology 1999; 210: 759– 67 [DOI] [PubMed] [Google Scholar]
- 12. Bartzokis G, Tishler TA, Lu PH, et al. Brain ferritin iron may influence age- and gender-related risks of neurodegeneration. Neurobiol Aging 2007; 28: 414– 23 [DOI] [PubMed] [Google Scholar]
- 13. Pfefferbaum A, Adalsteinsson E, Rohlfing T, et al. MRI estimates of brain iron concentration in normal aging: comparison of field-dependent (FDRI) and phase (SWI) methods. Neuroimage 2009; 47: 493– 500 [DOI] [PMC free article] [PubMed] [Google Scholar]
- 14. Jensen JH, Szulc K, Hu C, et al. Magnetic field correlation as a measure of iron-generated magnetic field inhomogeneities in the brain. Magn Reson Med 2009; 61: 481– 85 [DOI] [PMC free article] [PubMed] [Google Scholar]
- 15. Bartzokis G, Cummings JL, Markham CH, et al. MRI evaluation of brain iron in earlier- and later-onset Parkinson's disease and normal subjects. Magn Reson Imaging 1999; 17: 213– 22 [DOI] [PubMed] [Google Scholar]
- 16. Bartzokis G, Cummings J, Perlman S, et al. Increased basal ganglia iron levels in Huntington disease. Arch Neurol 1999; 56: 569– 74 [DOI] [PubMed] [Google Scholar]
- 17. Bartzokis G, Tishler TA. MRI evaluation of basal ganglia ferritin iron and neurotoxicity in Alzheimer's and Huntington's disease. Cell Mol Biol (Noisy-le-grand) 2000; 46: 821– 33 [PubMed] [Google Scholar]
- 18. Bartzokis G, Tishler TA, Shin IS, et al. Brain ferritin iron as a risk factor for age at onset in neurodegenerative diseases. Ann N Y Acad Sci 2004; 1012: 224– 36 [DOI] [PubMed] [Google Scholar]
- 19. Bishop GM, Robinson SR, Liu Q, et al. Iron: a pathological mediator of Alzheimer disease? Dev Neurosci 2002; 24: 184– 87 [DOI] [PubMed] [Google Scholar]
- 20. Martin WR, Roberts TE, Ye FQ, et al. Increased basal ganglia iron in striatonigral degeneration: in vivo estimation with magnetic resonance. Can J Neurol Sci 1998; 25: 44– 47 [DOI] [PubMed] [Google Scholar]
- 21. Sipe JC, Lee P, Beutler E. Brain iron metabolism and neurodegenerative disorders. Dev Neurosci 2002; 24: 188– 96 [DOI] [PubMed] [Google Scholar]
- 22. Schrag A, Good CD, Miszkiel K, et al. Differentiation of atypical parkinsonian syndromes with routine MRI. Neurology 2000; 54: 697– 702 [DOI] [PubMed] [Google Scholar]
- 23. Yekhlef F, Ballan G, Macia F, et al. Routine MRI for the differential diagnosis of Parkinson's disease, MSA, PSP, and CBD. J Neural Transm 2003; 110: 151– 69 [DOI] [PubMed] [Google Scholar]
- 24. Reichenbach JR, Venkatesan R, Yablonskiy DA, et al. Theory and application of static field inhomogeneity effects in gradient-echo imaging. J Magn Reson Imaging 1997; 7: 266– 79 [DOI] [PubMed] [Google Scholar]
- 25. Haacke EM, Cheng NY, House MJ, et al. Imaging iron stores in the brain using magnetic resonance imaging. Magn Reson Imaging 2005; 23: 1– 25 [DOI] [PubMed] [Google Scholar]
- 26. Haacke EM, Xu Y, Cheng YC, et al. Susceptibility weighted imaging (SWI). Magn Reson Med 2004; 52: 612– 18 [DOI] [PubMed] [Google Scholar]
- 27. Ogg RJ, Langston JW, Haacke EM, et al. The correlation between phase shifts in gradient-echo MR images and regional brain iron concentration. Magn Reson Imaging 1999; 17: 1141– 48 [DOI] [PubMed] [Google Scholar]
- 28. Hughes AJ, Daniel SE, Kilford L, et al. Accuracy of clinical diagnosis of idiopathic Parkinson's disease: a clinico-pathological study of 100 cases. J Neurol Neurosurg Psychiatry 1992; 55: 181– 84 [DOI] [PMC free article] [PubMed] [Google Scholar]
- 29. Gilman S, Low PA, Quinn N, et al. Consensus statement on the diagnosis of multiple system atrophy. J Neurol Sci 1999; 163: 94– 98 [DOI] [PubMed] [Google Scholar]
- 30. Haacke EM, Ayaz M, Khan A, et al. Establishing a baseline phase behavior in magnetic resonance imaging to determine normal vs. abnormal iron content in the brain. J Magn Reson Imaging 2007; 26: 256– 64 [DOI] [PubMed] [Google Scholar]
- 31. Haacke EM, Miao Y, Liu M, et al. Correlation of putative iron content as represented by changes in R2* and phase with age in deep gray matter of healthy adults. J Magn Reson Imaging 2010; 32: 561– 76 [DOI] [PMC free article] [PubMed] [Google Scholar]
- 32. Hallgren B, Sourander P. The effect of age on the non-haemin iron in the human brain. J Neurochem 1958; 3: 41– 51 [DOI] [PubMed] [Google Scholar]
- 33. Bartzokis G, Mintz J, Sultzer D, et al. In vivo MR evaluation of age-related increases in brain iron. AJNR Am J Neuroradiol 1994; 15: 1129– 38 [PMC free article] [PubMed] [Google Scholar]
- 34. Kurisaki H, Yomono H, Murayama S, et al. Multiple system atrophy with a-/hypo-ceruloplasminemia: distribution of iron in brains of 2 autopsy cases [in Japanese]. Rinsho Shinkeigaku 2002; 42: 293– 98 [PubMed] [Google Scholar]
- 35. Spokes EG, Bannister R, Oppenheimer DR. Multiple system atrophy with autonomic failure: clinical, histological and neurochemical observations on four cases. J Neurol Sci 1979; 43: 59– 82 [DOI] [PubMed] [Google Scholar]
- 36. Fearnley JM, Lees AJ. Striatonigral degeneration: a clinicopathological study. Brain 1990; 113 (pt 6): 1823– 42 [DOI] [PubMed] [Google Scholar]
- 37. Vymazal J, Righini A, Brooks RA, et al. T1 and T2 in the brain of healthy subjects, patients with Parkinson disease, and patients with multiple system atrophy: relation to iron content. Radiology 1999; 211: 489– 95 [DOI] [PubMed] [Google Scholar]
- 38. Kraft E, Trenkwalder C, Auer DP. T2*-weighted MRI differentiates multiple system atrophy from Parkinson's disease. Neurology 2002; 59: 1265– 67 [DOI] [PubMed] [Google Scholar]
- 39. von Lewinski F, Werner C, Jorn T, et al. T2*-weighted MRI in diagnosis of multiple system atrophy: a practical approach for clinicians. J Neurol 2007; 254: 1184– 88 [DOI] [PubMed] [Google Scholar]
- 40. Lantos PL, Papp MI. Cellular pathology of multiple system atrophy: a review. J Neurol Neurosurg Psychiatry 1994; 57: 129– 33 [DOI] [PMC free article] [PubMed] [Google Scholar]
- 41. Kraft E, Schwarz J, Trenkwalder C, et al. The combination of hypointense and hyperintense signal changes on T2-weighted magnetic resonance imaging sequences: a specific marker of multiple system atrophy? Arch Neurol 1999; 56: 225– 28 [DOI] [PubMed] [Google Scholar]
- 42. Brass SD, Chen NK, Mulkern RV, et al. Magnetic resonance imaging of iron deposition in neurological disorders. Top Magn Reson Imaging 2006; 17: 31– 40 [DOI] [PubMed] [Google Scholar]
- 43. Atasoy HT, Nuyan O, Tunc T, et al. T2-weighted MRI in Parkinson's disease; substantia nigra pars compacta hypointensity correlates with the clinical scores. Neurol India 2004; 52: 332– 37 [PubMed] [Google Scholar]
- 44. Kosta P, Argyropoulou MI, Markoula S, et al. MRI evaluation of the basal ganglia size and iron content in patients with Parkinson's disease. J Neurol 2006; 253: 26– 32 [DOI] [PubMed] [Google Scholar]
- 45. Gorell JM, Ordidge RJ, Brown GG, et al. Increased iron-related MRI contrast in the substantia nigra in Parkinson's disease. Neurology 1995; 45: 1138– 43 [DOI] [PubMed] [Google Scholar]
- 46. Graham JM, Paley MN, Grunewald RA, et al. Brain iron deposition in Parkinson's disease imaged using the PRIME magnetic resonance sequence. Brain 2000; 123 (pt 12): 2423– 31 [DOI] [PubMed] [Google Scholar]
- 47. Michaeli S, Oz G, Sorce DJ, et al. Assessment of brain iron and neuronal integrity in patients with Parkinson's disease using novel MRI contrasts. Mov Disord 2007; 22: 334– 40 [DOI] [PubMed] [Google Scholar]
- 48. Feng F, You H, Wang H, et al. Phase-weighted imaging in differentiating multiple system atrophy from idiopathic Parkinson disease [in Chinese]. Zhongguo Yi Xue Ke Xue Yuan Xue Bao 2009; 31: 129– 33 [PubMed] [Google Scholar]
- 49. Gupta D, Saini J, Kesavadas C, et al. Utility of susceptibility-weighted MRI in differentiating Parkinson's disease and atypical parkinsonism. Neuroradiology 2010; 52: 1087– 94 [DOI] [PubMed] [Google Scholar]
- 50. Wang YH, Dai YM, Xu HB. High iron percentage in human brain-idiopathic Parkinsons, Parkinsonism and healthy cases. 10.1594/ecr2010/C-2511 2010 [DOI]