Abstract
BACKGROUND AND PURPOSE:
Accurate identification of the NP in MR images is crucial to properly and objectively assess the intervertebral disk. Therefore, computerized segmentation of the NP in T2WI is necessary to produce repeatable and accurate results with minimal user input.
MATERIAL AND METHODS:
A semiautomated CS method was developed to identify the NP in T2WI on the basis of intensity differences compared with the AF. The method was validated by segmenting computer-generated images with a known ROI. The method was tested by using 63 MR images of rabbit lumbar disks, which were segmented to detect disk degeneration. An ICC was used to assess the repeatability of this method compared with manual segmentation.
RESULTS:
The error in the detected area of the rabbit NP by using CS was −3.49% ± 4.4% (mean ± SD) compared with 22.36% ± 5.55% by using manual segmentation. Moreover, the method was capable of detecting disk degeneration in a known rabbit puncture model of disk degeneration. Finally, this method had an ICC of 0.97 and 0.99 in regard to segmenting the area and calculating the MR imaging index of the NP, deeming it highly repeatable.
CONCLUSIONS:
The CS method is a semiautomated computer method able to segment the NP of the rabbit disk and detect disk degeneration. In addition, it could assist in clinical detection, assessment, and monitoring of early degeneration in human disks.
The IVD occupies the space between adjacent spinal vertebral bodies and acts as a shock absorber to resist loads placed on the spine. It is an avascular structure composed of 2 parts: an outer fibrotic ring, the AF, surrounding an inner gelatinous nucleus, the NP. The AF is composed of collagen fibers, primarily collagen I, arranged in concentric sheets. The NP contains primarily type II collagen fibrils and proteoglycans, which attract water.1 Therefore, the healthy NP is considered to have higher water content than the AF. This is reflected on T2WI as a difference in image intensities, in which the NP has high signal intensity and appears bright, while the AF has low signal intensity and appears dark.2
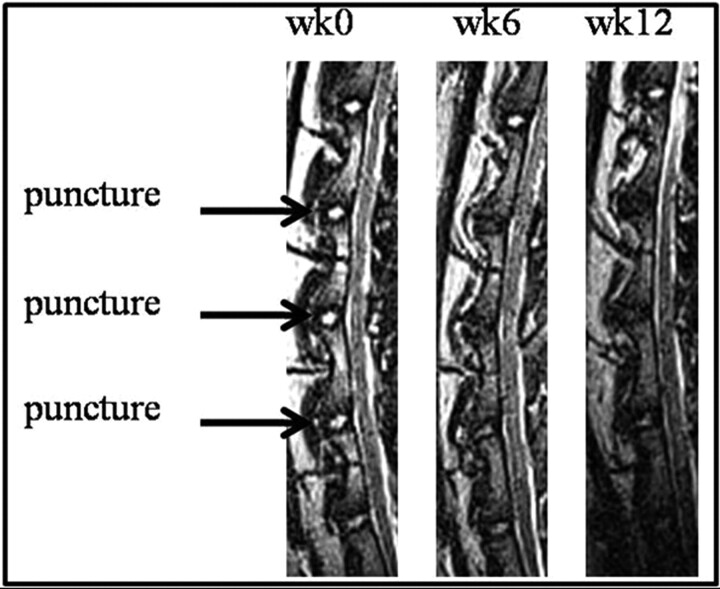
The difference in the image intensity between the 2 structures enables physicians to assess the condition of the IVD, especially in the case of IDD, which is one of the leading causes of low-back pain. Numerous animal models have been developed to study IDD,3,4 one of which is a rabbit puncture model.5,6 T2WI of the punctured rabbit spines (Fig 1) shows degeneration as a loss of signal intensity in the NP throughout time. One method to assess the amount of degeneration is for an observer to grade images of the rabbit NP by using a modified Thompson classification system.7 This grading system is based on changes in the area and signal intensity of the disk. It ranges from grades 1 to 4 with grade 1 being a normal disk with high NP signal intensity and grade 4 being a severely degenerated disk with low NP signal intensity. Also, Sobajima et al6,8 quantified the amount of IDD by manually segmenting the rabbit NP and calculating the MR imaging index, which is the area of the NP multiplied by the average intensity of the NP. Their studies showed a decrease in the MR imaging index for degenerated disks compared with healthy disks.
Fig 1.
Midsagittal T2WI of the rabbit lumbar spine with 3 punctured intervertebral disks between the second and third lumbar vertebrae, the third and fourth lumbar vertebrae, and the fourth and fifth lumbar vertebrae, across 3 time points relative to the date of surgery.
Accurate identification of the NP is crucial to properly and objectively assess the IVD. This approach will assist in the evaluation of therapeutic interventions, robot-guided surgeries, and monitoring the progression of degeneration. Therefore, computerized segmentation of the NP is necessary to produce repeatable and accurate results with minimal user input. This study proposes a CS method to semiautomatically segment the NP on the basis of the difference in intensity between the NP (bright) and AF (dark) structures. By generating an intensity isoline image of the IVD from the T2WI, the user can easily distinguish the 2 structures and select the NP. MR images of the rabbit puncture model were used to develop and test this technique.
Materials and Methods
Validation Dataset
To calculate the amount of segmentation error in the CS method, we generated a validation dataset containing a structure with a known area, and the result of the CS was compared with this area. The validation dataset was a computer-constructed image containing a 2D Gaussian structure with a height intensity equal to 500 and the SD equal to 3 in both directions. This structure was intended to mimic the T2WI of the NP because the signal intensity radially drops off from the center of the NP toward the AF. The base diameter of the Gaussian structure spanned 13 pixels, thus the base area was π × 6.52 = 132.66 pixels2. This area will be referred to as Areatrue. The image size was 49 × 49 pixels with background intensity equal to zero, with the Gaussian structure located in the bottom right corner of the image. The top left corner of the image was used to measure the average intensity of the background to calculate the image SNR as described below.
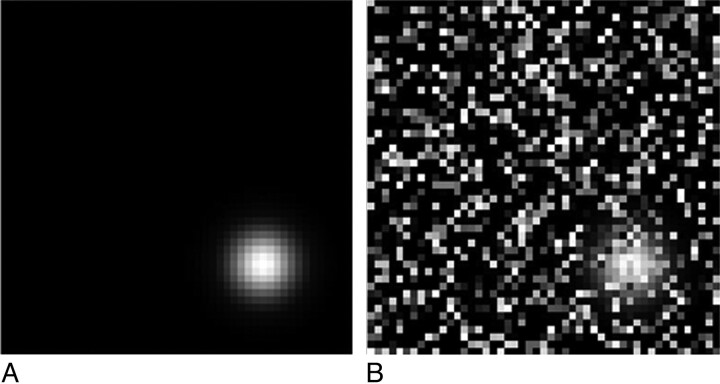
The base image was generated without the introduction of any noise; thus, it had a noise level equal to 0% (Fig 2 A). Other validation images were generated with noise added to a specific number of pixels chosen at random. For example, the intensity of 960 randomly chosen pixels of 2401 total pixels was randomly changed between 0 and 500, resulting in an image with 40% noise level (Fig 2B). The following noise levels were added to the base image: 0%, 5%, 10%, 20%, 30%, 40%, 50%, 60%, 70%, and 80%, and 30 images of each noise level were generated, thus creating a total of 300 validation images. These images were used to assess the sensitivity and accuracy of the CS method.
Fig 2.
An example of the computer-generated validation image with 0% noise (A) and 40% noise (B). The Gaussian structure is located in the bottom right corner of the image.
Rabbit Dataset
This dataset was composed of midsagittal T2WI ROI from a rabbit puncture model study approved by the Institutional Animal Care and Use Committee of the University of Pittsburgh, and all procedures were in compliance with guidelines of the Public Health Service Policy on Humane Care and Use of Laboratory Animals. A 3T magnet (Siemens, Erlangen, Germany) was used, and the parameters of the T2WI were as follows: TR = 3800 ms, TE = 114 ms, FOV = 184 × 232, number of sections = 20, section thickness = 0.6 mm, section gap = 0.66 mm. This study was similar to that reported previously by Sobajima et al.6,8 In brief, 4 skeletally mature New Zealand white rabbits underwent the puncture procedure with a 16-ga needle in 3 lumbar IVDs, L2–3, L3–4, and L4–5, thus initiating a degeneration process. We did not operate on 3 additional rabbits; thus, they were used as nonoperative controls. T2WI was performed in all rabbits before the date of surgery and at 6 and 12 weeks postsurgery. Therefore, the 3 IVDs from 7 rabbits across 3 time points resulted in 63 images of lumbar IVDs. This dataset was used to evaluate the ability of the CS method to detect IDD.
Segmentation
The CS method was written in Matlab, Version 7.5 (MathWorks, Natick, Massachusetts) and was applied to both datasets. For the rabbit dataset, the method was applied to the midsagittal section, which was identified by an orthopedic resident. The user drew a box on the image surrounding each IVD of interest (L2–3, L3–4, and L4–5) and the adjacent vertebrae. The intensity isolines of the chosen section were calculated and displayed as a contour image. The contour lines of the image were separated by contour levels of 50. The user was prompted to identify the NP, our ROI, by selecting the isoline that corresponded to the largest closed area between the 2 adjacent vertebrae. Then as a visual confirmation, the image was displayed with the ROI boundary in red to ensure the proper location of the NP. The segmentation was performed twice with a 1-week gap. The same process was performed on the validation dataset, but the selected region was the Gaussian structure instead of the IVD.
Moreover, the NP of the rabbit MR images was manually segmented using ImageJ software (http://rsb.info.nih.gov/ij/) by 3 observers: 2 orthopedic residents and a student, who were trained to recognize the location and shape of the NP on an MR image. The order of the images was randomized for each observer, and they were also segmented twice, with a 1-week gap between each segmentation session. Additionally, the Gaussian structure of the validation dataset was manually segmented once by the student.
Outcome Measures
The total area of the ROI was calculated for both datasets. Additionally, the SNR of each image was calculated according to the following equation9:
To assess IDD, the MR imaging index previously established by Sobajima et al6,8 was calculated for the rabbit NP:
where I and A are the intensity and area of the jth pixel respectively, and N is the total number of pixels in the ROI. Also, a Student t test was used to statistically evaluate the differences between the control and punctured rabbits disks. Finally, an ICC was calculated to compare the performance of the CS method with the manual segmentation in addition to inter- and intraobserver variability.
As previously indicated the Areatrue of the Gaussian structure in the validation dataset was 132.66 pixels2. The error in the segmented area from the CS and manual method was calculated as the percentage difference between the area of the segmented ROI (AreaROI) and Areatrue as shown in equation 3:
Therefore the area error addresses the size difference between the segmented region of interest and the criterion standard represented here by Areatrue.
Results
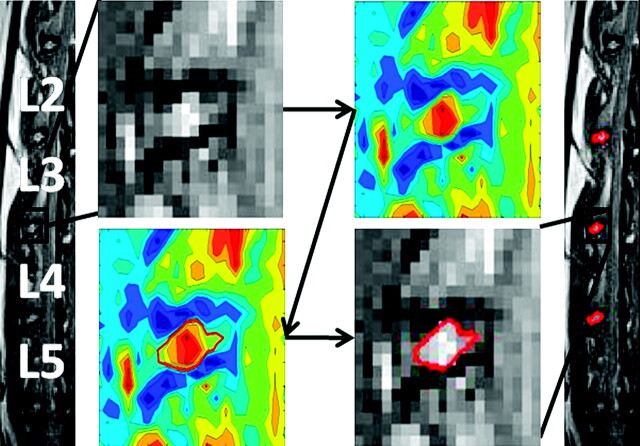
An example of the application of this method on a midsagittal rabbit T2WI is shown in Fig 3. After the user selects the IVD of interest, the contour image of the selection is calculated and presented and the user is prompted to select the largest closed area, which is indicated by the red line within the adjacent vertebrae. This figure displays the simplicity of identifying the NP and the ability of the CS method to select partial pixels.
Fig 3.
An example of applying the CS method on the lumbar disk between the third and fourth lumbar vertebrae of a control rabbit. After the user selects, with a box, the area surrounding the disk, the contour isolines are generated and the user is prompted to select the largest closed area (shown as a red line) within the vertebrae, which is assumed to represent the NP. After the selection is made, the MR image is displayed with the selected region of interest bounded by a red line. Additionally, the NP boundary between the second and third as well as fourth and fifth lumbar vertebrae is displayed in red.
Validation Dataset
The CS method was applied to the validation dataset with various noise levels to segment the Gaussian structure. The method was able to segment all images up to a 70% noise level in which only 20 of 30 images were segmented. Images with 0% noise level had an SNR equal to infinity because the mean background signal intensity was equal to zero. Therefore, 70 images were eliminated from the analysis (30 with 0% noise, 10 with 70% noise, and 30 with an 80% noise level). For direct comparison, the same images were removed from the results of the manual segmentation of this data and only 230 validation images were segmented.
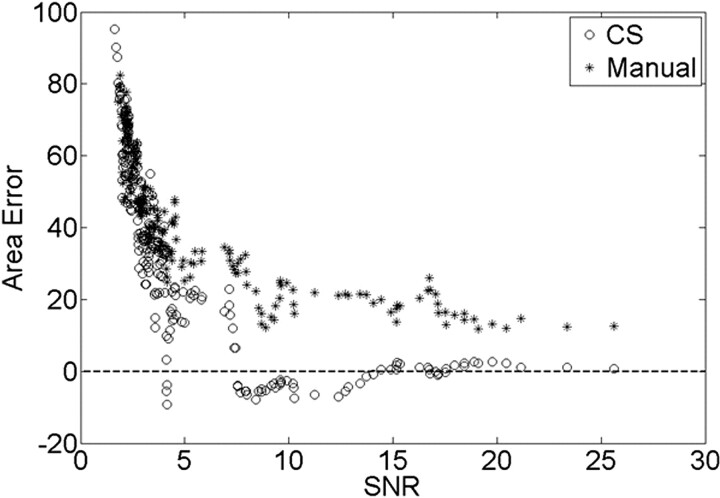
The area error was compared with the noise level of the image, which was determined by the image SNR for both the CS and manual segmentation as shown in Fig 4, where a moving average of area error (bin width = 5) was plotted against the image SNR. As the image SNR increased and the noise level decreased, the area error decreased. While the area error of the manual segmentation decreased and plateaued around 18%, the area error of the CS method converged to zero. Thus for an image noise level of 10%, the SNR was equal to 7.53, resulting in <10% error in the CS segmentation compared with 29% from the manual segmentation.
Fig 4.
The validation dataset SNR of each image is plotted against the area error calculated in equation 3 for both manual and CS of the Gaussian structure. The dotted line is the zero error line, meaning that the segmented area is exactly equal to the area of the structure.
Rabbit Dataset
The amount of error present in segmenting the rabbit NP was extracted from Fig 4. The mean SNR of the rabbit dataset was equal to 10.3, and the SD was equal to 3.09. Thus, from the CS curve in Fig 4, the mean percentage error of the rabbit MR imaging dataset was determined to be −3.49% with an SD equal to 4.40%. Meanwhile, from the manual segmentation curve, the mean percentage error was 22.36% with an SD equal to 5.55%. The 2 means were significantly different by using a t test with a P value < .01.
The ICC was calculated to assess the reliability of the CS method to detect the NP area and the MR imaging index compared with manual segmentation. A high correlation was observed between the interobserver and intraobserver manual segmentation as shown in the Table. This result complemented what has been reported by Sobajima et al.6,8 Moreover, when the CS method was compared with itself, the area and MR imaging index ICC were 0.97 and 0.99, respectively, which were higher than those with manual correlation. Meanwhile, a moderate correlation was found when the CS method was compared with the manual segmentation.
ICCs for manual segmentation and CS
| ICC (area) | ICC (MRI index) | |
|---|---|---|
| MD1 × MD1 | 0.82 | 0.95 |
| MD2 × MD2 | 0.73 | 0.88 |
| S × S | 0.83 | 0.92 |
| CS × CS | 0.97 | 0.99 |
| MD1 × MD2 | 0.85 | 0.89 |
| MD1 × S | 0.87 | 0.96 |
| MD2 × S | 0.83 | 0.86 |
| MD1 × CS | 0.49 | 0.53 |
| MD2 × CS | 0.64 | 0.66 |
| S × CS | 0.49 | 0.56 |
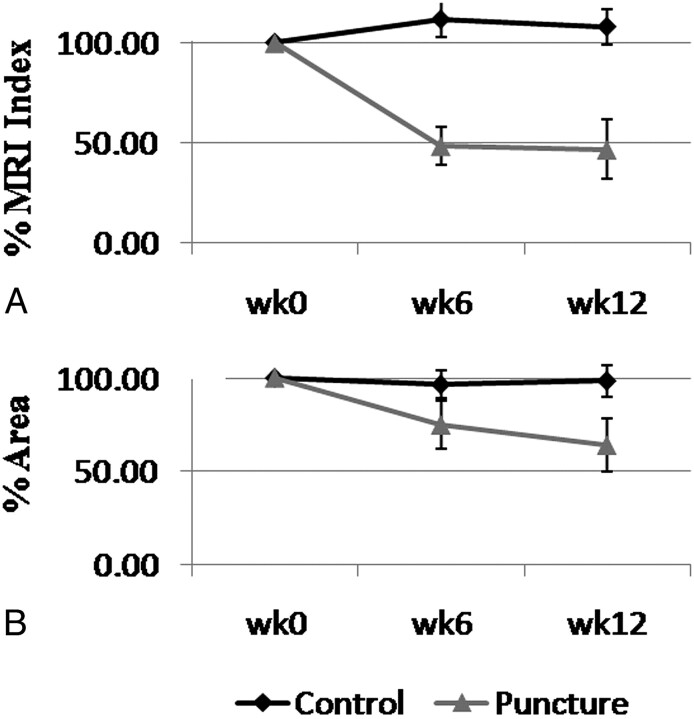
Moreover, the ability of the CS method to detect rabbit IDD was tested. There was a statistically significant difference in the NP area and MR imaging index between the control and punctured rabbit disks. At week 6, the mean MR imaging index was 111.34% and 48.40% that of week zero for control and punctured disks, respectively (P < .01). By week 12, the mean MR imaging index for the punctured rabbits dropped to 46.56% relative to week zero, while the control disks remained at 107.82% relative to week zero (P < .01). This decrease in the MR imaging index for the punctured rabbits as shown in Fig 5 A resembled what has been reported by Sobajima et al6,8 and was an indication of IDD. Similarly, by weeks 6 and 12, the mean area of the lumbar NP of the punctured rabbits decreased to 74.87% and 63.97%, respectively, relative to week zero; meanwhile, the control NP remained at 96.57% and 98.42% relative to week zero (Fig 5B). This difference was statistically significant with P < .01. The decrease in size and MR imaging index of the punctured NP also reflected its degenerated state.
Fig 5.
The time course of the average percentage MR imaging index (A) and average percentage area (B) of the control and punctured rabbit lumbar NPs relative to week 0. Error bars are the standard error at each time point.
Discussion
In this study, a new semiautomated CS method was developed to segment the NP by using rabbit IVDs to assess the status of the disk and the amount of degeneration. The method was based on calculating the intensity isolines of the disk and prompting the user to select the isoline corresponding to the largest closed area between 2 adjacent vertebrae, which was assumed to be the NP. This assumption might have included adjacent tissue in addition to the NP, but it provided a robust guide to eliminate any user bias and uncertainty as to which area to choose. Moreover, it decreased the amount of segmentation error relative to the manual segmentation as shown in Fig 4. Therefore, the CS method provided a more accurate segmentation of the rabbit NP. Additionally, the CS method was highly repeatable, with ICC values of 0.97 and 0.99 for the area and MR imaging index calculation. These correlation coefficients were higher than those with the manual segmentation, thus ensuring a highly repeatable measurement of the NP.
On the other hand, the results of the CS method were moderately correlated with those from the manual segmentation. The manual segmentation by using ImageJ was limited by the pixel boundary, allowing segmentation of only the whole or half of the pixel. The CS method is not restricted by the pixel boundaries but by the intensity isoline, thus enabling the segmentation of partial pixels. Therefore, the shape and total area of the NP would be different for both segmentation methods and would result in a moderate ICC value.
Numerous computerized methods are currently available to segment and localize the human IVD, such as water shedding,10 probabilistic models,11 or generalized Hough transformations and principle component analysis.12 These methods are required to distinguish differences in the AF and surrounding tissues, such as the anterior and posterior longitudinal ligaments, which have image-intensity levels similar to those of the AF. Additionally, they need to address the various states of human IVDs, such as degenerated, thin, bulged, or herniated. The CS method was sufficient to segment the image of the rabbit IVD because it is simpler than the human IVD by being smaller, with fewer intensity variations. Moreover, this method could be applied to a healthy or early degenerated human IVD due to the significant difference in the intensity between the NP and the surrounding tissue, but further development of the method is required to address pathologic IVDs.
Not only could the CS method be applied to T2WI of the rabbit spine, but it has the potential of segmenting the NP in other types of MR images such as multi-spin-echo images used to calculate T2 maps and T1-weighted or sodium images. Moreover, this technique could be applied to fluid-attenuated inversion recovery and short-time inversion recovery images of the lumbar spine to segment the NP.
Conclusions
The CS method provided a new tool to successfully detect differences between a healthy and a degenerated rabbit NP. While it is limited to addressing early human IDD, this tool is essential to further study possible interventional therapies that alter the course of IDD.
Acknowledgments
We wish to thank Nam Vo, MD, PhD, and the MR Research Center at the University of Pittsburgh.
Abbreviations
- AF
annulus fibrosus
- CS
contour segmentation
- ICC
intraclass correlation coefficient
- IDD
IVD degeneration
- IVD
intervertebral disk
- MD1
first resident
- MD2
second resident
- MRI
MR imaging
- NP
nucleus pulposus
- ROI
region of interest
- S
student
- SNR
signal-to-noise ratio
- T2WI
T2-weighted imaging
- wk
week
Footnotes
This work was supported by the Veterans Association Rehabilitation Research and Development grant B4–3894RA, the Albert B Ferguson, Jr., MD, Orthopaedic Fund of the Pittsburgh Foundation, and the Scott F. Nadler Research Grant Award of the Physiatric Association of Spine, Sports and Occupational Rehabilitation.
Paper previously presented at: Institute of Rehabilitation and Research Day, May 28, 2009; Pittsburgh, Pennsylvania; and 56th Annual Meeting of the Orthopeadic Research Society, March 6–9, 2010; New Orleans, Louisiana.
References
- 1. Eyring EJ. The biochemistry and physiology of the intervertebral disk. Clin Orthop Relat Res 1969; 67: 16– 28 [PubMed] [Google Scholar]
- 2. Moon KL, Genant HK, Helms CA, et al. Musculoskeletal applications of nuclear magnetic resonance. Radiology 1983; 147: 161– 71 [DOI] [PubMed] [Google Scholar]
- 3. Krag M. Animal models for human disk degeneration. In: Weinstein JN, Gordon SL, eds. Low Back Pain: A Scientific and Clinical Overview. Rosemont, Illinois: American Academy of Orthopaedic Surgeons; 1996: 479– 92 [Google Scholar]
- 4. Singh K, Masuda K, An HS. Animal models for human disc degeneration. Spine J 2005; 5 ( 6 suppl): 267S– 79S [DOI] [PubMed] [Google Scholar]
- 5. Lipson SJ, Muir H. Proteoglycans in experimental intervertebral disc degeneration. Spine 1981; 6: 194– 210 [DOI] [PubMed] [Google Scholar]
- 6. Sobajima S, Kompel JF, Kim JS, et al. A slowly progressive and reproducible animal model of intervertebral disc degeneration characterized by MRI, x-ray, and histology. Spine 2005; 30: 15– 24 [DOI] [PubMed] [Google Scholar]
- 7. Masuda K, Aota Y, Muehleman C, et al. A novel rabbit model of mild, reproducible disc degeneration by an anulus needle puncture: correlation between the degree of disc injury and radiological and histological appearances of disc degeneration. Spine 2005; 30: 5– 14 [DOI] [PubMed] [Google Scholar]
- 8. Sobajima S, Shimer AL, Chadderdon RC, et al. Quantitative analysis of gene expression in a rabbit model of intervertebral disc degeneration by real-time polymerase chain reaction. Spine J 2005; 5: 14– 23 [DOI] [PubMed] [Google Scholar]
- 9. Olaf D, José GR, Scott BR, et al. Measurement of signal-to-noise ratios in MR images: influence of multichannel coils, parallel imaging, and reconstruction filters. J Magn Reson Imaging 2007; 26: 375– 85 [DOI] [PubMed] [Google Scholar]
- 10. Chevrefils C, Chériet F, Grimard G, et al. Watershed segmentation of intervertebral disk and spinal canal from MRI images. In: Kamel M, ed. Image Analysis and Recognition: Lecture Notes in Computer Science. Berlin, Germany: Springer; 2007: 1017– 27 [Google Scholar]
- 11. Corso JJ, Alomari RS, Chaudhary V. Lumbar disc localization and labeling with a probabilistic model on both pixel and object features. Med Image Comput Comput Assist Interv 2008; 11 ( pt 1): 202– 10 [DOI] [PubMed] [Google Scholar]
- 12. Seifert S, Wachter I, Dillmann R. Segmentation of intervertebral discs, trachea and spinal cord from MRI images. In: Proceedings of the Third Annual Meeting of Computer Assisted Radiology and Surgery, Osaka, Japan. July 5–8, 2006 [Google Scholar]


