

SUMMARY:
There is increasing use of neuroimaging modalities, including PET, for diagnosing dementia. For example, FDG-PET demonstrates hypometabolic regions in the posterior cingulate gyri, precuneus, and parietotemporal association cortices, while amyloid PET indicates amyloid deposition in Alzheimer disease and mild cognitive impairment due to Alzheimer disease. Furthermore, the use of combination PET with structural MR imaging can improve the diagnostic accuracy of dementia. In other neurodegenerative dementias, each disease exhibits a specific metabolic reduction pattern. In dementia with Lewy bodies, occipital glucose metabolism is decreased, while in frontotemporal dementia, frontal and anterior temporal metabolism is predominantly decreased. These FDG-PET findings and positive or negative amyloid deposits are important biomarkers for various neurodegenerative dementias.
The number of patients with dementia is progressively increasing worldwide. Dementia is a clinical diagnosis based on significant and persisting deficits of intellectual function, usually memory. Diagnostic imaging techniques for morphologic examinations (eg, CT and MR imaging) and for functional examinations (eg, SPECT and PET) are now used widely for supporting the diagnosis of dementia. Such imaging techniques can indicate the likely underlying pathology in a patient who meets the clinical criteria for dementia. In particular, amyloid imaging PET has been reported to show the pathophysiologic states of dementia. The PET radiopharmaceutical [18F]fluorodeoxyglucose can detect regional glucose metabolism in patients with dementia and is the most widely available and useful biomarker for dementia diagnosis. However, to exclude several pathologies such as subdural hematoma, vascular dementia, normal pressure hydrocephalus, and brain tumors, clinical examination is first performed by using MR imaging because FDG-PET alone cannot detect these diseases. After this process, FDG-PET is then performed to detect early neurodegenerative dementia, differentiate neurodegenerative dementias,1 or suggest comorbidity of other neurodegenerative diseases. Herein, I review the various imaging approaches for dementia, with a particular focus on PET and new techniques or tracers.
Alzheimer Disease
Alzheimer disease (AD) is the most common dementia, which starts with impairment of memory followed by multiple domains of cognitive dysfunction. The 2011 criteria for AD2,3 was revised from that in 1984,4 and the recommendations regarding the respective roles of FDG-PET and MR imaging in AD and mild cognitive impairment (MCI) are conflicting. However, PET plays an important role as a biomarker in AD, as well as for functional and molecular imaging. For example, FDG-PET is described as a “neuronal injury” biomarker in AD.2,3
FDG-PET in Alzheimer Disease
FDG-PET can demonstrate a glucose metabolic reduction in the parietotemporal association cortices, posterior cingulate, and precuneus regions at the early stage of AD (Fig 1). By contrast, in the healthy elderly brain, posterior cingulate glucose metabolism is much higher than that in other cortices, while parietal glucose metabolism is the same as that in the primary sensorimotor cortices (Fig 2). In the moderate-to-severe stages of AD, hypometabolic regions spread to the frontal association cortices, while metabolism in the striatum, thalamus, primary sensorimotor cortices, visual cortices, and cerebellum are relatively preserved despite disease progression.
Fig 1.
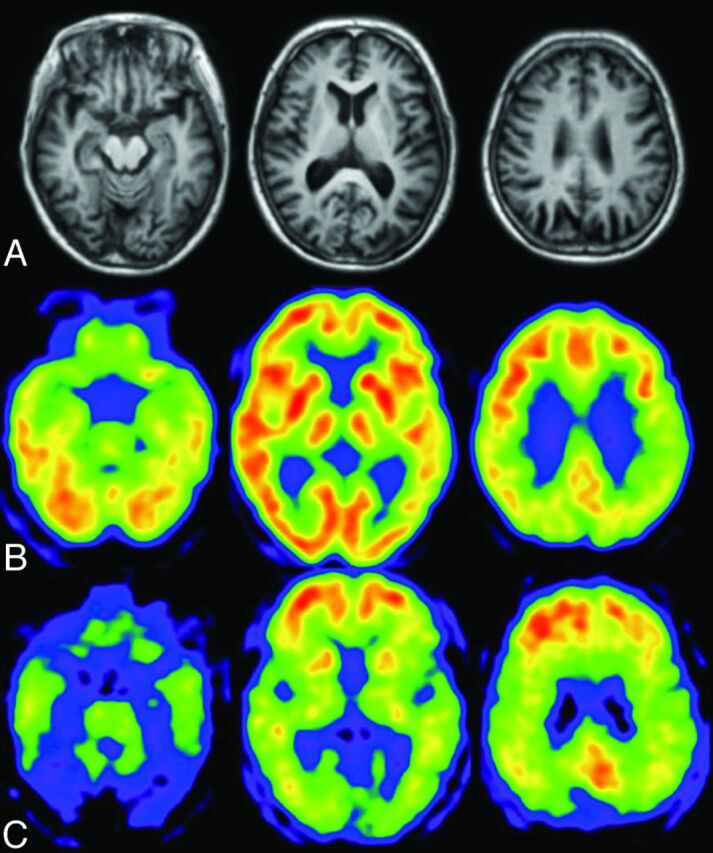
A patient with early Alzheimer disease, 77 years of age, Mini-Mental State Examination score = 25. A, Minimal atrophy was seen in the right hippocampus. B, FDG-PET shows reduced glucose metabolism in the bilateral parietotemporal association cortices and posterior cingulate gyri and precuneus. C, PiB accumulations are demonstrated in the cerebral cortices except for the occipital and medial temporal regions. Medial parietal and frontal accumulations of PiB are high, indicative of positive amyloid deposit.
Fig 2.
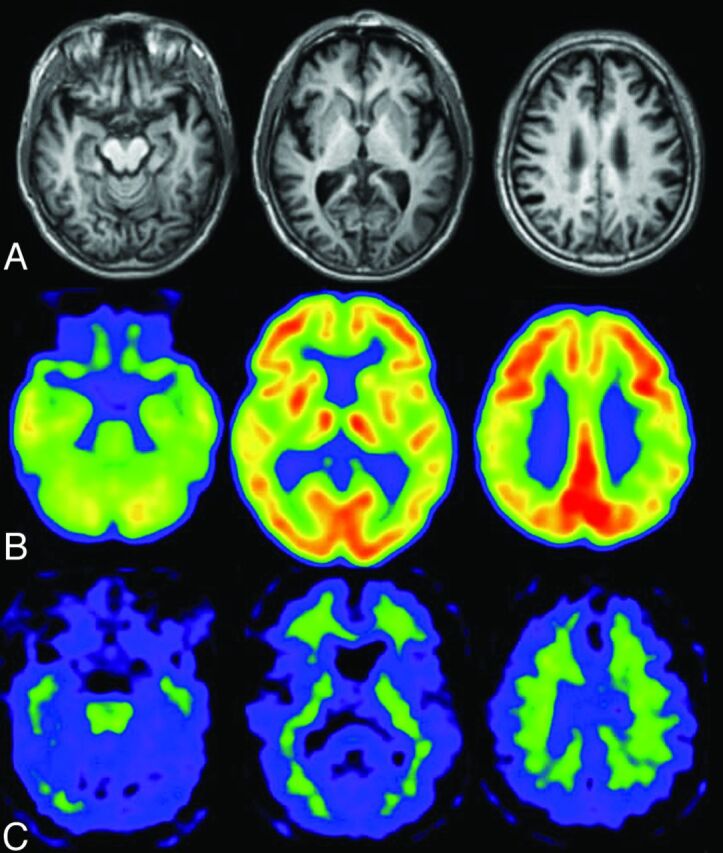
Healthy elderly male subject, 78 years of age, Mini-Mental State Examination score = 30. A, A slight enlargement of the right inferior horn of the lateral ventricle is seen on the T1-weighted MR image. B, The regional glucose metabolism is not reduced on the FDG-PET images. Note that the posterior cingulate glucose metabolism is much larger than that in other regions. C, PiB-PET shows nonspecific accumulation in the white matter but no PiB accumulation in the gray matter. The amyloid deposit is negative.
Because the magnitude of glucose metabolic reduction in the medial temporal lobe, including the hippocampus, is not as large as that in the parietotemporal or posterior cingulate cortices, a decrease in hippocampal glucose metabolism with progression from mild-to-moderate-stage AD is not usually demonstrated,5 despite obvious hippocampal atrophy at the early stage. Hippocampal glucose metabolism is somewhat decreased at the early stage of AD. However, it is difficult to detect the small reduction of hippocampal glucose metabolism in patients with early AD because the hippocampal glucose metabolism is smaller than the neocortical glucose metabolism, even in healthy subjects, and the magnitude of the decrease is modest. Thus, a method for detecting hippocampal metabolic reduction at an early stage of AD is required.6–8 However, Karow et al9 reported that FDG-PET has the same sensitivity as MR imaging for detecting brain degeneration in preclinical and mild AD, suggesting that MR imaging may be a more practical clinical biomarker for early detection of AD.
Mild Cognitive Impairment Due to Alzheimer Disease
Mild cognitive impairment consists of a heterogeneous pathology, and MCI due to AD is a transitional stage between aging and AD. MCI due to AD demonstrates the same glucose-reduction pattern as early AD (Fig 3), which predicts that the patient will show symptoms of AD in the near future. At the early stage of AD or MCI due to AD, it is difficult to detect the characteristic hypometabolic patterns on FDG-PET images by visual inspection. As such, statistical images are helpful. Nevertheless, FDG-PET generally has a higher accuracy than MR imaging for diagnosing early AD10,11 and for predicting rapid conversion of MCI to early AD.12 A combination of PET and other biomarkers is important because imaging and CSF biomarkers can improve prediction of conversion from MCI to AD compared with baseline clinical testing. FDG -PET appears to add the greatest prognostic information.13–16
Fig 3.

MCI due to AD. Regions exhibiting a significant reduction in glucose metabolism in patients with MCI due to AD (n = 20) compared with healthy elderly subjects (n = 20) are demonstrated by statistical parametric maps. Bilateral parietal and posterior cingulate metabolism is decreased in patients with MCI due to AD. These decreased regions are the same as those in patients with early AD.
Effects of APOE on FDG-PET and Amyloid Imaging of Alzheimer Disease
The apolipoprotein E gene (APOE) is a risk factor for late-onset AD, while the APOE ε4 allele (ε4) increases the risk and decreases the average age of dementia onset. Patients with early-onset AD who were APOE ε4–positive showed a significant decrease in glucose metabolism in the medial temporal lobe compared with patients with APOE ε4–negative AD.17 By contrast, in the late-onset group, there were no differences in the glucose-metabolic reduction patterns between patients with APOE ε4–positive and –negative AD. A similar pattern of cerebral hypometabolism was also detected between patients with APOE ε4–positive and –negative AD but with stronger abnormalities in ε4 carriers in the parietal, temporal, and posterior cingulate cortical regions.18 Recently Ossenkoppele et al19 found a reversed APOE ε4 dose effect for amyloid deposition in the frontal lobe, whereas APOE ε4 carriership was associated with more profound metabolic impairment in the posterior parts of the cortex. These findings suggest that the APOE genotype has a differential effect on the distribution of amyloid plaques and glucose metabolism.
Statistical Voxel-Based Analysis Approach for Alzheimer Disease Diagnosis
Minoshima et al20,21 first developed the 3D stereotactic surface projection system (3D-SSP; http://www.rad.washington.edu/research/Research/groups/nbl/neurostat-3d-ssp) and used z score images to aid visual inspection of individual FDG images for diagnosing AD (Fig 4). The Statistical Parametric Mapping program (Wellcome Department of Imaging Neuroscience, London, UK) was developed as a tool for analysis of PET and functional MR imaging images. For automatic diagnosis, Herholz et al22 proposed the t-sum method of calculating the total t-values in a region-of-interest template by using the Statistical Parametric Mapping program; by using this method, the parietotemporal and frontal regions were found to be AD-specific compared with healthy elderly subjects. An automatic diagnosis system by using 3D-SSP and a region-of-interest template was proposed for discriminating those with early AD from healthy subjects.23,24 This system was also applied to distinguish patients with dementia with Lewy bodies (DLB) from those with AD.24 All these systems require a data base of healthy controls. More recently, however, a data base–independent system was proposed by using t-statistics between parietal and sensorimotor glucose metabolism in individual subjects.25 Mevel et al26 proposed an automatic system for determining hippocampal metabolism by using a voxel-based method and partial volume correction, which was useful in detecting MCI.
Fig 4.

Process of voxel-based statistical maps. Original FDG-PET image of a patient with mild AD (A) is analyzed by using the 3D-SSP program, and the 3D-SSP surface map and z score map are produced. The z score map shows the regions with significantly reduced metabolism compared with a normal data base (B), which aid in the diagnosis of AD.
Combination of MR Imaging and PET
Most of the studies described above have focused on only a single technique such as structural MR imaging or PET. Yuan et al12 performed a meta-analysis and meta-regression on the diagnostic performance data for MR imaging, SPECT, and FDG-PET in subjects with MCI and reported that FDG-PET performed slightly better than SPECT and structural MR imaging in the prediction of conversion to AD in patients with MCI, while a combination of PET and structural MR imaging improved the diagnostic accuracy of dementia. Kawachi et al10 also compared the diagnostic performance of FDG-PET and voxel-based morphometry (VBM) on MR imaging in the same group of patients with very mild AD and reported an accuracy of 89% for FDG-PET diagnosis and 83% for VBM–MR imaging diagnosis, while the accuracy of combination FDG-PET and VBM-MR imaging diagnosis was 94%. These studies suggest that a combination of imaging modalities may improve the diagnosis of AD.
Amyloid Imaging in Alzheimer Disease
The most widely used tracer for amyloid imaging is 11C-Pittsburgh compound-B (PiB),27 which has a high affinity to amyloid β peptide (Aβ) aggregates. The 11C-BF 227 ligand is also used for amyloid imaging,28 though its uptake contrast between amyloid-positive and -negative brain tissue is not as high as that for PiB, and it is used only at a few institutions in Japan. Because the half-life of the 11C isotope is short, 11C-PiB is available only in specific institutions that have a cyclotron and a synthesis system. Conversely, the half-life of the 18F isotope is 110 minutes, and 18F-labeled amyloid imaging tracers will become widely used following production by radiopharmaceutical companies. Currently there are a few 18F-labeled amyloid imaging tracers available (Table 1),29 though in 2012, 18F-AV-45 (florbetapir)30 was approved by the FDA for PET imaging of β-amyloid neuritic plaques in the living brain. 18F-AZD4694 is also expected to be a good radioligand for both diagnostic use and evaluation of disease-modifying therapies in AD.31
Table 1:
Representative radiopharmaceuticals for amyloid imaging
| 11C-PiB | [11C]-2–4-(methylaminophenyl)- 6-hydroxybenzothiazole62 |
| 11C-BF227 | [11C]2-[2-(2-Dimethylaminothiazol-5-yl)ethenyl-6-[2-(fluoro)ethoxy]benzoxazole28 |
| 11C-AZD2184 | N-[11C]methyl)-2-(6-methylamino-pyridine-3-yl)-benzo[d]thiazole-6-ol66 |
| 18F-FDDNP | 2-(1-(6-[(2-[18F]fluoroethyl)(methyl)amino]-2-naphthyl)ethylidene)malononitrile67 |
| 18F-PiB | 2-[3-[18F]fluoro-4-(methylamino)phenyl]1,3-benzothiazole-6-ol68 |
| 18F-AV45 | (E)-4-(2-(6-(2-(2-(2-[18F]-fluoroethoxy)ethoxy)ethoxy)pyridin-3-yl)vinyl)-N-methyl benzenamine30 |
| 18F-BAY94–9172 | 4-(N-methylamino)-4′-(2-(2-(2-[18F]fluoroethoxy)-ethoxy)-ethoxy)-stilbene69 |
| 18F-AZD4694 | 2-(2-[18F]fluoro-6-(methylamino)pyridin-3-yl)benzofuran-5-ol30 |
Note:—18F-AV45 indicates florbetapir; 18F-BAY94–9172, florbetaben; 18F-PiB, flutemetamol.
Amyloid PET is helpful in the diagnosis of AD. However, the timing of amyloid accumulation is at a preclinical stage of AD.32 Early Aβ accumulation and increased vulnerability to Aβ pathology play critical roles in the pathogenesis of patients with early-onset AD.33 Aβ deposition initiates the pathologic cascade but is not the direct cause of cognitive impairment, and intermediate Aβ deposit may represent individuals with AD coexistent with other pathologies.34 Furthermore, amyloid deposit is not unique to AD and can be found in other diseases or healthy elderly people.
At present, amyloid PET is not indicated in patients with preclinical AD or healthy subjects, except for clinical trials or research studies. The appropriate usage criteria for amyloid PET were proposed by the Amyloid Imaging Task Force, the Society of Nuclear Medicine and Molecular Imaging, and the Alzheimer's Association.35,36 These criteria indicate that appropriate use of amyloid PET includes the following: 1) patients with persistent or progressive unexplained MCI; 2) patients with possible AD with unclear clinical presentation, either an atypical clinical course or an etiologically mixed presentation; and 3) patients with progressive dementia and atypically early age of onset. Inappropriate use of amyloid PET includes the following: 1) in patients with typical probable AD, 2) for determining the severity of dementia, 3) in subjects with a positive family history of dementia or the presence of APOE ε4, 4) in patients with a cognitive problem that is unconfirmed on clinical examination, 5) as a replacement for genotyping for suspected autosomal mutation carriers, 6) in asymptomatic subjects, and 7) for nonmedical use (eg, legal, insurance coverage, or employment screening).
Dementia with Lewy Bodies
Dementia with Lewy bodies is the second most common neurodegenerative dementia following AD and is characterized pathologically by the presence of Lewy bodies in cortical, subcortical, and brain stem structures. DLB belongs to the spectrum of Lewy body diseases including Parkinson disease (PD), where Lewy bodies remain in the brain stem. PD with dementia has the same pathology as DLB, though clinical symptoms slightly differ: Parkinsonism appears >1 year earlier than cognitive dysfunctions in PD with dementia.
In 2005, the criteria for clinical and pathologic diagnoses were revised36 and included an important role for functional and morphologic imaging. For example, low dopamine transporter uptake in the basal ganglia on SPECT and PET imaging scans is regarded as a suggestive feature for DLB, while supportive features include relative preservation of medial temporal lobe structures on CT/MR imaging and generalized low uptake on SPECT/PET, with reduced occipital activity and abnormal (low) uptake on metaiodobenzylguanidine myocardial scintigraphy. Relative preservation of the hippocampus in DLB compared with prominent hippocampal atrophy in AD is also a common finding, though there are many overlapping areas of hippocampal atrophy between patients with DLB and those with AD, making it impossible to distinguish a patient with DLB from one with AD by using only a finding of hippocampal atrophy.
The hypometabolic regions in patients with DLB are similar to those in AD, though patients with DLB exhibit a difference in the involved occipital lobe (Fig 5). The relative metabolic reduction was more severe in the occipital cortices and less severe in the medial temporal lobes in DLB compared with AD, and occipital hypometabolism is a key feature of DLB that discriminates it from AD.7,38,39 Nevertheless, pathologically, the occipital cortices are not as involved in patients with DLB. These findings are also seen in patients with PD and PD with dementia40 because DLB and PD with dementia are in the same disease entity, involving spread of Lewy bodies in the cerebral cortices.
Fig 5.

Decreased glucose metabolic regions of DLB (n = 20). Statistical parametric maps show the areas where glucose metabolism is significantly decreased compared with age-matched healthy controls (n = 20). The red area indicates the parietotemporal association area, and the posterior cingulate gyri overlap the area where glucose metabolism is decreased in AD. The blue area indicates occipital cortices that are specific for DLB, where the glucose metabolism is preserved in AD (n = 20).
Dopamine transporter imaging with 123I-N-ω-fluoropropyl-2β-carbomethoxy-3β-(4-iodophenyl)nortropane ([123I] FP-CIT) SPECT imaging is useful for diagnosing DLB and exhibits a diagnostic accuracy sufficient to distinguish DLB from AD.41 However, this imaging technique cannot distinguish other degenerative dementias with Parkinsonism (eg, progressive supranuclear palsy (PSP) and multiple system atrophy), while FDG-PET imaging can distinguish DLB from PSP and multiple-system atrophy. 123I-metaiodobenzylguanidine cardiac scintigraphy, which is typically used for myocardial innervation, also demonstrates a high sensitivity and specificity in patients with suspected DLB and provides an accurate examination for differential diagnosis between DLB and other dementias.42
Amyloid Imaging in Dementia with Lewy Bodies
Shimada et al43 reported that amyloid deposits are associated with AD-like atrophy in patients with DLB/PD with dementia. Patients with DLB have higher amyloid deposits than patients with PD and PD with dementia. Amyloid deposits have been linked to cognitive impairment in DLB44,45 and may contribute to the timing of the onset of dementia relative to that of Parkinsonism in Lewy body dementia.46 However, as shown in Fig 6, severe metabolic reduction was seen in some patients with DLB despite no evidence of amyloid deposits. In particular, regional metabolic reduction in patients with DLB was observed in the parietotemporal, posterior cingulate, and frontal association cortices, which are the same regions affected in AD but are not correlated with amyloid deposit.
Fig 6.

PiB-PET and FDG-PET images of patients with DLB. Upper row shows a 76-year-old man with DLB. This patient has Parkinsonism and cognitive fluctuation. His Mini-Mental State Examination score was 19. Diffuse glucose metabolic reduction is demonstrated in all regions apart from the striatum and primary sensorimotor cortices (upper left). PiB-PET (upper right) demonstrates a negative amyloid deposit. Lower row shows a 77-year-old woman with DLB, Parkinsonism, and cognitive fluctuation. Her Mini-Mental State Examination score was 23. FDG-PET demonstrates decreased glucose metabolism in the parietotemporal and frontal association cortices, occipital cortices, and posterior cingulate gyri, while metabolism in the striatum and primary sensorimotor metabolism is spared (lower left). PiB-PET demonstrated diffuse amyloid deposition in the cerebral cortices (lower right).
Frontotemporal Lobe Degeneration
Frontotemporal lobe degeneration (FTD) is a heterogeneous group of diseases involving frontal and/or anterior temporal lobe degeneration and associated dementia. Frontotemporal dementia is a comprehensive clinical entity of primary degenerative dementia characterized by peculiar behavioral changes and includes 3 types of histologic change (pick-type, frontal lobe degeneration type, and motor neuron disease type).47 Frontotemporal lobe degeneration includes FTD, semantic dementia, and progressive nonfluent aphasia, while FTD is now used clinically to classify patients with frontal and temporal symptoms.
In FTD, frontal and anterior temporal glucose metabolism is decreased, though the medial temporal region and the subcortical structures, including the striatum and thalamus, are also affected (Fig 7).48 According to a VBM study of FTD,49 metabolic and atrophic changes occur in the bilateral frontal and temporal lobes, whereas the affected regions of metabolism are larger and more severe than those of atrophy in the frontal lobe. In patients with semantic dementia, asymmetrically severely decreased temporal metabolism can be demonstrated on FDG-PET images (Fig 8). These areas can spread to the frontal and parietal cortices, though the degree of metabolism alteration is not as marked as in the anterior temporal cortices.
Fig 7.

Hypometabolic regions in FTD. Statistical parametric mapping analysis shows hypometabolic regions in patients with FTD (n = 14) compared with healthy age-matched subjects (n = 20). Glucose metabolism in subjects with FTD was significantly decreased in the bilateral lateral and medial frontal cortices, the posterior cingulate gyrus, and small regions in the parietal association cortices.
Fig 8.

FDG-PET image of a 54-year-old female patient with semantic dementia. A marked decreased left anterior temporal metabolism is shown on the FDG-PET image.
Amyloid Imaging in Frontotemporal Lobe Degeneration
In a study of PiB retention in patients with FTD, Engler et al50 reported that most patients with FTD displayed no PiB retention and that PiB could potentially aid in differentiating FTD and AD. Rabinovici et al51 also reported that 8/12 patients with frontotemporal lobe degeneration had negative amyloid deposits, and the 4 PiB-positive patients with frontotemporal lobe degeneration may suggest the mimicking of AD pathology.
Progressive Supranuclear Palsy
Progressive supranuclear palsy is a neurotauopathic degenerative disorder presenting with Parkinsonism and dementia. The neurologic features include impaired ocular motility, pseudobulbar palsy, and axial dystonia. The basal ganglia and brain stem are the main loci of pathologic involvement. MR imaging studies demonstrate brain stem atrophy with a so-called “humming bird” sign, though these findings are not often seen at the early stage of PSP. However, FDG-PET demonstrates decreased glucose metabolism in the midbrain, the lateral and medial frontal lobes, and the caudate nucleus, even at the early stage of PSP (Fig 9)52,53 and can distinguish PSP from other diseases with Parkinsonism.54,55
Fig 9.

Hypometabolic regions in PSP. Statistical parametric mapping analysis shows hypometabolic regions in patients with PSP (n = 16) compared with normal age-matched subjects (n = 20). Glucose metabolism in subjects with PSP is significantly decreased in the bilateral lateral and medial frontal cortices and midbrain. The significant decreased midbrain metabolism is a hallmark of PSP.
Corticobasal Degeneration
Corticobasal degeneration (CBD), which belongs to the corticobasal syndrome, is characterized by akineto-rigid syndrome, dystonia, myoclonus, apraxia, alien limb syndrome, and cortical sensory loss, and typically occurs with asymmetric onset. CBD is pathologically a tauopathic neurodegenerative disease and includes τ-immunoreactive neuronal cytoplasmic inclusions, oligodendroglial inclusions, and astrocytic plaques. FDG-PET demonstrates hypometabolism in the frontal and parietal cortices and the subcortical structures, including the thalamus, caudate nucleus, and putamen, with marked asymmetry between the 2 hemispheres. Patients with CBD with symptoms of dementia show an AD-like metabolic reduction pattern but asymmetric glucose-metabolic reduction in the lateral frontal, lateral temporal, medial and lateral parietal cortices; the pre- and postcentral gyri; and the thalamus on FDG-PET.56
Amyloid Imaging in Progressive Supranuclear Palsy and Corticobasal Degeneration
PSP and CBD are tauopathic neurodegenerative diseases that exhibit no amyloid deposition. If amyloid deposition is demonstrated with amyloid PET, it should be considered small amyloid deposits with age-related amyloid pathology or extended amyloid deposits similar to those in AD due to comorbidity of AD, which may be associated with APOE ε4.
Idiopathic Normal Pressure Hydrocephalus
Idiopathic normal pressure hydrocephalus is characterized by disproportionately enlarged cerebrospinal spaces, ventricle and Sylvian fissure dilation, and tight sulci at high convexity in the medial parietal sulci.57 To detect these features, morphologic images by using CT or MR imaging are necessary. On the other hand, functional images are not necessary because the glucose metabolic reduction pattern is heterogeneous in idiopathic normal pressure hydrocephalus.58 Glucose metabolism in idiopathic normal pressure hydrocephalus before and after a shunt operation is promptly reversible after surgery, and there is a relationship between the early metabolic changes and clinical symptoms that is independent of the simultaneous changes in ventricular size.59 Because idiopathic normal pressure hydrocephalus occurs in elderly individuals, there is a possibility for concomitant AD. Amyloid imaging with PET may be useful to detect early concomitant AD and other diseases associated with amyloid deposits.60
Vascular Dementia
Vascular dementia is diagnosed with clinical symptoms and by detecting symptoms related to vascular lesions demonstrated by morphologic imaging. As such, pure vascular dementia is not a PET-applicable dementia. However, vascular dementia is sometimes associated with AD or other neurodegenerative pathology, and these patients should be examined with FDG-PET to determine the comorbidity of AD or other neurodegenerative pathology. Amyloid imaging can be used to remove the comorbidity of AD pathology when there is no amyloid deposit.
Tau Imaging
After amyloid plaques, intracellular neurofibrillary tangles are an important hallmark of AD. Neurofibrillary tangles are preferentially located in the hippocampus and associative cortical regions. 18F-2-(1-{6-[(2-[F]Fluoroethyl)(methyl)amino]-2-naphthyl}ethylidene)malononitrile or FDDNP was initially developed for Aβ imaging, though this ligand binds to both Aβ plaques and neurofibrillary tangles in the brain. As such, FDDNP was expected to demonstrate both amyloid and neurofibrillary tangle deposits61 but has limited value for accurate measurement of τ-related pathology in patients with AD. 18F-THK-523 was developed as a potential in vivo imaging probe for τ pathology and was reported to accumulate in regions containing a high attenuation of τ protein deposits.62 This tracer is now being used in patients with AD. Some forms of FTD, PSP, and CBD are also characterized by pathologic accumulation of τ protein. Thus, τ imaging will be useful in distinguishing these diseases from AD.
Cost-Effectiveness of PET Imaging for Dementia
Silverman et al63 first evaluated the cost and benefit of the diagnosis of early AD by using FDG-PET and reported that appropriate use of FDG-PET can add valuable information to the clinical work-up, without adding to the overall costs of evaluation and management in the United States. In Europe, Moulin-Romsee et al64 reported that the introduction of FDG-PET into the clinical work-up of patients with suspected AD can result in substantial benefit in terms of health care cost savings and in benefit for the patient. For the present, there is still no radical treatment for AD because diagnosis of early or preclinical dementia remains controversial. Multicenter cohort studies should be performed to evaluate the cost-effectiveness of new biomarkers such as amyloid PET for early diagnosis of AD and other neurodegenerative dementias and to establish appropriate PET use criteria for the benefit of patients.
Conclusions
The use of PET enables the early detection of pathophysiologic changes in patients with dementia and allows differential diagnosis among neurodegenerative dementias. A summary of FDG-PET and amyloid PET findings for each neurodegenerative dementia is shown in Table 2. Each disease has characteristic regional metabolic reduction patterns on FDG-PET. PET is now used as an in vivo imaging technique for examining neurodegenerative dementia including AD and for detecting the early symptomatic and preclinical stages of dementia.
Table 2:
General FDG-PET and amyloid PET findings in neurodegenerative dementia
| PC | Pari | Lat. Temp | Med. Temp | Fron | Occ | SM | ST | TH | BS | AMY | |
|---|---|---|---|---|---|---|---|---|---|---|---|
| MCI due to AD | ↓ | ↓ | → | → (or ↓) | → | → | → | → | → | → | + or ++ |
| AD (mild) | ↓ | ↓ | ↓ | → (or ↓) | → | → | → | → | → | → | ++ |
| AD (moderate) | ↓ | ↓ | ↓ | ↓ | ↓ | → | → | → | → | → | ++ |
| DLB | ↓ | ↓ | ↓ | → | ↓ | ↓ | → | → | → | → | + or − |
| FTD | → (or ↓) | → (or ↓) | ↓ | ↓ | → | → | → | → or ↓ | → | → | − |
| SD | → | → (or ↓) | ↓↓ | ↓ | → | → | → | → | → | → | − |
| PSP | → | → | → (or ↓) | → | ↓ | → | → | ↓ | → | ↓ | − |
| CBD 1) | ↓ | ↓ | ↓ | → | ↓ | → | ↓ | ↓ | ↓ | → | − |
| VaD 2) | → (or ↓) | → (or ↓) | → or ↓ | → or ↓ | ↓ | → | → or ↓ | → or ↓ | → or ↓ | → | − |
Note:—PC indicates posterior cingulate gyrus; Pari, parietal association cortex; Lat. Temp, lateral temporal cortex; Med. Temp, medial temporal cortex; Fron, frontal cortex; Occ, occipital cortex; SM, sensorimotor cortex; ST, striatum; TH, thalamus; BS, brain stem; AMY, amyloid deposition: 1) asymmetric reduction is characteristic, 2) frontal dominant metabolic reduction is often demonstrated in addition to infarction region; SD, semantic dementia; VaD, vascular dementia; ↓, decreased; →, preserved; +, positive; −, negative.
Acknowledgments
I thank Takamichi Murakami, MD, PhD, Chisa Hosokawa, MD, PhD, Tomoko Hyodo, MD, PhD, Kenta Sakaguchi, RT, Kimio Usamai, RT, Yoshiyuki Nakayama, Kenji Shimamoto, PhD, and Yuzuru Yamazoe, PhD, for their support for brain FDG-PET and PiB-PET at Kinki University and former staff members at the Hyogo Institute for Aging Brain and Cognitive Disorders.
ABBREVIATIONS:
- Aβ
amyloid β peptide
- AD
Alzheimer disease
- APOE
apolipoprotein E
- CBD
corticobasal degeneration
- DLB
dementia with Lewy bodies
- FTD
frontotemporal dementia
- MCI
mild cognitive impairment
- PD
Parkinson disease
- PiB
Pittsburgh compound-B
- PSP
progressive supranuclear palsy
- VBM
voxel-based morphometry
Footnotes
Disclosures: Kazunari Ishii—RELATED: Grant: JSPS KAKENHI Grant Number 50534103, and 21st century research and development incentive wages at Kinki University.
This work was supported by JSPS KAKENHI grant number 50534103 and 21st Century Research and Development Incentive Wages at Kinki University.
Paper previously presented at: 98th Scientific Assembly and Meeting of the Radiological Society of North America, November 25–30, 2012; Chicago, Illinois.
References
- 1. Ishii K. Clinical application of positron emission tomography for diagnosis of dementia. Ann Nucl Med 2002;16:515–25 [DOI] [PubMed] [Google Scholar]
- 2. McKhann GM, Knopman DS, Chertkow H, et al. The diagnosis of dementia due to Alzheimer's disease: recommendations from the National Institute on Aging-Alzheimer's Association workgroups on diagnostic guidelines for Alzheimer's disease. Alzheimers Dement 2011;7:263–69 [DOI] [PMC free article] [PubMed] [Google Scholar]
- 3. Albert MS, DeKosky ST, Dickson D, et al. The diagnosis of mild cognitive impairment due to Alzheimer's disease: recommendations from the National Institute on Aging-Alzheimer's Association workgroups on diagnostic guidelines for Alzheimer's disease. Alzheimers Dement 2011;7:270–79 [DOI] [PMC free article] [PubMed] [Google Scholar]
- 4. McKhann G, Drachman D, Folstein M, et al. Clinical diagnosis of Alzheimer's disease: report of the NINCDS-ADRDA Work Group under the auspices of Department of Health and Human Services Task Force on Alzheimer's Disease. Neurology 1984;34:939–44 [DOI] [PubMed] [Google Scholar]
- 5. Ishii K, Sasaki M, Yamaji S, et al. Relatively preserved hippocampal glucose metabolism in mild Alzheimer's disease. Dement Geriatr Cogn Disord 1998;9:317–22 [DOI] [PubMed] [Google Scholar]
- 6. Maldjian JA, Whitlow CT. Whither the hippocampus? FDG-PET hippocampal hypometabolism in Alzheimer disease revisited. AJNR Am J Neuroradiol 2012;33:1975–82 [DOI] [PMC free article] [PubMed] [Google Scholar]
- 7. Ishii K, Soma T, Kono AK, et al. Comparison of regional brain volume and glucose metabolism between patients with mild dementia with Lewy bodies and those with mild Alzheimer's disease. J Nucl Med 2007;48:704–11 [DOI] [PubMed] [Google Scholar]
- 8. Mosconi L, Tsui WH, De Santi S, et al. Reduced hippocampal metabolism in MCI and AD: automated FDG-PET image analysis. Neurology 2005;64:1860–67 [DOI] [PubMed] [Google Scholar]
- 9. Karow DS, McEvoy LK, Fennema-Notestine C, et al. Relative capability of MR imaging and FDG PET to depict changes associated with prodromal and early Alzheimer disease. Radiology 2010;256:932–42 [DOI] [PMC free article] [PubMed] [Google Scholar]
- 10. Kawachi T, Ishii K, Sakamoto S, et al. Comparison of the diagnostic performance of FDG-PET and VBM-MRI in very mild Alzheimer's disease. Eur J Nucl Med Mol Imaging 2006;33:801–09 [DOI] [PubMed] [Google Scholar]
- 11. Matsunari I, Samuraki M, Chen WP, et al. Comparison of 18F-FDG PET and optimized voxel-based morphometry for detection of Alzheimer's disease: aging effect on diagnostic performance. J Nucl Med 2007;48:1961–70 [DOI] [PubMed] [Google Scholar]
- 12. Yuan Y, Gu ZX, Wei WS. Fluorodeoxyglucose-positron-emission tomography, single-photon emission tomography, and structural MR imaging for prediction of rapid conversion to Alzheimer disease in patients with mild cognitive impairment: a meta-analysis. AJNR Am J Neuroradiol 2009;30:404–10 [DOI] [PMC free article] [PubMed] [Google Scholar]
- 13. Shaffer JL, Petrella JR, Sheldon FC, et al. Predicting cognitive decline in subjects at risk for Alzheimer disease by using combined cerebrospinal fluid, MR imaging, and PET biomarkers. Radiology 2013;266:583–91 [DOI] [PMC free article] [PubMed] [Google Scholar]
- 14. Choo IH, Ni R, Scholl M, et al. Combination of 18F-FDG PET and cerebrospinal fluid biomarkers as a better predictor of the progression to Alzheimer's disease in mild cognitive impairment patients. J Alzheimers Dis 2013;33:929–39 [DOI] [PubMed] [Google Scholar]
- 15. Westman E, Muehlboeck JS, Simmons A. Combining MRI and CSF measures for classification of Alzheimer's disease and prediction of mild cognitive impairment conversion. Neuroimage 2012;62:229–38 [DOI] [PubMed] [Google Scholar]
- 16. Zhang D, Shen D. Predicting future clinical changes of MCI patients using longitudinal and multimodal biomarkers. PLoS One 2012;7:e33182. [DOI] [PMC free article] [PubMed] [Google Scholar]
- 17. Hirono N, Hashimoto M, Yasuda M, et al. The effect of APOE epsilon4 allele on cerebral glucose metabolism in AD is a function of age at onset. Neurology 2002;58:743–50 [DOI] [PubMed] [Google Scholar]
- 18. Drzezga A, Riemenschneider M, Strassner B, et al. Cerebral glucose metabolism in patients with AD and different APOE genotypes. Neurology 2005;64:102–07 [DOI] [PubMed] [Google Scholar]
- 19. Ossenkoppele R, van der Flier WM, Zwan MD, et al. Differential effect of APOE genotype on amyloid load and glucose metabolism in AD dementia. Neurology 2013;80:359–65 [DOI] [PubMed] [Google Scholar]
- 20. Minoshima S, Koeppe RA, Frey KA, et al. Stereotactic PET atlas of the human brain: aid for visual interpretation of functional brain images. J Nucl Med 1994;35:949–54 [PubMed] [Google Scholar]
- 21. Minoshima S, Frey KA, Koeppe RA, et al. A diagnostic approach in Alzheimer's disease using three-dimensional stereotactic surface projections of fluorine-18-FDG PET. J Nucl Med 1995;36:1238–48 [PubMed] [Google Scholar]
- 22. Herholz K, Salmon E, Perani D, et al. Discrimination between Alzheimer dementia and controls by automated analysis of multicenter FDG PET. Neuroimage 2002;17:302–16 [DOI] [PubMed] [Google Scholar]
- 23. Ishii K, Kono AK, Sasaki H, et al. Fully automatic diagnostic system for early- and late-onset mild Alzheimer's disease using FDG PET and 3D-SSP. Eur J Nucl Med Mol Imaging 2006;33:575–83 [DOI] [PubMed] [Google Scholar]
- 24. Kono AK, Ishii K, Sofue K, et al. Fully automatic differential diagnosis system for dementia with Lewy bodies and Alzheimer's disease using FDG-PET and 3D-SSP. Eur J Nucl Med Mol Imaging 2007;34:1490–97 [DOI] [PubMed] [Google Scholar]
- 25. Uemura T, Ishii K, Miyamoto N, et al. Computer-assisted system for diagnosis of Alzheimer disease using data base-independent estimation and fluorodeoxyglucose-positron-emission tomography and 3D-stereotactic surface projection. AJNR Am J Neuroradiol 2011;32:556–59 [DOI] [PMC free article] [PubMed] [Google Scholar]
- 26. Mevel K, Desgranges B, Baron JC, et al. Detecting hippocampal hypometabolism in mild cognitive impairment using automatic voxel-based approaches. Neuroimage 2007;37:18–25 [DOI] [PubMed] [Google Scholar]
- 27. Klunk WE, Engler H, Nordberg A, et al. Imaging brain amyloid in Alzheimer's disease with Pittsburgh Compound-B. Ann Neurol 2004;55:306–19 [DOI] [PubMed] [Google Scholar]
- 28. Kudo Y, Okamura N, Furumoto S, et al. 2-(2-[2-Dimethylaminothiazol-5-yl]ethenyl)-6-(2-[fluoro]ethoxy)benzoxazole: a novel PET agent for in vivo detection of dense amyloid plaques in Alzheimer's disease patients. J Nucl Med 2007;48:553–61 [DOI] [PubMed] [Google Scholar]
- 29. Lucignani G. Clinical applications of PET amyloid imaging: an update. Eur J Nucl Med Mol Imaging 2009;36:1185–90 [DOI] [PubMed] [Google Scholar]
- 30. Choi SR, Golding G, Zhuang Z, et al. Preclinical properties of 18F-AV-45: a PET agent for Abeta plaques in the brain. J Nucl Med 2009;50:1887–94 [DOI] [PMC free article] [PubMed] [Google Scholar]
- 31. Cselényi Z, Jonhagen ME, Forsberg A, et al. Clinical validation of 18F-AZD4694, an amyloid-beta-specific PET radioligand. J Nucl Med 2012;53:415–24 [DOI] [PubMed] [Google Scholar]
- 32. Jack CR Jr, Knopman DS, Jagust WJ, et al. Hypothetical model of dynamic biomarkers of the Alzheimer's pathological cascade. Lancet Neurol 2010;9:119–28 [DOI] [PMC free article] [PubMed] [Google Scholar]
- 33. Rabinovici GD, Furst AJ, Alkalay A, et al. Increased metabolic vulnerability in early-onset Alzheimer's disease is not related to amyloid burden. Brain 2010;133:512–28 [DOI] [PMC free article] [PubMed] [Google Scholar]
- 34. Jack CR Jr, Wiste HJ, Vemuri P, et al. Brain beta-amyloid measures and magnetic resonance imaging atrophy both predict time-to-progression from mild cognitive impairment to Alzheimer's disease. Brain 2010;133:3336–48 [DOI] [PMC free article] [PubMed] [Google Scholar]
- 35. Johnson KA, Minoshima S, Bohnen NI, et al. Appropriate use criteria for amyloid PET: a report of the Amyloid Imaging Task Force, the Society of Nuclear Medicine and Molecular Imaging, and the Alzheimer's Association. J Nucl Med 2013;54:476–90 [DOI] [PubMed] [Google Scholar]
- 36. Johnson KA, Minoshima S, Bohnen NI, et al. Appropriate use criteria for amyloid PET: a report of the Amyloid Imaging Task Force, the Society of Nuclear Medicine and Molecular Imaging, and the Alzheimer's Association. Alzheimers Dement 2013;9:e-1–16 [DOI] [PMC free article] [PubMed] [Google Scholar]
- 37. McKeith IG, Dickson DW, Lowe J, et al. Diagnosis and management of dementia with Lewy bodies: third report of the DLB Consortium. Neurology 2005;65:1863–72 [DOI] [PubMed] [Google Scholar]
- 38. Albin RL, Minoshima S, D'Amato CJ, et al. Fluoro-deoxyglucose positron emission tomography in diffuse Lewy body disease. Neurology 1996;47:462–66 [DOI] [PubMed] [Google Scholar]
- 39. Ishii K, Imamura T, Sasaki M, et al. Regional cerebral glucose metabolism in dementia with Lewy bodies and Alzheimer's disease. Neurology 1998;51:125–30 [DOI] [PubMed] [Google Scholar]
- 40. Bohnen NI, Koeppe RA, Minoshima S, et al. Cerebral glucose metabolic features of Parkinson disease and incident dementia: longitudinal study. J Nucl Med 2011;52:848–55 [DOI] [PMC free article] [PubMed] [Google Scholar]
- 41. McKeith I, O'Brien J, Walker Z, et al. Sensitivity and specificity of dopamine transporter imaging with 123I-FP-CIT SPECT in dementia with Lewy bodies: a phase III, multicentre study. Lancet Neurol 2007;6:305–13 [DOI] [PubMed] [Google Scholar]
- 42. Treglia G, Cason E. Diagnostic performance of myocardial innervation imaging using MIBG scintigraphy in differential diagnosis between dementia with Lewy bodies and other dementias: a systematic review and a meta-analysis. J Neuroimaging 2012;22:111–17 [DOI] [PubMed] [Google Scholar]
- 43. Shimada H, Shinotoh H, Hirano S, et al. Beta-amyloid in Lewy body disease is related to Alzheimer's disease-like atrophy. Mov Disord 2013;28:169–75 [DOI] [PubMed] [Google Scholar]
- 44. Gomperts SN, Rentz DM, Moran E, et al. Imaging amyloid deposition in Lewy body diseases. Neurology 2008;71:903–10 [DOI] [PMC free article] [PubMed] [Google Scholar]
- 45. Gomperts SN, Locascio JJ, Marquie M, et al. Brain amyloid and cognition in Lewy body diseases. Mov Disord 2012;27:965–73 [DOI] [PMC free article] [PubMed] [Google Scholar]
- 46. Fujishiro H, Iseki E, Higashi S, et al. Distribution of cerebral amyloid deposition and its relevance to clinical phenotype in Lewy body dementia. Neurosci Lett 2010;486:19–23 [DOI] [PubMed] [Google Scholar]
- 47. Clinical and neuropathological criteria for frontotemporal dementia; the Lund and Manchester Groups. J Neurol Neurosurg Psychiatry 1994;57:416–18 [DOI] [PMC free article] [PubMed] [Google Scholar]
- 48. Ishii K, Sakamoto S, Sasaki M, et al. Cerebral glucose metabolism in patients with frontotemporal dementia. J Nucl Med 1998;39:1875–78 [PubMed] [Google Scholar]
- 49. Kanda T, Ishii K, Uemura T, et al. Comparison of grey matter and metabolic reductions in frontotemporal dementia using FDG-PET and voxel-based morphometric MR studies. Eur J Nucl Med Mol Imaging 2008;35:2227–34 [DOI] [PubMed] [Google Scholar]
- 50. Engler H, Santillo AF, Wang SX, et al. In vivo amyloid imaging with PET in frontotemporal dementia. Eur J Nucl Med Mol Imaging 2008;35:100–06 [DOI] [PubMed] [Google Scholar]
- 51. Rabinovici GD, Furst AJ, O'Neil JP, et al. 11C-PIB PET imaging in Alzheimer disease and frontotemporal lobar degeneration. Neurology 2007;68:1205–12 [DOI] [PubMed] [Google Scholar]
- 52. Juh R, Pae CU, Kim TS, et al. Cerebral glucose metabolism in corticobasal degeneration comparison with progressive supranuclear palsy using statistical mapping analysis. Neurosci Lett 2005;383:22–27 [DOI] [PubMed] [Google Scholar]
- 53. Juh R, Kim J, Moon D, et al. Different metabolic patterns analysis of Parkinsonism on the 18F-FDG PET. Eur J Radiol 2004;51:223–33 [DOI] [PubMed] [Google Scholar]
- 54. Klein RC, de Jong BM, de Vries JJ, et al. Direct comparison between regional cerebral metabolism in progressive supranuclear palsy and Parkinson's disease. Mov Disord 2005;20:1021–30 [DOI] [PubMed] [Google Scholar]
- 55. Hosaka K, Ishii K, Sakamoto S, et al. Voxel-based comparison of regional cerebral glucose metabolism between PSP and corticobasal degeneration. J Neurol Sci 2002;199:67–71 [DOI] [PubMed] [Google Scholar]
- 56. Hirono N, Ishii K, Sasaki M, et al. Features of regional cerebral glucose metabolism abnormality in corticobasal degeneration. Dement Geriatr Cogn Disord 2000;11:139–46 [DOI] [PubMed] [Google Scholar]
- 57. Hashimoto M, Ishikawa M, Mori E, et al. Diagnosis of idiopathic normal pressure hydrocephalus is supported by MRI-based scheme: a prospective cohort study. Cerebrospinal Fluid Res 2010;7:18. [DOI] [PMC free article] [PubMed] [Google Scholar]
- 58. Jagust WJ, Friedland RP, Budinger TF. Positron emission tomography with [18F]fluorodeoxyglucose differentiates normal pressure hydrocephalus from Alzheimer-type dementia. J Neurol Neurosurg Psychiatry 1985;48:1091–96 [DOI] [PMC free article] [PubMed] [Google Scholar]
- 59. Calcagni ML, Lavalle M, Mangiola A, et al. Early evaluation of cerebral metabolic rate of glucose (CMRglu) with 18F-FDG PET/CT and clinical assessment in idiopathic normal pressure hydrocephalus (INPH) patients before and after ventricular shunt placement: preliminary experience. Eur J Nucl Med Mol Imaging 2012;39:236–41 [DOI] [PubMed] [Google Scholar]
- 60. Rinne JO, Wong DF, Wolk DA, et al. [18F]Flutemetamol PET imaging and cortical biopsy histopathology for fibrillar amyloid beta detection in living subjects with normal pressure hydrocephalus: pooled analysis of four studies. Acta Neuropathol 2012;124:833–45 [DOI] [PubMed] [Google Scholar]
- 61. Shin J, Kepe V, Barrio JR, et al. The merits of FDDNP-PET imaging in Alzheimer's disease. J Alzheimers Dis 2011;26(suppl 3):135–45 [DOI] [PubMed] [Google Scholar]
- 62. Fodero-Tavoletti MT, Okamura N, Furumoto S, et al. 18F-THK523: a novel in vivo tau imaging ligand for Alzheimer's disease. Brain 2011;134:1089–100 [DOI] [PubMed] [Google Scholar]
- 63. Silverman DH, Gambhir SS, Huang HW, et al. Evaluating early dementia with and without assessment of regional cerebral metabolism by PET: a comparison of predicted costs and benefits. J Nucl Med 2002;43:253–66 [PubMed] [Google Scholar]
- 64. Moulin-Romsee G, Maes A, Silverman D, et al. Cost-effectiveness of 18F-fluorodeoxyglucose positron emission tomography in the assessment of early dementia from a Belgian and European perspective. Eur J Neurol 2005;12:254–63 [DOI] [PubMed] [Google Scholar]
- 65. Mathis CA, Wang Y, Holt DP, et al. Synthesis and evaluation of 11C-labeled 6-substituted 2-arylbenzothiazoles as amyloid imaging agents. J Med Chem 2003;46:2740–54 [DOI] [PubMed] [Google Scholar]
- 66. Nyberg S, Jonhagen ME, Cselenyi Z, et al. Detection of amyloid in Alzheimer's disease with positron emission tomography using [11C]AZD2184. Eur J Nucl Med Mol Imaging 2009;36:1859–63 [DOI] [PMC free article] [PubMed] [Google Scholar]
- 67. Agdeppa ED, Kepe V, Liu J, et al. Binding characteristics of radiofluorinated 6-dialkylamino-2-naphthylethylidene derivatives as positron emission tomography imaging probes for beta-amyloid plaques in Alzheimer's disease. J Neurosci 2001;21:RC189. [DOI] [PMC free article] [PubMed] [Google Scholar]
- 68. Nelissen N, Van Laere K, Thurfjell L, et al. Phase 1 study of the Pittsburgh compound B derivative 18F-flutemetamol in healthy volunteers and patients with probable Alzheimer disease. J Nucl Med 2009;50:1251–59 [DOI] [PubMed] [Google Scholar]
- 69. Rowe CC, Ackerman U, Browne W, et al. Imaging of amyloid beta in Alzheimer's disease with 18F-BAY94–9172, a novel PET tracer: proof of mechanism. Lancet Neurol 2008;7:129–35 [DOI] [PubMed] [Google Scholar]