

Abstract
BACKGROUND AND PURPOSE:
Epilepsy is considered a disorder of neural networks. The aims of this study were to assess functional connectivity within resting-state networks and functional network connectivity across resting-state networks by use of resting-state fMRI in children with frontal lobe epilepsy and to relate changes in resting-state networks with neuropsychological function.
MATERIALS AND METHODS:
Fifteen patients with frontal lobe epilepsy and normal MR imaging and 14 healthy control subjects were recruited. Spatial independent component analysis was used to identify the resting-state networks, including frontal, attention, default mode network, sensorimotor, visual, and auditory networks. The Z-maps of resting-state networks were compared between patients and control subjects. The relation between abnormal connectivity and neuropsychological function was assessed. Correlations from all pair-wise combinations of independent components were performed for each group and compared between groups.
RESULTS:
The frontal network was the only network that showed reduced connectivity in patients relative to control subjects. The remaining 5 networks demonstrated both reduced and increased functional connectivity within resting-state networks in patients. There was a weak association between connectivity in frontal network and executive function (P = .029) and a significant association between sensorimotor network and fine motor function (P = .004). Control subjects had 79 pair-wise independent components that showed significant temporal coherence across all resting-state networks except for default mode network–auditory network. Patients had 66 pairs of independent components that showed significant temporal coherence across all resting-state networks. Group comparison showed reduced functional network connectivity between default mode network–attention, frontal-sensorimotor, and frontal-visual networks and increased functional network connectivity between frontal-attention, default mode network–sensorimotor, and frontal-visual networks in patients relative to control subjects.
CONCLUSIONS:
We found abnormal functional connectivity within and across resting-state networks in children with frontal lobe epilepsy. Impairment in functional connectivity was associated with impaired neuropsychological function.
Functional connectivity as measured by the use of fMRI is defined as the temporal synchronization of low-frequency fluctuations arising from spontaneous neuronal activities in distant brain regions.1 Resting-state networks (RSNs) refer to spatially segregated brain regions that exhibit spontaneous low-frequency fluctuations and may represent intrinsic brain functional connectivity in discrete neuroanatomic systems.2 A variety of RSNs has been identified including default mode network (DMN), attention, sensorimotor, visual, and auditory networks.3,4 Independent component analysis (ICA) has been increasingly used to examine functional connectivity.5–7 ICA is a method for recovering underlying signals from linear mixtures of these signals and draws on higher-order signal statistics to determine a set of “components” that are maximally independent of each other.8 ICA has been found to be useful and able to capture the complex nature of fMRI time courses as well as to produce consistent spatial components.9 Within a given component, the regions are strongly temporally coherent as the result of ICA assumption of linear mixing. In spatial ICA, the different components are spatially independent but can have temporal dependencies. This temporal dependency among ICA components has been defined as functional network connectivity (FNC). FNC provides a means of assessing temporal connectivity among RSNs.
Epilepsy has been postulated to be a disorder of large neural networks on the basis of electroencephalography, PET, and SPECT studies.10 Several studies have evaluated RSNs by the use of fMRI in adults with temporal lobe epilepsy (TLE), generalized tonic-clonic seizures, and absence epilepsy11–16 and found impairment in many of the individual RSNs. There is currently limited information available on functional connectivity in children with epilepsy.17,18 Frontal lobe epilepsy (FLE) is a common localization-related epilepsy in childhood.19 The interictal discharges arising from a unilateral frontal lobe focus in FLE are more likely to spread to both hemispheres and form secondary bilateral synchrony, and children with FLE are also more likely to have secondarily generalized tonic-clonic seizures relative to TLE.20 Our hypothesis is that in children with FLE, functional connectivity within RSNs including frontal, DMN, and attention networks are abnormal, related to spread of seizure activity, or caused by underlying abnormal brain development that predisposed to epilepsy. The aims of this study were to assess functional connectivity within RSNs and FNC across RSNs by use of resting-state fMRI in children with FLE and to relate changes in RSNs with neuropsychological function.
Materials and Methods
Subjects
This prospective study had the approval of the research ethics board at the Hospital for Sick Children, and written informed consent was obtained from parents and assent from subjects. Children with FLE were recruited from the epilepsy surgery clinic. Healthy control subjects without neurologic or psychiatric disorders were recruited through community publications.
MR Imaging and Data Preprocessing
MR imaging was performed on a 3T scanner (Achieva; Philips, Best, the Netherlands) with the use of an 8-channel phased-array head coil in all patients and control subjects. Resting-state fMRI was acquired with the eyes closed in all subjects, by use of the following parameters: TR = 2000 ms, TE = 30 ms, flip angle = 90°, FOV = 220 mm, matrix = 88 × 86 mm, section thickness = 5 mm, and 180 volumes, aligned to the anterior/posterior commissure line. Axial and coronal FLAIR, axial and coronal T2 and proton density, and volumetric T1 sequences were performed in patients. An additional volumetric T1 sequence was performed in control subjects.
A series of data preprocessing steps was carried out by use of Analysis of Functional NeuroImages (AFNI21; http://afni.nimh.nih.gov/afni/) and FMRIB Software Library (FSL22; http://www.fmrib.ox.ac.uk/fsl/) software packages. The preprocessing steps included removing the first 10 volumes of each fMRI run to allow for T1-equilibrium effects, and the remaining volumes of the fMRI dataset were rigidly registered to the first volume of the same run. Section-timing correction was then performed on the motion-corrected data. The anatomic T1 and fMRI datasets were skull-stripped by use of AFNI. The fMRI dataset was first aligned to T1 by affine transformation, and subsequently the T1 was affinely registered to Montreal Neurological Institute's MNI152 brain template. The 2 transformations were then concatenated and used to resample the fMRI image to the MNI atlas. The fMRI data were then spatially smoothed by use of a gaussian kernel of 8-mm full width at half maximum.
Independent Component Analysis
To identify RSNs, spatial ICA was used to decompose the data of all individuals in both control and patient groups into 75 independent components (ICs). Each component is associated with a waveform that corresponds to the temporal profile of a specific pattern of coherent brain activity and a spatial map that expresses the intensity with which this connectivity is found across the voxels.23 We used the Infomax algorithm implemented in the group ICA of fMRI Toolbox (GIFT24; http://icatb.sourceforge.net/groupica.htm, version v2.0e). A high model order ICA (75 components) was chosen because it has been shown that higher orders resulted in refined components corresponding to known anatomic and functional composition.25–28
All ICs were spatially correlated with the T-maps of the 27 RSNs reported by Allen et al28 (available on-line at http://mialab.mrn.org/data/hcp/RSN_HC_unthresholded_tmaps.nii). Briefly, they identified a subset of ICs as resting-state components by inspecting the spatial maps and average power spectra. The resting-state components were grouped according to their anatomic and functional properties and included auditory systems represented by a single component; sensorimotor, visual, and attention networks, each captured by 6 components; and frontal and DMN, each captured by 4 components. The components corresponding to each RSN were extracted from all subjects in both groups. Intensity values in each spatial map were converted to z scores to reflect the degree to which the time series of each voxel correlated with the time series of a specific component, scaled by the standard deviation of the error term. In other words, the z score is a measure of how many standard deviations the signal is from the background noise.29
A random-effect analysis was done on the Z-maps of all RSN components within each group by means of a 1-sample t test. Thresholds were set at P < .005 (false discovery rate corrected). Next, a 2-sample t test was performed to compare the Z-maps of the RSNs between the patient and control groups. In this case, the threshold was set at P < .005 (uncorrected), and a minimum cluster size of 30 voxels was used. The group comparison was masked to the voxels within the networks of either the control or patient groups.15,30
Neuropsychological Assessment and Clinical Parameters
Neuropsychological assessment was conducted in patients and control subjects to assess executive function (Delis-Kaplan Executive Function System [DKEFS] color-word interference test inhibition, DKEFS category switch, DKEFS sorting test, DKEFS verbal fluency, and Connor CPT II omission test), attention (Trail-Making tests A and B), and fine motor function (grooved pegboard dominant and nondominant tests). The raw scores of the neuropsychological tests were converted to z scores. The mean cognitive domain z scores for executive function, attention, and fine motor function were computed. The z scores of the clusters that were significant after group comparison for the frontal network were regressed on executive function, DMN and attention networks were regressed on attention, and the sensorimotor network was regressed on fine motor function in all subjects. A value of P < .01 was considered statistically significant.
The z scores of the clusters that were significant after group comparison were regressed against age at seizure onset and duration of epilepsy. A value of P < .01 was considered statistically significant.
Functional Network Connectivity
The ICA algorithm assumes that the time courses of brain areas within the same component are synchronous.31 Despite being spatially independent, significant temporal correlations can exist between the components. We studied such temporal relationships by examining the time series of the resting-state components of interest by use of the FNC toolbox (available on-line at http://mialab.mrn.org/software/fnc/index.html). The constrained maximal lagged correlation was calculated between component time courses as previously described by Jafri et al.32
To enable detection of subrepetition time, hemodynamic delay differences between subjects, the time courses from all the resting-state components for all subjects were first interpolated by use of a low-pass interpolation algorithm implemented in Matlab (MathWorks, Natick, Massachusetts, 2000). The maximal lagged correlation between pair-wise combinations of all ICs of interest was then calculated with the maximum possible lag between time courses set at ±3 seconds. More specifically, the correlation between 2 IC time courses, A and B, was calculated by circularly shifting B around A from −3 to +3 seconds. The maximum absolute correlation value was saved for all pairs of IC time courses for all subjects. Average correlation and lag values were then calculated for all pairs of ICs for control and patient groups separately. Statistically significant correlations from all possible pair-wise combinations were extracted by use of the Student t test for both groups,32 uncorrected for multiple comparisons because of the exploratory nature of the analysis.
Results
Subjects
Fifteen patients with FLE, with a mean age of 13.9 years (SD = 2.7), consisting of 8 female and 7 male subjects were recruited. The diagnosis of FLE was based on video electroencephalography, magnetoencephalography, and 18F-fluorodeoxyglucose PET scan. Eight patients had left FLE and 7 had right FLE. All patients had normal MR imaging at 3T. The mean age of seizure onset was 8.2 years (SD = 3.8), mean duration of epilepsy was 5.5 years (SD = 3.1), mean seizure frequency was 12.3 per week (SD = 15.7), and mean number of antiepileptic medications was 2.3 (SD = 0.6). Fourteen healthy control subjects were recruited, with a mean age of 14.7 years (SD = 2.7), consisting of 7 female and 7 male subjects. There was no significant difference between the age of the patients and control subjects (P > .05).
RSNs in Control Subjects and Patients
There were no group differences between rotational (P = .6213) and translational (P = .4731) motion. We identified 25 ICs as resting-state components, which correlated with the T-maps of RSNs reported by Allen et al28 (correlation ranging from 0.4–0.77). The frontal network was captured by 3 components (ICs 28, 40, and 46), including the bilateral middle frontal gyri and bilateral inferior frontal gyri. Components 4, 36, 50, and 75 represent DMN with activation in the areas of bilateral anterior cingulate gyri, bilateral middle frontal gyri, bilateral precuneus, and bilateral posterior cingulate gyri. The activation of the attention network was captured in 5 ICs (33, 35, 48, 59, and 65) located at bilateral insula, bilateral precuneus, bilateral superior parietal lobule, bilateral middle frontal gyri, right inferior parietal lobule, and right superior temporal gyrus. Six components (ICs 8, 12, 14, 42, 43, and 60) were classified as sensorimotor network with activation patterns in bilateral precentral gyri, bilateral postcentral gyri, bilateral inferior parietal lobule, bilateral paracentral lobule, and bilateral midcingulate. The auditory network was represented by a single component (IC 62) with activation focused in bilateral superior temporal gyri. Finally, the visual network was captured by 6 ICs (20, 41, 47, 52, 56, and 63) situated in bilateral inferior temporal gyri, bilateral calcarine, bilateral lingual, bilateral fusiform gyri, and left cuneus. The spatial maps of the 6 RSNs are shown in Fig 1. The identified RSNs were similar to those described by previous studies that used high model order.25,26,28
Fig 1.
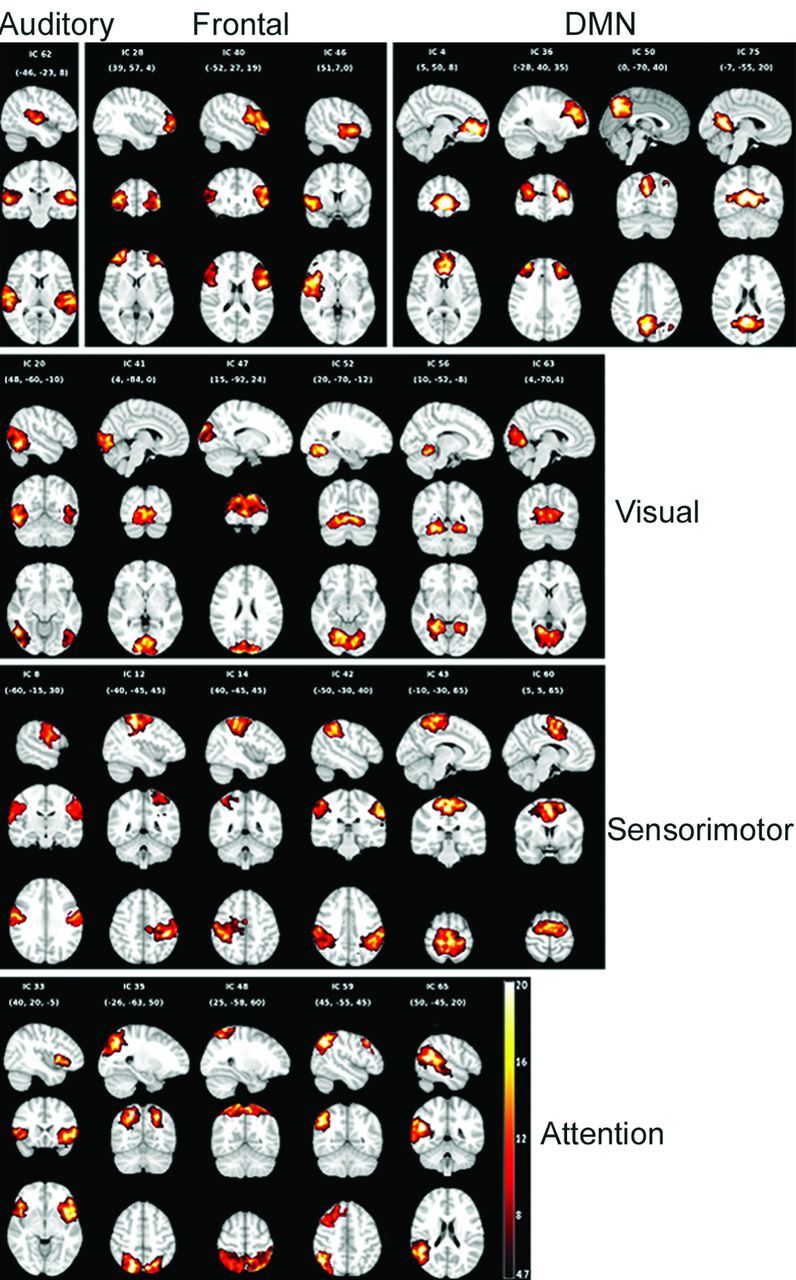
Spatial maps of the components identified as resting-state networks. Spatial maps are plotted as T-maps and overlaid on Montreal Neurological Institute 152 template. Top row (from left to right) shows the auditory, frontal, and default mode networks. Second, third, and fourth rows represent the visual, sensorimotor, and attention networks.
Group Comparison of Functional Connectivity within RSN
A summary of regions showing group differences in spatial maps is presented in Fig 2. The frontal network was the only network that showed only reduced connectivity. The remaining 5 networks demonstrated both reduced and also increased functional connectivity within the RSNs. Within the frontal network, there was reduced connectivity in the right superior frontal gyrus in patients with FLE relative to control subjects. The DMN showed reduced connectivity in the right anterior cingulate, left medial superior frontal, and right superior frontal gyri in patients with FLE and increased connectivity in the left inferior parietal lobule. Within the attention network, there was decreased connectivity in the right precuneus, right operculum, and right superior frontal gyrus and increased connectivity in the left inferior parietal, right inferior frontal, and right superior temporal gyri in patients with FLE. The sensorimotor network demonstrated reduced connectivity in the right and left precentral, left insula, right paracentral lobule, right and left midcingulate, and right supplementary motor cortex in patients with FLE relative to control subjects and a single cluster of increased connectivity in the right postcentral gyrus. The auditory network showed reduced connectivity in the right superior temporal gyrus and increased connectivity in the left superior temporal gyrus in patients relative to control subjects. Finally, the visual network had decreased connectivity in the right parahippocampal and right fusiform gyri and increased connectivity in the right calcarine and right lingual cortex in patients.
Fig 2.

Regions showing group differences in spatial maps for the sensorimotor, attention, and default mode networks, and frontal, auditory, and visual networks.
Relation Between RSNs and Neuropsychological Function and Clinical Seizure Parameters
Patients performed worse than control subjects on executive function (P = .004), attention (P = .011), and fine motor function (P = .002). There was a weak relation between reduced connectivity in the right superior frontal gyrus of frontal network and impaired executive function (t = 2.361, P = .029). There was no significant association between regions of abnormal connectivity in DMN or attention networks with attention. Reduced connectivity in the right paracentral lobule of sensorimotor network was significantly associated with impaired fine motor function (t = 3.236, P = .004).
Within the attention network, increased connectivity of right superior temporal gyrus was negatively associated with age at seizure onset (β = −0.226, t = −3.21, P = .009). Within the auditory network, reduced connectivity of right superior temporal gyrus was positively associated with age at seizure onset (β = 0.209, t = 3.291, P = .008). There was no relation between significant clusters in attention and auditory networks and duration of epilepsy. There was no relation between z scores of significant clusters in the frontal, DMN, sensorimotor, and visual networks with age at seizure onset or duration of epilepsy.
Functional Network Connectivity
Within the control group, there were 79 pair-wise ICs that showed significant temporal coherence, involving the following pairs of RSNs: frontal-attention, frontal-DMN, frontal-visual, frontal-sensorimotor, frontal-auditory, DMN-sensorimotor, DMN-attention, DMN-visual, attention-sensorimotor, attention-auditory, attention-visual, sensorimotor-visual, sensorimotor-auditory, and visual-auditory (On-line Table). The only pair of RSNs that did not demonstrate significant FNC in the control group was the DMN-auditory networks. Within the patient group, there were 66 pairs of ICs that showed significant temporal coherence across of all the 6 combinations of RSNs.
Group comparison of pair-wise ICs showed reduced FNC between DMN-attention (IC4-IC65), frontal-sensorimotor (IC46-IC12), and frontal-visual (IC46-IC52) and increased FNC between frontal-attention (IC40-IC65), DMN-somatosensory (IC50-IC60), and frontal-visual (IC40-IC63) (Fig 3) in patients relative to control subjects. There were no significant changes in FNC between frontal-DMN, frontal-auditory, DMN-visual, DMN-auditory, attention-sensorimotor, attention-visual, attention-auditory, sensorimotor-visual, sensorimotor-auditory, and visual-auditory.
Fig 3.
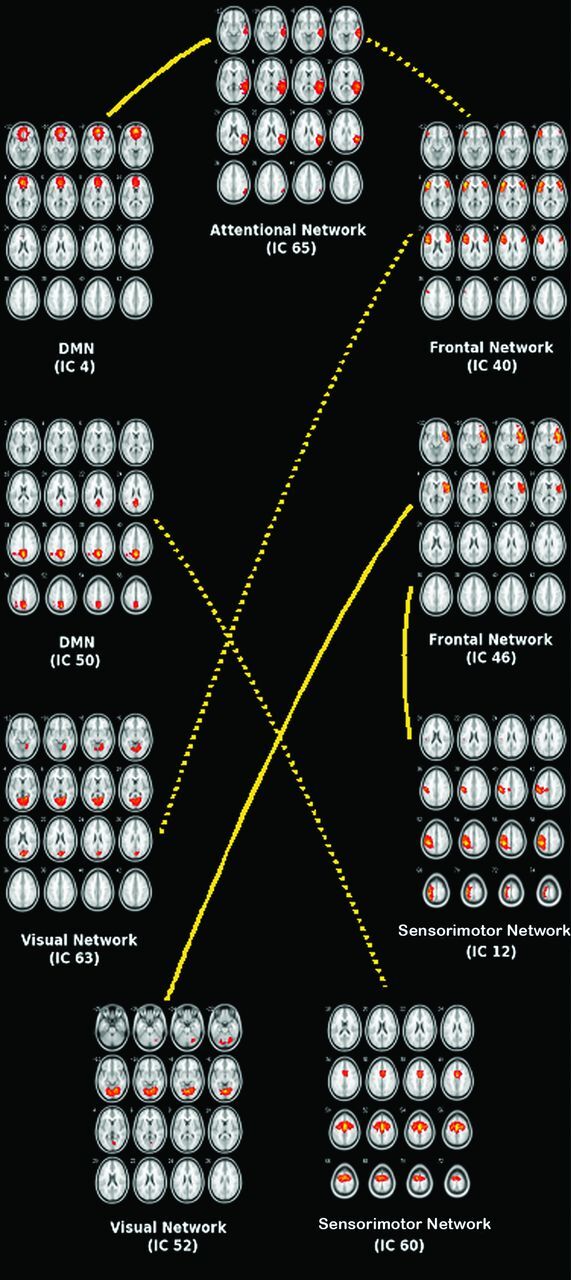
Functional network connectivity between resting-state networks. Group comparison of pair-wise independent components shows reduced FNC (solid line) between DMN-attention (IC4-IC65), frontal-sensorimotor (IC46-IC12), and frontal-visual (IC46-IC52) networks in patients and increased FNC (dotted line) between frontal-attention (IC40-IC65), DMN-sensorimotor (IC50-IC60), and frontal-visual (IC40-IC63) networks in patients relative to control subjects.
Discussion
We found reduced functional connectivity in the frontal network and both reduced and increased connectivity in DMN, attention, sensorimotor, auditory, and visual RSNs in patients with FLE relative to control subjects. Reduced functional connectivity was thought to reflect dysfunction of the network, and increased functional connectivity has been interpreted as a compensatory mechanism or reorganization of the network.33 Dysfunction of RSNs may be related to spread of seizures or may be caused by underlying abnormal brain development that predisposed to epilepsy. As shown in FNC analysis, these networks are functionally connected, and dysfunction in one network may lead to dysfunction in the other networks. We have also found fewer pair-wise ICs across the networks in patients relative to control subjects, and 6 of these pairs of ICs showed abnormal FNC.
Our findings of reduced and increased functional connectivity in the RSNs were similar to prior studies on adults with epilepsy. In patients with generalized tonic-clonic seizures, both decreased and increased functional connectivity in the DMN and dorsal attention networks have been identified.11 In patients with left mesial TLE, there was a trend for decreased connectivity of the left anterior and posterior hippocampi link and a trend for increased connectivity of the right anterior and posterior hippocampi link.33 In another study of adults with mesial TLE, 8 regions of reduced connectivity and 1 area of increased connectivity were found in the attention network.12 More recently, Luo et al34 found both reduced and increased functional connectivity in 16 patients with a variety of partial epilepsies.
Executive function,35,36 attention,37,38 and motor coordination39 have previously been shown to be impaired in children with FLE. We have found an association between decreased connectivity in the RSNs and impaired neuropsychological function. There was a weak association between connectivity in the right superior frontal gyrus of the frontal network and executive function and a significant association between connectivity in the right paracentral lobule of sensorimotor network and fine motor function. Vaessen et al18 also found that higher modularity scores on resting-state fMRI were associated with decreased cognitive performance, as measured by increased computerized visual searching task reaction time. These findings suggest that impaired functional networks may be part of the neural underpinning for neuropsychological impairment. The lack of significant association between connectivity in DMN and attention networks with attention in our study was not clear. Zhang et al12 found a negative correlation between Trail-Making test (part B) scores and z scores in dorsal attention networks in adults with mesial TLE. Rocca et al40 found significant correlations between left medial prefrontal and anterior cingulate DMN resting-state activity with the Paced Auditory Serial Attention Test but not with the Trail-Making test. Failure to detect an association between resting-state DMN or attention networks and attention have numerous causes. We obtained the composite scores for 2 components of Trail-Making test (part A and B) for the purpose of data reduction. It is possible that impaired connectivity within the DMN or attention networks may have a greater association with a certain attention task, or the sample size in our study may be inadequate to detect the association.
We found a negative association between increased functional connectivity in the right superior temporal gyrus of the attention network with age at seizure onset and a positive association between reduced connectivity in right superior temporal gyrus of the auditory network with age at seizure onset. The data suggest that earlier age at seizure onset is associated with greater reduction in functional connectivity in some RSNs and greater compensatory increase in functional connectivity in other RSNs. However, it is not clear why some networks (attention and auditory networks) showed a significant association with age at seizure onset, whereas others did not (frontal, DMN, sensorimotor, and visual networks). It could be that the association is weaker with some networks, and a larger sample size is required to demonstrate the smaller association. In contrast, in the adult epilepsy literature, an association between functional connectivity has been reported with duration of epilepsy rather than age at seizure onset.11,15 We have not found an association between functional connectivity and duration of epilepsy. It could be that the maturing brain in children is more vulnerable to disruption in functional connectivity, and this disruption occurs relatively early on in the disease. Alternatively, there is pre-existing disruption in functional connectivity related to subtle abnormal brain development not detected on structural MR imaging and hence the lack of association between functional connectivity and duration of epilepsy.
In our study, we found fewer FNCs in the FLE group than the control group, with 66 pair-wise ICs in patients relative to 79 pairwise ICs in control subjects. There was less FNC in patients, particularly those that involve the frontal network (frontal-attention, frontal-DMN, frontal-sensorimotor, frontal-auditory, and frontal-visual). Because the seizure focus is in the frontal lobe, spread of seizure activity may have led to fewer pair-wise IC correlations among those networks that were connected to the frontal network. Luo et al34 also found decreased FNC in patients with TLE (15 pair-wise RSNs) and mixed partial epilepsy (10 pair-wise RSNs) relative to control subjects (19 pair-wise RSNs). We found more pair-wise ICs for the DMN-attention and DMN-auditory networks in patients relative to control subjects and fewer pair-wise ICs for the DMN-sensorimotor and DMN-visual networks. Jafri et al32 found more pair-wise connectivity of the DMN with other networks in patients with schizophrenia, which was postulated to be due to greater dependency of brain regions in the DMN on the function of other neural circuits or vice versa during resting state. The greater number of pair-wise ICs for the DMN-attention and DMN-auditory networks in our study could be for the same reason. Vaessen et al18 evaluated the resting-state connectivity by use of graph theoretical metrics of whole-brain networks. They found that children with FLE have a decrease in long-range and an increase in interhemispheric connectivity, as well as higher modularity scores, suggesting the presence of more functionally isolated brain modules. The authors used a “global” approach to demonstrate a disruption of whole-brain networks. In contrast, we have used both a “local” approach of evaluating individual RSNs and a more “global” approach of assessing FNC. Despite differences in methodology, we arrived at the same conclusion that there is widespread disruption of brain networks in children with FLE.
Because of the small number of patients, we have not assessed differences in right and left FLE. Bettus et al33 evaluated adults with mesial TLE and found that patients with left mesial TLE showed disruption of the left external capsule–anterior hippocampus link and a trend of decreased connectivity of the left anterior hippocampus–posterior hippocampus link. On the other hand, patients with right mesial TLE showed a trend of increased connectivity of the right anterior hippocampus–posterior hippocampus link.
Conclusions
In summary, we found abnormal functional connectivity both within and across the RSNs in children with FLE, further supporting the concept that epilepsy is a disorder affecting neural networks. Impaired connectivity in the RSNs was associated with impaired neuropsychological function, which suggests that RSNs may be part of the neural underpinning of cognition. We have found not only reduced but also elevated functional connectivity within RSNs and also FNC across the RSNs, which suggests that brain plasticity may play in role in the reorganization of the neural networks.
Supplementary Material
ABBREVIATIONS:
- FLE
frontal lobe epilepsy
- IC
independent component
- ICA
independent component analysis
- DMN
default mode network
- RSN
resting-state network
- TLE
temporal lobe epilepsy
- FNC
functional network connectivity
- DKEFS
Delis-Kaplan Executive Function System
Footnotes
Disclosures: Elysa Widjaja—RELATED: Grant: GE-AUR award and Derek Harwood Nash chair*; UNRELATED: Grants/Grants Pending: Sickkids Foundation/CIHR Institute of Human Development, Child and Youth Health* (*money paid to institution).
This work was supported by a GE-AUR award and the Derek Harwood Nash chair.
REFERENCES
- 1. Fox MD, Snyder AZ, Vincent JL, et al. The human brain is intrinsically organized into dynamic, anticorrelated functional networks. Proc Natl Acad Sci U S A 2005;102:9673–78 [DOI] [PMC free article] [PubMed] [Google Scholar]
- 2. Fox MD, Raichle ME. Spontaneous fluctuations in brain activity observed with functional magnetic resonance imaging. Nat Rev Neurosci 2007;8:700–11 [DOI] [PubMed] [Google Scholar]
- 3. Fox MD, Corbetta M, Snyder AZ, et al. Spontaneous neuronal activity distinguishes human dorsal and ventral attention systems. Proc Natl Acad Sci U S A 2006;103:10046–51 [DOI] [PMC free article] [PubMed] [Google Scholar]
- 4. Mantini D, Perrucci MG, Del Gratta C, et al. Electrophysiological signatures of resting state networks in the human brain. Proc Natl Acad Sci U S A 2007;104:13170–75 [DOI] [PMC free article] [PubMed] [Google Scholar]
- 5. Calhoun VD, Adali T, Pearlson GD, et al. Spatial and temporal independent component analysis of functional MRI data containing a pair of task-related waveforms. Hum Brain Mapp 2001;13:43–53 [DOI] [PMC free article] [PubMed] [Google Scholar]
- 6. Esposito F, Scarabino T, Hyvarinen A, et al. Independent component analysis of fMRI group studies by self-organizing clustering. Neuroimage 2005;25:193–205 [DOI] [PubMed] [Google Scholar]
- 7. McKeown MJ, Sejnowski TJ. Independent component analysis of fMRI data: examining the assumptions. Hum Brain Mapp 1998;6:368–72 [DOI] [PMC free article] [PubMed] [Google Scholar]
- 8. Calhoun VD, Adali T. Unmixing fMRI with independent component analysis. IEEE Eng Med Biol Mag 2006;25:79–90 [DOI] [PubMed] [Google Scholar]
- 9. Turner GH, Twieg DB. Study of temporal stationarity and spatial consistency of fMRI noise using independent component analysis. IEEE Trans Med Imaging 2005;24:712–18 [DOI] [PubMed] [Google Scholar]
- 10. Spencer SS. Neural networks in human epilepsy: evidence of and implications for treatment. Epilepsia 2002;43:219–27 [DOI] [PubMed] [Google Scholar]
- 11. Wang Z, Lu G, Zhang Z, et al. Altered resting state networks in epileptic patients with generalized tonic-clonic seizures. Brain Res 2010;1374:134–41 [DOI] [PubMed] [Google Scholar]
- 12. Zhang Z, Lu G, Zhong Y, et al. Impaired attention network in temporal lobe epilepsy: a resting fMRI study. Neurosci Lett 2009;458:97–101 [DOI] [PubMed] [Google Scholar]
- 13. Luo C, Li Q, Lai Y, et al. Altered functional connectivity in default mode network in absence epilepsy: a resting-state fMRI study. Hum Brain Mapp 2011;32:438–49 [DOI] [PMC free article] [PubMed] [Google Scholar]
- 14. Liao W, Zhang Z, Pan Z, et al. Default mode network abnormalities in mesial temporal lobe epilepsy: a study combining fMRI and DTI. Hum Brain Mapp 2010;32:883–95 [DOI] [PMC free article] [PubMed] [Google Scholar]
- 15. Zhang Z, Lu G, Zhong Y, et al. Impaired perceptual networks in temporal lobe epilepsy revealed by resting fMRI. J Neurol 2009;256:1705–13 [DOI] [PubMed] [Google Scholar]
- 16. Waites AB, Briellmann RS, Saling MM, et al. Functional connectivity networks are disrupted in left temporal lobe epilepsy. Ann Neurol 2006;59:335–43 [DOI] [PubMed] [Google Scholar]
- 17. Mankinen K, Jalovaara P, Paakki JJ, et al. Connectivity disruptions in resting-state functional brain networks in children with temporal lobe epilepsy. Epilepsy Res 2012;100:168–78 [DOI] [PubMed] [Google Scholar]
- 18. Vaessen MJ, Braakman HM, Heerink JS, et al. Abnormal modular organization of functional networks in cognitively impaired children with frontal lobe epilepsy. Cereb Cortex 2013;23:1997–2006 [DOI] [PubMed] [Google Scholar]
- 19. Lawson JA, Cook MJ, Vogrin S, et al. Clinical, EEG, and quantitative MRI differences in pediatric frontal and temporal lobe epilepsy. Neurology 2002;58:723–29 [DOI] [PubMed] [Google Scholar]
- 20. Hu Y, Jiang L, Yang Z. Video-EEG monitoring differences in children with frontal and temporal onset seizures. Int J Neurosci 2012;122:92–101 [DOI] [PubMed] [Google Scholar]
- 21. Cox RW. AFNI: software for analysis and visualization of functional magnetic resonance neuroimages. Comput Biomed Res 1996;29:162–73 [DOI] [PubMed] [Google Scholar]
- 22. Smith SM, Jenkinson M, Woolrich MW, et al. Advances in functional and structural MR image analysis and implementation as FSL. Neuroimage 2004;23(Suppl 1):S208–19 [DOI] [PubMed] [Google Scholar]
- 23. Celone KA, Calhoun VD, Dickerson BC, et al. Alterations in memory networks in mild cognitive impairment and Alzheimer's disease: an independent component analysis. J Neurosci 2006;26:10222–31 [DOI] [PMC free article] [PubMed] [Google Scholar]
- 24. Calhoun VD, Adali T, Pearlson GD, et al. A method for making group inferences from functional MRI data using independent component analysis. Hum Brain Mapp 2001;14:140–51 [DOI] [PMC free article] [PubMed] [Google Scholar]
- 25. Kiviniemi V, Starck T, Remes J, et al. Functional segmentation of the brain cortex using high model order group PICA. Hum Brain Mapp 2009;30:3865–86 [DOI] [PMC free article] [PubMed] [Google Scholar]
- 26. Abou-Elseoud A, Starck T, Remes J, et al. The effect of model order selection in group PICA. Hum Brain Mapp 2010;31:1207–16 [DOI] [PMC free article] [PubMed] [Google Scholar]
- 27. Ystad M, Eichele T, Lundervold AJ, et al. Subcortical functional connectivity and verbal episodic memory in healthy elderly: a resting state fMRI study. Neuroimage 2010;52:379–88 [DOI] [PubMed] [Google Scholar]
- 28. Allen EA, Erhardt EB, Damaraju E, et al. A baseline for the multivariate comparison of resting-state networks. Front Syst Neurosci 2011;5:2. [DOI] [PMC free article] [PubMed] [Google Scholar]
- 29. Greicius MD, Kiviniemi V, Tervonen O, et al. Persistent default-mode network connectivity during light sedation. Hum Brain Mapp 2008;29:839–47 [DOI] [PMC free article] [PubMed] [Google Scholar]
- 30. Greicius MD, Flores BH, Menon V, et al. Resting-state functional connectivity in major depression: abnormally increased contributions from subgenual cingulate cortex and thalamus. Biol Psychiatry 2007;62:429–37 [DOI] [PMC free article] [PubMed] [Google Scholar]
- 31. Calhoun VD, Kiehl KA, Liddle PF, et al. Aberrant localization of synchronous hemodynamic activity in auditory cortex reliably characterizes schizophrenia. Biol Psychiatry 2004;55:842–49 [DOI] [PMC free article] [PubMed] [Google Scholar]
- 32. Jafri MJ, Pearlson GD, Stevens M, et al. A method for functional network connectivity among spatially independent resting-state components in schizophrenia. Neuroimage 2008;39:1666–81 [DOI] [PMC free article] [PubMed] [Google Scholar]
- 33. Bettus G, Guedj E, Joyeux F, et al. Decreased basal fMRI functional connectivity in epileptogenic networks and contralateral compensatory mechanisms. Hum Brain Mapp 2009;30:1580–91 [DOI] [PMC free article] [PubMed] [Google Scholar]
- 34. Luo C, Qiu C, Guo Z, et al. Disrupted functional brain connectivity in partial epilepsy: a resting-state fMRI study. PLoS One 2011;7:e28196. [DOI] [PMC free article] [PubMed] [Google Scholar]
- 35. Riva D, Avanzini G, Franceschetti S, et al. Unilateral frontal lobe epilepsy affects executive functions in children. Neurol Sci 2005;26:263–70 [DOI] [PubMed] [Google Scholar]
- 36. Culhane-Shelburne K, Chapieski L, Hiscock M, et al. Executive functions in children with frontal and temporal lobe epilepsy. J Int Neuropsychol Soc 2002;8:623–32 [DOI] [PubMed] [Google Scholar]
- 37. Braakman HM, Vaessen MJ, Hofman PA, et al. Cognitive and behavioral complications of frontal lobe epilepsy in children: a review of the literature. Epilepsia 2011;52:849–56 [DOI] [PubMed] [Google Scholar]
- 38. Prevost J, Lortie A, Nguyen D, et al. Nonlesional frontal lobe epilepsy (FLE) of childhood: clinical presentation, response to treatment and comorbidity. Epilepsia 2006;47:2198–201 [DOI] [PubMed] [Google Scholar]
- 39. Hernandez MT, Sauerwein HC, Jambaque I, et al. Deficits in executive functions and motor coordination in children with frontal lobe epilepsy. Neuropsychologia 2002;40:384–400 [DOI] [PubMed] [Google Scholar]
- 40. Rocca MA, Valsasina P, Absinta M, et al. Default-mode network dysfunction and cognitive impairment in progressive MS. Neurology 2010;74:1252–59 [DOI] [PubMed] [Google Scholar]
Associated Data
This section collects any data citations, data availability statements, or supplementary materials included in this article.