

Abstract
HIV infection is a major risk factor predisposing for Mycobacterium tuberculosis infection and progression to active tuberculosis (TB). As host immune response defines the course of infection, we aimed to identify immuno-endocrine changes over six-months of anti-TB chemotherapy in HIV+ people. Plasma levels of Cortisol, DHEA and DHEA-S, percentages of CD4+ regulatory T cell subsets and number of IFN-γ-secreting cells were determined. Several cytokines, chemokines and C-reactive protein levels were measured. Results were correlated with clinical parameters as predictors of infection resolution and compared to similar data from HIV+ individuals, HIV-infected persons with latent TB infection and healthy donors. Throughout the course of anti-TB/HIV treatment, DHEA and DHEA-S plasma levels raised while cortisol diminished, which correlated to predictive factors of infection resolution. Furthermore, the balance between cortisol and DHEA, together with clinical assessment, may be considered as an indicator of clinical outcome after anti-TB treatment in HIV+ individuals. Clinical improvement was associated with reduced frequency of unconventional Tregs, increment in IFN-γ-secreting cells, diminution of systemic inflammation and changes of circulating cytokines and chemokines. This study suggests that the combined anti-HIV/TB therapies result in partial restoration of both, immune function and adrenal hormone plasma levels.
Keywords: Adrenal hormones, HIV-TB coinfection, Regulatory T cells, Prospective study, Cytokines, Tuberculosis
1. Introduction
Mycobacterium tuberculosis (Mtb) is the causative agent of tuberculosis (TB), an infectious disease that constitutes the leading cause of death from a single infectious agent, ranking above HIV/AIDS [1]. The probability of developing TB in a person coinfected with the human immunodeficiency virus (HIV) is 19 times greater than in the general population [1]. Anti-tuberculous (anti-TB) treatment in people coinfected with HIV and Mtb (HIV-TB) is challenging due an altered clinical presentation and worst outcomes compared to TB monoinfection [2,3]. Increase knowledge about the factors that result in TB disease progression or resolution of infection would lead to shortening therapy times and improving patientś standard of living, particularly those immunocompromised such as HIV+ individuals.
Evidence indicates that both immune and endocrine responses are involved in TB physiopathogenesis [4–6]. In the context of chronic infections, the levels of pro-inflammatory cytokines that mediate the innate immune response are altered [7]. Among these cytokines, TNF-α, IL-1β and IL-6 constitute the main path to activate the hypothalamic-pituitary-adrenal (HPA) axis, which leads to the secretion of adrenal hormones: cortisol and dehydroepiandrosterone (DHEA) [8]. The increase in cortisol concentration during the acute phase is associated with anti-inflammatory effects that protect the individual from a pathologic disease, but in the chronic state it also benefits the replication of the pathogen [9,10]. Conversely, DHEA would promote Th1 responses that control TB infection by increasing the production of IL-2 and IFN-γ and inhibiting cytokines associated with a Th2 response, such as IL-4 and IL-5 [11,12].
We have studied the effect of DHEA on the immune response against Mtb in the context of HIV-TB coinfection. In previous reports, we described that DHEA enhanced Th1 and cytotoxic CD8+ phenotype T cell responses [13] and downregulated the expression of the transcription factor FoxP3 [14]. Likewise, we observed DHEA increase in the ability to generate specific responses against Mtb promoted by dendritic cells [15] and raised Th1 phenotype over regulatory populations in PBMCs from HIV-TB individuals stimulated with Mtb [16]. The development of an adequate (Th1) immune response is associated with TB infection control.
Changes in immune-endocrine profiles during anti-TB treatment in HIV-negative individuals have been previously analyzed. It was reported that adrenal hormone levels were modified as a result of active TB and might be related to anti-TB treatment outcomes [5]. Newly diagnosed patients presented a high cortisol/DHEA ratio, which positively correlated with inflammatory mediators [4], while the levels of DHEA and cortisol were normalized after specific therapy [4,17]. Therefore, we aimed to study several immunological and hormonal parameters over a six-month follow-up of anti-TB treatment in HIV+ individuals in order to identify parameters that correlate with treatment success.
2. Methods
2.1. Participants enrollment
The present study has a prospective design with following study population (Table 1): 1) HIV-1-positive individuals with active TB (HIV-TB) who had never received anti-tuberculosis (anti-TB) therapy or had been on treatment for less than one week, 2) chronically HIV-infected individuals (HIV) who had tested negative for tuberculin skin test (TST), 3) HIV-1-positive individuals with latent TB (HIV-LTB) who were TST positive and 4) healthy donors (HD) TST negative. HIV and TB diagnosis was determined following current guidelines. Within the cohort of HIV-TB people, 17 patients were diagnosed with extrapulmonary TB, based on clinical, microbiological, radiological and histopathological information. Extrapulmonary TB involved organs other than the lungs (e.g., pleura, lymph nodes, genitourinary tract, and so on) [1]. Among the recruited patients, eight individuals displayed lymph node infection, one had meningitis, three cases presented miliary TB, one person exhibited tuberculous pericarditis, and 4 patients displayed pleural TB. Some HIV-infected individuals were not on highly active antiretroviral therapy (HAART) before the initiation of the study, but all these individuals were started on HAART [18]. HIV-TB individuals were followed for up to six months of anti-HIV/TB therapy, following the current treatment guidelines in Argentina [19]. Blood samples from HIV-TB patients were collected at the time of TB diagnosis (Visit 1 or V1) and approximately three (V2) and six (V3) months after anti-HIV/TB treatment initiation. Some patients abandoned the study before completing six months of anti-TB therapy. None of the participants presented immune reconstitution inflammatory syndrome (IRIS), associated infections, autoimmune or endocrine disorders or received steroids administration. All participants had previously received the Bacillus Calmette Guerin (BCG) vaccine, and were evaluated at Hospital J. A. Fernandez, while blood samples from HD were provided by the Hemotherapy Division of Sanatorio “Dr. Julio Mendez”, both in Buenos Aires, Argentina.
Table 1.
Epidemiological characteristics of the study population.
| HIV-TB (V1) | HIV-TB (V2) | HIV-TB (V3) | HIV | HIV-LTB | HD | |
|---|---|---|---|---|---|---|
| Number of subjects enrolled (n) | 47 | 45 | 39 | 34 | 11 | 28 |
| Median age in years (IQR) | 35 (29–43) | 35 (31–41) | 36 (31–43) | 34 (28–46) | 38 (34–42) | 36 (31.5–45) |
| Female/Male distribution | 11/36 | 11/34 | 10/29 | 8/26 | 4/7 | 12/16 |
IQR, Interquartile range
2.2. Hormone assessment
EDTA-anticoagulated blood samples were drawn between 8:00 and 8:30 a.m. After centrifugation, plasma aliquots were preserved at −80°C. Cortisol was measured by electrochemiluminescence (Cobas e411 autoanalyzer, Roche Diagnostics GmbH, Germany), DHEA by radioimmunoassay (IMMUNOTECH S.A. Marseille Cedex 9, France) and DHEA-S by immunochemoluminiscence (IMMULITE® 1000, Siemens Healthcare Diagnostics, USA) tests. All hormone determinations were performed using the same blood samples aliquots.
2.3. Antigen
In vitro stimulation of PBMC was performed with pre-titrated heat-killed M. tuberculosis (Mtb) H37Rv (NR-14819, BEI Resources, NIAID, NIH) at 10 μg/ml final concentration for all the experiments. The concentration was determined by titration using peripheral blood mononuclear cells (PBMCs) from healthy volunteers stimulated in vitro.
2.4. ELISPOT assays
IFN-γ-secreting cells were detected using enzyme-linked immunospot (ELISPOT) assay conducted as described previously [14]. Heat-killed Mtb strain H37Rv was added in duplicate wells (10 μg/ml). Negative (culture medium with 0.05% DMSO) and positive (culture medium with PMA 5 ng/ml and Ionomicin, 500 ng/ml, both from Sigma-Aldrich) controls were included. Plates were scanned on an ImmunoSpot reader (Cellular Technology Ltd.). Specific spots were counted using the ImmunoSpot software. Results were expressed as spot forming units (SFU)/106 PBMC after subtraction of the negative-control values.
2.5. Flow cytometry
PBMCs (1×10⁶) were stained with CD4 PerCP, CD25 Alexa488, FoxP3 PE for the identification of “conventional” regulatory CD4+ T cells (Tregs, CD25+FoxP3+) and “unconventional” regulatory CD4+ T cells (uTregs, CD25-FoxP3+) [20]. BD FoxP3 staining protocol was performed according to the manufacturer instructions. Sample acquisition and analysis were carried out on a FACSCanto flow cytometer using the BD FACSDiva software (BD Biosciences). Negative control samples were incubated with irrelevant isotype-matched mAbs in parallel with experimental samples.
2.6. Cytokines and C-reactive protein assessment.
Simultaneous determination of several cytokines and chemokines was performed using a multiplex assay (Bio-Plex Pro Human Cytokine Group I 17-Plex Assay, Bio Rad), following manufacturer instructions and analyzed using the Bio-Plex system 200. Cytokine concentration was assessed as mean fluorescence intensity (MFI) and converted to pg/ml based on standardized MFI values. Radial immunodiffusion assay was used to quantify C-reactive protein, following the manufacturer instructions (DIFFU-PLATE®, Biocientífica S.A.).
2.7. Statistical analysis
Statistical analysis was performed using non-parametric Wilcoxon matched pair test and Kruskall-Wallis analysis of variance for multi-group comparisons. Correlations were determined using Spearman’s rank test. Receiver operating characteristic (ROC) analysis was performed to evaluate diagnostic markers. Analyses were achieved using Prism v8 software (GraphPad Software Inc., USA). p value <0.05 was considered statistically significant.
3. Results
3.1. Anti-tuberculosis treatment impacts on the adrenal axis of HIV-TB coinfected patients.
Several preceding studies described alterations in adrenal hormones levels during either viral or bacterial infections [17,21]. We previously reported an imbalance on these hormones in anti-TB treatment-naive HIV-TB patients, showing alterations in plasma levels of DHEA, DHEA-S and cortisol [14,22]. The increased cortisol/DHEA ratio might lead to disease progression by inducing a shift from Th1 to an impaired immune response [14]. Hence, we aimed to study several immunological and hormonal parameters over a six-month follow-up of anti-TB therapy in HAART-treated HIV+ individuals. Additionally, we recruited HIV-chronically infected and HIV-LTB individuals and HD to compare the results obtained. The characteristics of the participant individuals are depicted in Table 1.
In this study, HIV-TB patients were followed during 3 successive visits (V1, V2 and V3) along anti-TB treatment. HIV-TB individuals at V1 exhibited the higher immunosuppression levels and viral loads compared to the other cohorts. These data agree with a previous report where it was demonstrated an enhanced transcriptional activity of HIV-1 is in HIV-infected patients with active TB [23]. However, six months after the onset of TB treatment and HAART, patients controled viral replication and recovered CD4+ T cell counts and CD4/CD8 ratio at similar values to HIV-chronically infected individuals. There were no significant differences among the groups in age or sex distribution (Table 1 and Figure 1).
Figure 1. Clinical status of the study population.

Blood samples from HIV-TB patients were collected at the time of TB diagnosis (Visit 1 or V1) and approximately three (V2) and six (V3) months after TB treatment initiation. Additionally, samples from HIV, HIV-LTB and HD were collected. Plasma viral load, whole-blood CD4 T-cell counts and CD4/CD8 T cell ratio were measured. Data is presented as median with interquartile range (IQR). Each symbol represents an individual subject. Kruskal-Wallis test *p < 0.05, **p < 0.01, ***p < 0.005 and ***p < 0.001.
Plasma concentrations of DHEA-S, DHEA and cortisol (Figure 2 A) and the variation of cortisol/DHEA-S and cortisol/DHEA ratios (Figure 2 B) were compared throughout the course of TB treatment (V1, V2 and V3) in HIV-TB patients and were contrasted with plasma levels from HIV individuals, HIV-LTB group and HD. First, no significant differences were found in female/male distribution among the studied cohorts (chi-square test, p=0.25). DHEA-S and DHEA plasma levels raised significatively from V1 to V3, while cortisol concentration, cortisol/DHEA-S and cortisol/DHEA ratios diminished (Figure 2 A and B). No significant differences were observed between V2 and V3 or V1 and V2, except for cortisol/DHEA ratio (Figure 2 A and B).
Figure 2. Evaluation of adrenal hormone plasma concentrations in HIV-TB patients, mono-infected HIV+ individuals, latent TB HIV+ subjects and HD.

Blood samples from HIV-TB patients were collected at the time of TB diagnosis (Visit 1 or V1) and approximately three (V2) and six (V3) months after TB treatment initiation. Additionally, samples from HIV, HIV-LTB and HD were collected. (A) Comparison of plasma levels of DHEA-S, DHEA and cortisol among the recruited groups. (B) Cortisol/DHEA-S and cortisol/DHEA ratios in HIV-TB, HIV, HIV-LTB and HD. Data is presented as median with interquartile range (IQR). Each symbol represents an individual subject. Kruskal-Wallis test *p < 0.05, **p < 0.01, ***p < 0.005 and ***p < 0.001.
While contrasting HIV-TB patients at V1 with the other groups, the lowest levels of DHEA-S and DHEA were observed, although there was no difference in DHEA concentration compared to HD (Figure 2 A). HIV+ patients exhibited the higher cortisol plasma levels compared to HIV-TB at V2 and V3 and HD, while V1 did not differ significatively from other cohorts (Figure 2 A). Regarding cortisol/DHEA-S and cortisol/DHEA balance, V1 was found to exhibit the highest ratios compared to the other study groups. Furthermore, these ratios significantly decreased after completion of anti-TB treatment in HIV-TB patients (Figure 2 B). There were no differences between V3 and HIV-monoinfected individuals (with the exception of cortisol levels), HIV-TBL cohort and HD in the plasma levels of the hormones analyzed (Figure 2 B), suggesting a restoration of adrenal axis function.
3.2. Alteration of the specific M. tuberculosis immune response and the frequency of regulatory CD4+ T cells over a six-month follow-up of anti-TB treatment in HIV+ individuals
An effective response to Mtb is mainly associated with a Th1 profile, with IFN-γ as the central cytokine [24]. Based on our previous studies describing Th1 responses in HIV-TB untreated patients [14], a new cohort prospectively along the anti-tuberculosis treatment was analyzed. Samples corresponding to the initiation of treatment showed significantly lower numbers of IFN-γ producing Mtb-specific cells compared to those examined in subsequent visits (V2 and V3) (Figure 3 A). Moreover, no differences among the Mtb-T cell specific IFN-γ response by HD and HIV-TB cohort at V2 and V3 were observed (Figure 3 A). There were no differences between V1 and HIV+ individuals, suggesting an impaired immune response to Mtb in untreated HIV-TB patients. The data shown herein suggest that the level of Mtb-specific response in the HIV-TB group would be modulated by anti-TB treatment, significantly increasing the response along therapy.
Figure 3. Modulation of M. tuberculosis-induced IFN-γ production and the frequency of regulatory CD4+ T cell subsets throughout the course of tuberculosis treatment and among HIV-TB patients, mono-infected HIV+ individuals, latent TB HIV+ subjects and HD.

Blood samples from HIV-TB patients were collected at the time of TB diagnosis (Visit 1 or V1) and approximately three (V2) and six (V3) months after TB treatment initiation. Additionally, samples from HIV, HIV-LTB and HD were collected. (A) Absolute numbers of IFN-γ producer cells from PBMC of the recruited cohorts, previously stimulated with M. tuberculosis. Results were expressed as spot forming units (SFU)/106 PBMC, after subtraction of the negative-control values. (B) Analysis of Tregs and uTregs populations across the spectrum of TB infection. Data is presented as median with interquartile range (IQR). Each symbol represents an individual subject. Kruskal-Wallis test *p < 0.05, **p < 0.01, ***p < 0.005 and ***p < 0.001.
Concerning regulatory CD4+ T cell subsets, as our research group reported [20], unconventional Tregs (uTregs, CD4+CD25-FoxP3+) were expanded in HIV-TB patients, while there were no differences in the frequency of Tregs (Figure 3 B). uTregs are a unique population that exerts regulatory functions despite an altered surface expression of characteristic markers and differences in cytokine production from Tregs [20]. The proportion of uTregs diminished along anti-TB treatment in HIV-TB group, reaching at V3 similar levels to those observed in HIV+ individuals. However, there were significant differences among V3 vs. HIV-LTB and V3 vs. HD regarding uTregs, with V3 showing higher proportions (Figure 3 B).
3.3. Adrenal hormone levels and immunological status are associated with clinical parameters in HIV-TB patients.
The levels of DHEA-S, DHEA and cortisol along with the immunological status (numbers of IFN-γ producing cells and percentage of Tregs and uTregs) of HIV-TB cohort were contrasted with clinical data: viral load, absolute and nadir CD4+ T cell counts, CD4/CD8 cell ratio, individuals on HAART or anti-TB treatment and result of acid-fast bacilli (AFB) smears (Figure 4). On the one hand, no significant differences were observed among the variables measured in the current report in relation to HIV-TB patients on HAART and/or anti-TB treatment at V1, or regarding the results of AFB smears (data not shown). On the other hand, higher viral load levels negatively correlated with absolute and nadir CD4+ T cells counts and CD4/CD8 ratio in V1, as expected (Figure 4 A). The association with CD4/CD8 ratio was maintained up to six months of treatment while CD4+ T cell number association was lost, probably due to a restoration of CD4+ levels and/or diminution of viral load (Figure 4 A, B and C). There was positive correlation among absolute and nadir CD4+ T cell counts and CD4/CD8 ratio in V1, V2 and V3, which are predictors of an improved disease outcome (Figure 4 A, B and C).
Figure 4. Heatmap representing the Spearman correlation matrix among adrenal hormones plasma levels, immunological status and clinical data from HIV-TB patients.

Correlation analysis among variables were performed for (A) V1, (B) V2 and (C) V3. Annotations on top and the side of the heatmap exhibit the parameters associated. Colored intersections indicate significant correlations (p<0.05) and values within the matrix exhibit Spearman’s rank correlation coefficient (r). Color scheme from green to red assesses the relationship between two variables and represents r values (from 1 to - 1).
Interestingly, at the time of diagnosis significant positive associations were observed among DHEA-S with absolute CD4+ T cell count and CD4/CD8 ratio, while no significant associations were found regarding plasma levels of DHEA. However, both DHEA-S and DHEA positively correlated with absolute CD4 at V3. At this stage, DHEA was also associated with CD4/CD8 ratio (Figure 4 A, B and C). Otherwise, cortisol levels negatively correlated with CD4/CD8 ratio at V1 (Figure 4 A). Furthermore, cortisol/DHEA-S ratio had negative associations with absolute and nadir CD4+ T cell counts and CD4/CD8 ratio at V1, V2 and V3 (Figure 4 A, B and C). Finally, cortisol/DHEA ratio negatively correlated with absolute CD4+ numbers and CD4/CD8 ratio at V3, although there were no significant associations at V1. (Figure 4 A and C).
Regarding the frequency of regulatory CD4+ T cell subsets, a greater proportion of Tregs was inversely correlated with viral load and cortisol/DHEA ratio but it presented a positive correlation with DHEA in untreated patients. These associations were lost at the end of TB treatment (Figure 4 A and C). Additionally, uTregs frequency was negatively correlated with CD4+ T cells count at V1 (Figure 4 A).
3.4. TB infection site is related to clinical parameters associated with prognosis in HIV and Mtb coinfected patients
A total of 47 HIV-TB patients were recruited in the study. After sample collection, 17 individuals were diagnosed with extrapulmonary TB. Therefore, we decided to compare the measured parameters regarding TB infection localization at the moment of diagnosis (V1) (Figure 5). Lower levels of viral load were observed in patients with pulmonary vs. extrapulmonary TB, concomitantly with increased absolute and nadir CD4+ T cell counts and CD4/CD8 ratio (Figure 5 A). Interestingly, a higher cortisol/DHEA-S ratio was associated with the development of disseminated infection instead of restricted pulmonary TB (Figure 5 B). There were no significant associations with neither the number of IFN-γ producer cells nor regulatory CD4+ T cell subsets and TB localization.
Figure 5. Association among localization of TB, clinical parameters, plasma levels of adrenal hormones and immune status in HIV-TB patients.

Clinal data (A), hormone plasma levels (B) and specific Mtb immune response and frequency of regulatory CD4+ T cells (C) were associated with patients diagnosed with pulmonary (P) or extrapulmonary (E) TB at V1. Each symbol represents an individual subject. Mann-Whitney U test, *p<0.05, **p<0.01 and ***p<0.005.
3.5. Effect of HIV-TB coinfection on cytokine, chemokine and colony-stimulating factor profiles
The balance among pro- and anti-inflammatory responses might define the course of the disease or resolution of the infection [25]. For that reason, plasma levels of several cytokines and chemokines were measured. In addition, C-reactive protein (CRP) was determined as a biomarker of systemic inflammation (Table 2).
Table 2.
Modification of plasma concentration of cytokines, chemokines and colony-stimulating factors in HIV-TB patients during anti-TB treatment.
| HIV-TB (V1) | HIV-TB (V2) | HIV-TB (V3) | HIV | HD | |
|---|---|---|---|---|---|
| n | 8 | 8 | 8 | 11 | 10 |
| CRP (mg/dl) | 0.85 (0.43–3.34) | 0.43 (0.18–1.27) | 0.43 * (0.10–0.43) | N/A | 0.13 * (0.12–0.14) |
| G-CSF (pg/ml) | 10.73 (6.88–12.18) | 7.84+ (5.92–13.64) | 6.88++ (4.02–8.800) | 13.30 (11.58–17.73) | 9.50 (7.27–17.40) |
| GM-CSF (pg/ml) | 4.42 (0.10–7.06) | 2.53 (0.10–3.15) | 1.06 (0.10–7.06) | 2.75 (1.67–4.70) | 3.10 (2.30–4.12) |
| IFN-γ (pg/ml) | 127.8++ ### (83.66–212.3) | 93.69++ ## (41.60–261.3) | 75.38++ ## (21.98–161.3) | 2.20 (1.67–5.60) | 2.05 (1.42–2.72) |
| IL-1β (pg/ml) | 0.79 (0.56–0.85) | 0.50 (0.29–0.79) | 0.45 (0.27–0.85) | 0.70 (0.40–0.80) | 0.50 (0.40–0.85) |
| IL-2 (pg/ml) | 0.03+# (0.03–0.44) | 0.03+# (0.03–0.83) | 0.03+++ ### (0.03–0.03) | 0.80 (0.50–1.20) | 0.80 (0.30–1.95) |
| IL-4 (pg/ml) | 1.15 (0.95–2.12) | 1.05 (0.48–2.10) | 0.85 (0.41–1.69) | 2.10 (0.92–4.85) | N/A |
| IL-5 (pg/ml) | 1.21++ ## (0.81–2.57) | 1.21+# (0.41–2.43) | 0.95+# (0.68–2.30) | 0.20 (0.20–0.55) | 0.20 (0.20–0.52) |
| IL-6 (pg/ml) | 4.95 (3.21–10.46) | 2.86# (2.01–6.87) | 2.33 * (1.07–3.47) | 1.90 * (0.80–2.70) | 1.05 *** (0.30–1.70) |
| IL-7 (pg/ml) | 6.82+# (4.76–8.54) | 5.44 (3.04–6.48) | 4.76 (3.38–7.34) | 4.00 (3.40–5.10) | 3.85 (2.32–4.65) |
| IL-8 (pg/ml) | 6.42+# (4.12–9.05) | 6.42## (5.03–8.33) | 3.44 (2.45–5.49) | 2.10 (1.27–7.97) | 1.30 (1.00–2.97) |
| IL-10 (pg/ml) | 1.75 (0.07–1.96) | 0.060+ (0.05–2.61) | 0.21++ (0.05–1.14) | 3.30 (1.15–5.32) | 1.10+ (0.70–1.20) |
| IL-12 (pg/ml) | 2.97+# (0.86–3.41) | 1.69 (0.10–1.90) | 0.86 (0.47–2.54) | 0.40 (0.30–1.20) | 0.50 (0.30–0.80) |
| IL-13 (pg/ml) | 0.54 (0.09–0.86) | 0.06+ (0.06–0.50) | 0.06++ (0.06–0.18) | 0.85 (0.30–4.60) | N/A |
| IL-17 (pg/ml) | 1.99+ ## (0.74–2.62) | 0.94+ ## (0.74–3.91) | 0.78## (0.74–1.38) | 0.30 (0.10–1.00) | 0.30 (0.10–0.70) |
| MCP-1 (pg/ml) | 18.85++ ### (10.77–23.27) | 22.91++ ### (8.97–27.83) | 10.33+++ #### (7.55–25.40) | 199.4 (136.7–334.9) | 223.4 (155.4–912.4) |
| MIP-1β(pg/ml) | 30.86+ ### (23.50–51.90) | 43.62+ ### (17.41–60.38) | 31.35## (23.48–41.80) | 15.40 (12.60–29.70) | 11.35 (9.20–13.08) |
| TNF-α (pg/ml) | 11.79 ### (6.83–25.09) | 11.79# (3.33–16.33) | 10.52## (5.63–20.99) | 5.750 (4.82–11.50) | 3.40 (2.95–3.92) |
Blood samples from HIV-TB patients were collected at the time of TB diagnosis (Visit 1 or V1) and approximately three (V2) and six (V3) months after TB treatment initiation. Additionally, samples from HIV, HIV-LTB and HD were collected. Simultaneous determinations of several cytokines and chemokines were performed using a multiplex assay. Moreover, radial immunodiffusion assay was used to quantify C-reactive protein (CRP). Results are expressed as Mean ± Interquartile range. Kruskal-Wallis test *p < 0.05, **p < 0.01, ***p < 0.005 and ***p < 0.001.
indicates differences with HIV-TB (V1),
indicates differences with HIV and
indicates differences with HD.
The profile of HIV-TB patients undergoing anti-TB treatment was analyzed. HIV-TB patients at V1 exhibited higher quantities of pro-inflammatory signals, with levels of CRP and IL-6 that diminished in concentration with anti-TB/HIV treatment (V1 vs V3, Table 2). Compared to HD and HIV groups, the HIV-TB cohort, regardless of whether or not they received anti-TB treatment, exhibited higher levels of IFN-γ, IL-5, IL-17 and MIP-1β but lower levels of IL-2 and MCP-1; except for IL-17 and MIP-1β for HIV-TB at V3 and HIV. Moreover, HIV-TB showed elevated plasma concentration of TNF-α compared to HD (Table 2).
Untreated HIV-TB individuals differed from the cohorts of HD and HIV individuals because an increased concentration of IL-7, IL-8 and IL-12. HIV-TB at V2 and V3 had significantly lesser amounts of the plasma levels of G-CSF, IL-10 and IL-13 when compared to HIV cohort. Besides, HIV group displayed greater levels of anti-inflammatory cytokines (IL-10 and IL-13), compared to the other cohorts with the exception of HIV-TB at V1 (Table 2).
3.6. Patient-to-patient comparison of the effect of anti-TB treatment on adrenal axis and immune response
Up to this point, we studied the group of HIV-TB patients as a whole at V1, V2 and V3, but we wondered how adrenal and immune status changed from the beginning to the end of TB treatment in a patient-to-patient comparison. For that reason, we analyzed the previous results following the variation in each individual and contrasted V1 vs. V3 (Figures 6 and 7).
Figure 6. Patient-to-patient comparison among clinical data, adrenal hormones plasma levels and immunological status and from HIV-TB at V1 and V3.

We contrasted (A) clinical data (viral load, absolute and nadir CD4+ T cell counts, CD4/CD8 cell ratio), (B) the levels measured for each hormone and (C) the immunological status from HIV-TB patients at V1 and V3. Each symbol represents an individual subject. Wilcoxon matched-pairs signed rank test, *p<0.05, **p<0.01, ***p<0.005 and ****p<0.001.
Figure 7. Patient-to-patient comparison among cytokine, chemokine and colony-stimulating factor levels from HIV-TB at V1 and V3.
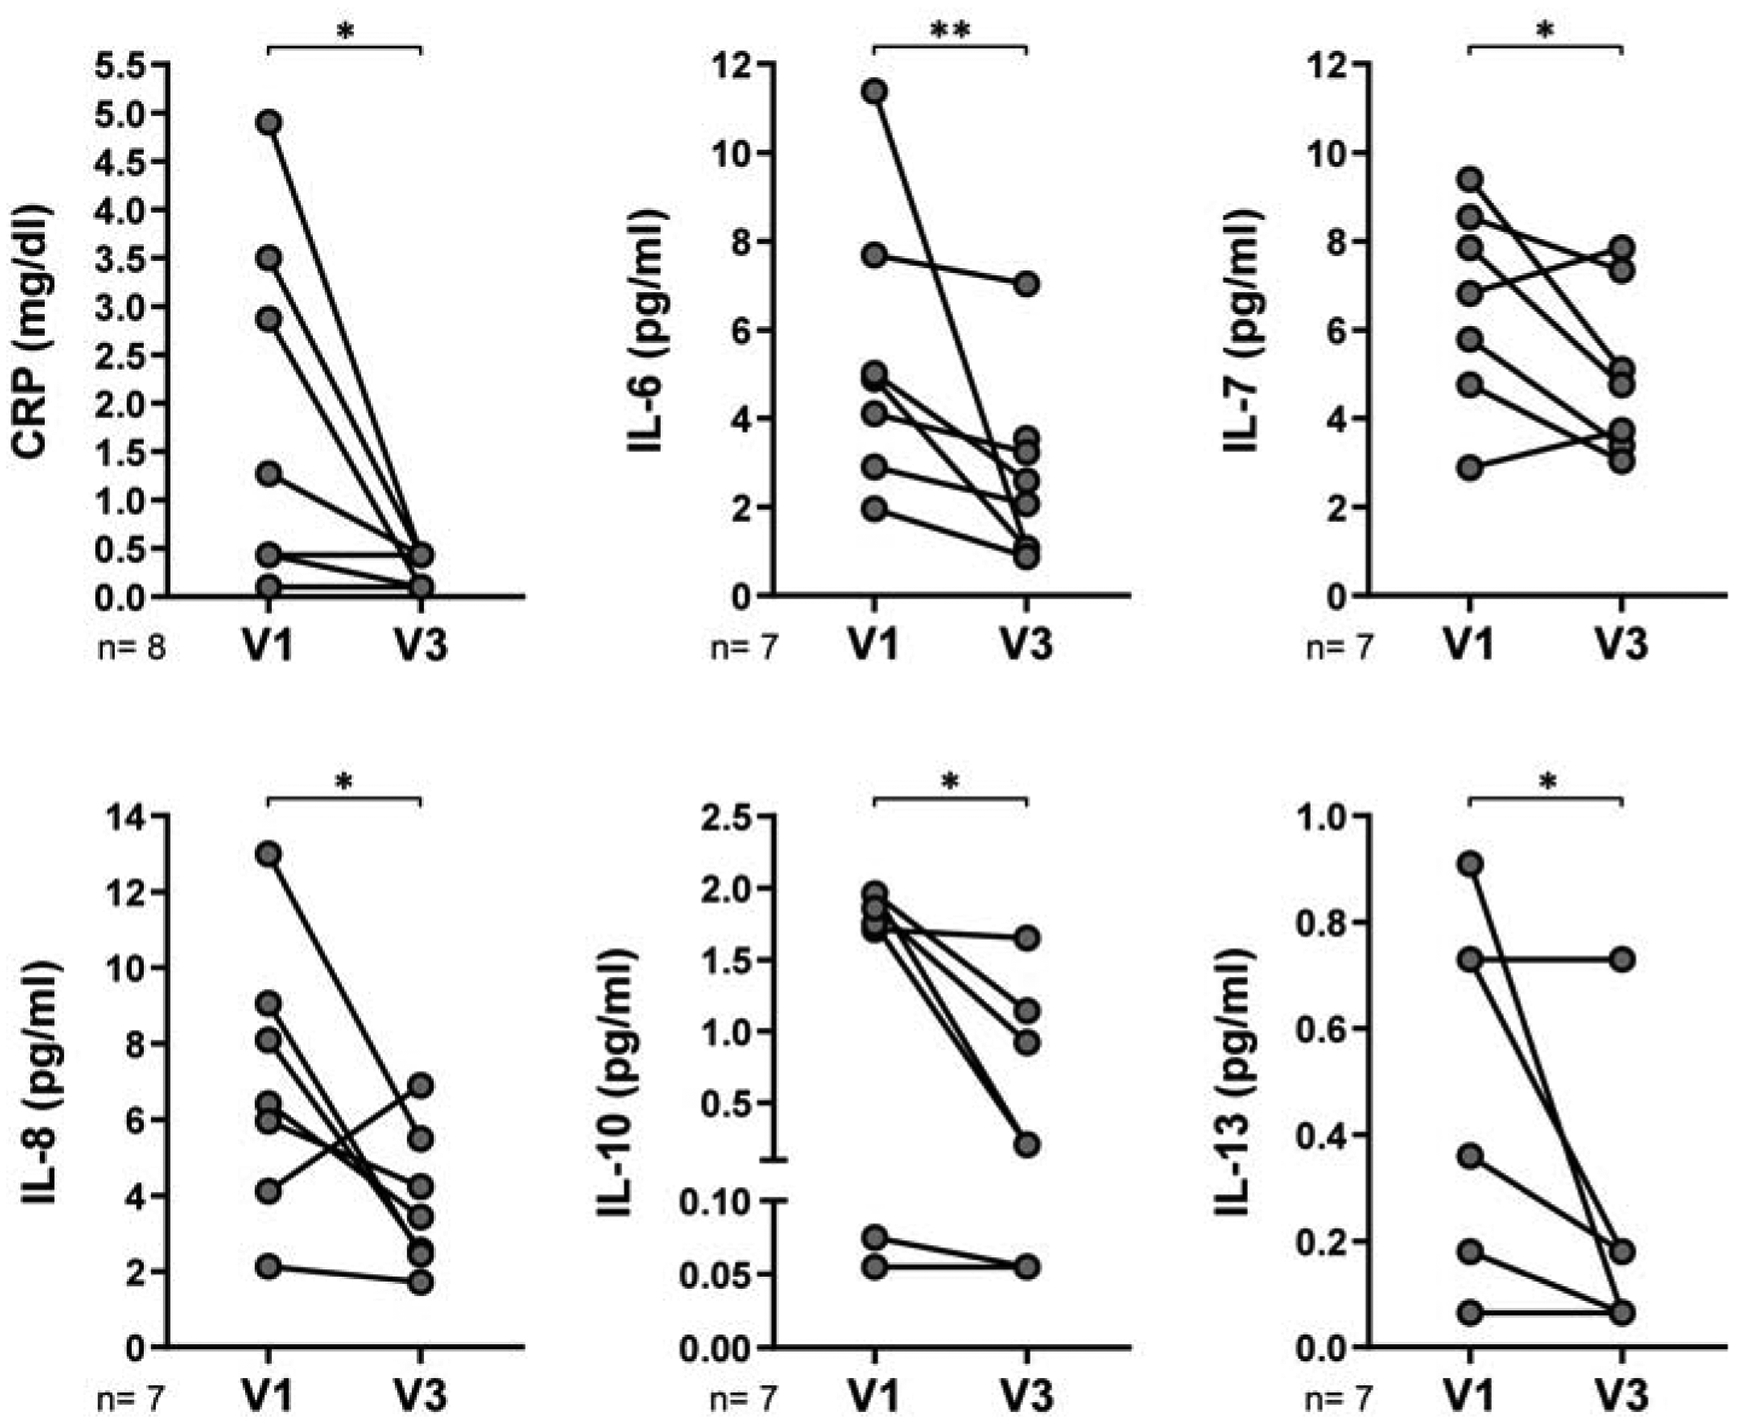
We contrasted plasma levels of cytokines, chemokines and colony-stimulating factors from HIV-TB patients at V1 and V3. Each symbol represents an individual subject. Wilcoxon matched-pairs signed rank test, *p<0.05 and **p<0.01.
Throughout the course of tuberculosis treatment accompanied with HAART, viral load was expected to decrease while there was an augment in absolute CD4+ T cell count and CD4/CD8 ratio (Figure 6 A). These favorable changes were associated with a better outcome, accompanied with an increment in DHEA-S and DHEA plasma levels and a diminution in cortisol. In consequence, cortisol/DHEA-S and cortisol/DHEA ratio were reduced from V1 to V3 in HIV-TB patients (Figure 6 B). Moreover, the number of IFN-γ-secreting cells rose concomitantly with a diminution in the frequency of uTregs (Figure 6 C). Our findings indicated that inflammation was reduced, since CRP and IL-6 were lessened, but also there was a significant decrease in the anti-inflammatory cytokines IL-10 and IL-13 from V1 to V3. Plasma levels of IL-7 and IL-8 also diminished at V3 (Figure 7).
Lastly, we evaluate the ability of the variables measured in this report to discriminate between HIV-TB patients before (V1) and after (V3) six-month anti-TB treatment regimen through the receiver operating characteristic (ROC) analysis (Table 3). The area under the ROC curves (AUC) of clinical data (viral load, absolute CD4+ T cell counts and CD4/CD8 ratio), as well as plasma levels of adrenal hormones (DHEA-S, DHEA and cortisol) and its balance (cortisol/DHEA-S and cortisol/DHEA), the number of IFN-γ-secreting cells and the frequency of Tregs and uTregs were compared (Table 3). ROC analysis yielded significant diagnostic ability for viral load, CD4+ T cell counts, DHEA-S, DHEA, cortisol, cortisol/DHEA-S and cortisol/DHEA (Table 3). From all these parameters, the higher AUC values with greater significance were found in viral load, cortisol/DHEA ratio and DHEA plasma levels. While changes in viral load are mainly due to HAART, the variation in hormone levels would be the result of the combination of antiretroviral therapy and anti-TB treatment.
Table 3.
Evaluation of the diagnostic accuracy of the markers studied to discriminate HIV-TB patients before and after six-month anti-TB treatment regimen.
| Parameter | AUC | Confidence interval (95%) | P value |
|---|---|---|---|
| Viral Load | 0.87 | 0.79 – 0.95 | <0.0001 |
| CD4 + T cell Count | 0.65 | 0.51 – 0.79 | 0.048 |
| CD4/CD8 ratio | 0.63 | 0.47 – 0.79 | 0.13 |
| DHEA-S | 0.67 | 0.51 – 0.83 | 0.049 |
| DHEA | 0.71 | 0.56 – 0.86 | 0.0096 |
| Cortisol | 0.67 | 0.52 – 0.82 | 0.034 |
| Cortisol/DHEA-S | 0.67 | 0.51 – 0.82 | 0.043 |
| Cortisol/DHEA | 0.75 | 0.61 – 0.88 | 0.0026 |
| IFN-γ secreting cells | 0.75 | 0.52 – 0.98 | 0.071 |
| Percentage of Tregs | 0.57 | 0.34 – 0.79 | 0.56 |
| Percentage of uTregs | 0.68 | 0.48 – 0.89 | 0.11 |
The table shows the area under the receiver operating characteristic curve (AUC) as a measure to determine the capability of the parameter to differentiate V1 from V3. ROC analysis was performed using Wilson/Brown hybrid method. p<0.05 indicates that the marker significantly discriminates between treated and untreated patients.
Overall, our data showed that combined anti-HIV/TB treatment impacts on clinical recovery, adrenal hormone balance, an improved production of IFN-γ, on the frequency of uTregs (which may be involved in the pathogenesis in HIV-TB patients [16]), on systemic inflammation and on the levels of several cytokines and chemokines (as IL-6, IL-7, IL-8, IL-10 and IL-13). However, neither some plasma soluble factors (INF-γ, IL-2, IL-17, MCP-1, MIP-1β, TNF-α) nor peripheral conventional Treg proportions were modified beyond completion of anti-TB therapy in HIV-TB patients. Interestingly, higher levels of DHEA-S or DHEA, together with a reduction in cortisol plasma concentration, were associated with improved clinical parameters in HIV-TB patients, such as higher levels of absolute CD4+ T cell counts, increased CD4/CD8 ratio and a restricted TB localization to the lungs. Moreover, the balance between the plasma levels of cortisol and DHEA might be studied within a diagnostic algorithm as a predictor of infection resolution after anti-TB treatment in HIV+ individuals. Therefore, anti-TB treatment in HIV-TB patients not only modified immunological status but also there were endocrine variations which presented a correlation with parameters underlying disease resolution.
4. Discussion
Anti-TB treatment in HIV-TB coinfected individuals is challenging and has a prolonged duration, mainly due to failure of the immune system to provide an adequate support for the therapy [1]. Several articles described variations in adrenal hormones plasma levels, which were associated with the severity of disease during HIV or Mtb infection [4,5,26,27]. In this report, we evaluated the levels of DHEA, DHEA-S and cortisol in HIV-TB patients over 6 months of combined anti-HIV/TB treatment, in order to analyze immune-endocrine variations throughout the course of the therapy.
Active TB in HIV-1-infected individuals was associated to enhanced transcriptional activity of HIV-1, HIV-related immunodeficiency and mortality [1,23]. Without treatment, the mortality rate from TB is high [1]. We previously measured CD4+ T cell counts along combined anti-HIV/TB therapy in a cohort of HIV-TB patients [20], but we did not find any significant changes, probably due a reduced number of patients recruited. Here, we observed that the values of CD4/CD8 T cell ratio and CD4+ counts in HIV-TB patients at the end of their chemotherapy treatment reached the levels of people chronically infected with HIV-1, but there were significant differences compared to HIV-TBL group and HD. This indicates an impaired clinical status of HIV-TB patients, even after a 6-month period on anti-TB treatment.
We measured plasma concentration of DHEA-S, DHEA and cortisol throughout the course of tuberculosis treatment in HIV-TB patients, in order to compare clinical status and adrenal hormone levels. It was previously described that clinical improvement that accompanies therapy in TB patients was associated with changes in the endocrine functions [4,17]. As reported earlier, newly diagnosed TB patients were characterized by low levels of DHEA or DHEA-S and augmented cortisol concentrations [4,5,17,28]. Moreover, in HIV+ people HIV/AIDS leads to lower DHEA and higher glucocorticoid levels [29,30]. It is known that the co-infection scenario results in a more complex situation [2,3]. We demonstrated that HIV+ individuals with active TB (V1) depicted the lowest levels of DHEA-S compared with the cohort after anti-TB treatment (V3), HIV individuals with or without latent TB and HD. DHEA-S plasma levels positively correlated with CD4 T cell counts and CD4/CD8 ratio in HIV-TB patients, indicating that reduced levels of the hormone are associated with immunosuppression. In addition, untreated HIV-TB patients had lower plasma concentration of DHEA than the same cohort at V3, HIV and HIV-TBL groups, but they did not present differences with the values measured in HD. We did not observe modifications in the levels of either DHEA nor DHEA-S when contrasting with HIV individuals and HD, but there were significant differences in plasma concentration of cortisol between the aforementioned groups. Our results agree with a previous report that demonstrated that the serum DHEA concentrations correlated with the stage of HIV-infection, while the levels of cortisol were elevated at all stages of infection [30].
The low plasma concentration of DHEA-S observed in HIV-TB at V1 may be explained by a decreased synthesis or an increase in its use and/or metabolism. Steroid sulfates have been generally regarded a source of bioavailability of the active hormone. DHEA is found in blood stream in its sulfated form, DHEA-S, which can be interconverted by sulfotransferases and hydroxysteroid sulfatases [11]. It has been suggested that in patients with Mtb or HIV infection, soluble factors or the pathogens themselves could act directly on adrenal tissue, altering hormonal production [9,31]. While DHEA-S presented a decrease in HIV-TB before anti-TB treatment, we did not find significant differences in DHEA plasma concentration compared to HD. We hypothesized that DHEA-S would be metabolized to maintain the values of DHEA within the normal range and thus counteract cortisol effects [32].
Supporting this idea, in a recent work we performed the simultaneous determination of DHEA and its metabolites androstenediol (AED), androstenetriol (AET) and 7-oxo-DHEA levels in human plasma samples. Statistically significant differences were found between HIV-TB patients and HD regarding the levels of DHEA, AET and 7-oxo-DHEA [22]. Differences in the level of DHEA between the previous and the current study could be caused by different sensitivity of the techniques used to measure hormones. DHEÁs derivatives upregulate host immunity, conferring protection against bacterial and viral infections [33–35]. Particularly, 7-oxo-DHEA enhances Mtb-specific T cell responses during HIV-TB coinfection [16]. DHEA was characterized as a compound that induces of a Th1 response and interferes with Th2 cytokine synthesis [32], and we have been studying its effects over the past years in the context of HIV-TB coinfection [13,14]. The stimulation of Th1 lymphocytes with the production of IFN-γ and the activation of macrophage is crucial in the defense against Mtb [36]. Therefore, we suggest that DHEA-S would be consumed in order to DHEA (or its metabolites) may mediate Th1-immunity against Mtb. In line with our hypothesis, the normalization of DHEA-S plasma levels in HIV-TB patients at advanced times of anti-TB treatment would indicate that DHEA consumption has decreased in this instance, reflecting a lower spending of the precursor by peripheral tissues. In fact, we calculated DHEA-S/DHEA ratio and found significatively (p<0.05) higher values of this proportion in HIV-TB at V1 (0.24, IQR: 0.13–0.52) compared to V3 (0.19, IQR: 0.09–0.32).
On the other hand, HIV-TB at V1 showed higher amounts of cortisol than in V3. That may be explained by HPA axis dysfunction and/or an attempt to stabilize the pathologic inflammatory response during active disease. These variations resulted in the highest cortisol/DHEA-S and cortisol/DHEA ratios in untreated HIV-TB patients. At the end of chemotherapy, adrenal hormones plasma levels in HIV-TB cohort were not significantly different from those in HD, suggesting a normalization of the axis. Cortisol/DHEA-S ratio was found to be higher in patients diagnosed with extrapulmonary TB instead of a restricted pulmonary TB, and it negatively correlated with absolute and nadir CD4+ T cell values and CD4/CD8 ratio. Although we did not find any direct association with cortisol/DHEA equilibrium within these parameters, there was a positive correlation between this and the levels of cortisol and cortisol/DHEA-S in untreated HIV-TB patients. It was reported that HIV-TB patients with extrapulmonary TB are more likely to develop clinical deterioration and advanced immunodeficiency [37]. At the end of the follow-up, the balance between cortisol and DHEA-S or DHEA was restored, as we demonstrated for the entire group and in a patient-to-patient comparison. We could assume that adrenal function is normalized, maybe by a reduction of endogenous compounds that affect adrenal axis activity accompanied by the restoration of the immune functions.
In consonance with these hypotheses, Mtb-specific response was measured. IFN-γ producing cells increased after anti-TB treatment, encompassing levels comparable to HD. In a preceding report we observed that PBMCs from HIV-TB patients treated with cortisol in vitro displayed lesser frequency of cytokine-producing cells, while DHEA treatment significantly enhanced the IFN-γ responses to Mtb antigen [14]. This is supported by the fact that TB patients treated with corticosteroids are more likely to have a negative IFN-γ release assay (IGRA) result [38] and dexamethasone alters Mtb-specific antigen-induced cytokine responses, including IFN-γ [39]. Nevertheless, it should be noted that advanced immunosuppression impairs the performance of IFN-γ producing cell tests, since the proportion of spots increase with CD4+ T cell count [40].
Immunoregulation status was estimated by studying the frequency of Tregs (CD4+CD25+FoxP3+) and uTregs (CD4+CD25-FoxP3+). In previous reports, we described that uTregs are a CD4+ T cell population with undetectable levels of CD25 that regulate proliferation and cytokine production from effector T cells [14,20]. There were no differences among the recruited cohorts in the frequency of Tregs. While in another study based on TB patients it was reported that Tregs persistently increased until 4 months of anti-TB treatment [41], we did not observe similar results in our HIV-TB cohort. However, in untreated HIV-TB patients uTregs were expanded, as reported elsewhere [14]. We detected a reduction of uTregs percentage from V1 to V3, as we previously reported [20]. Although it could not reach the levels detected in HD, uTregs proportion was comparable with HIV individuals. In HIV-TB cohort at V1, uTregs frequency inversely correlated with absolute CD4+ T cell counts, which is a predictor of an improved disease outcome. We also formerly demonstrated that the treatment of PBMCs from HIV-TB patients with DHEA decreased the frequency of uTregs, without modifying Tregs, but increased the Th1/uTregs ratio [16]. We speculate that uTregs changes could parallel the level of inflammation, as seen in other autoimmune pathologies such as in patients with systemic lupus erythematosus [42].
In our study cohort of HIV-TB patients, around 36.2% of the recruited individuals were diagnosed with extrapulmonary TB. It is known that the probability of developing extrapulmonary TB is higher in people living with HIV, particularly in advanced stages of immunosuppression, since CD4 T cells are the main population that restricts bacterial growth through the production of cytokines and activation of macrophages [43,44]. As expected, individuals with extrapulmonary TB exhibited higher viral load, lower levels of absolute and nadir CD4 T cell counts and decreased CD4/CD8 ratio, compared with patients with TB restricted to the lungs. Furthermore, progressed immunosuppression in extrapulmonary TB individuals was associated with a greater cortisol/DHEA-S ratio. This evidence reinforces the idea of the existence of a cross-regulation between the balance of adrenal steroids and the function of immune system during HIV-TB coinfection.
An appropriate biomarker provides information on the individual risk of disease onset [45], such as viral load to detect HIV [18]. ROC analysis is used in medical sciences for assessing the sensitivity and specificity of a quantified parameter in distinguish two clinical status. The aptitude of a parameter is estimated by the area under the ROC curve (AUC), where upper levels of AUC denote a superior marker performance [46]. According to this study, the AUC of cortisol/DHEA ratio and DHEA plasma levels (along with the viral load) showed to be the highest of all the parameters tested. These observations reflect the potential diagnostic usefulness of adrenal hormones as markers of disease resolution.
We evaluated cytokine and chemokine production as well as inflammation levels, since the control of an infectious process depends on the quality and magnitude of the immune response. During chronic infections, the processes employed for protection become detrimental to the host [47]. First, HIV-TB patients at V1 displayed increased amounts of CRP compared to HD. This finding agrees with other studies, where a raise in the levels of CRP in HIV positive and negative people with TB was reported [48,49]. Importantly, anti-TB treatment in HIV-TB patients was followed by a reduction in the levels of CRP, which is a nonspecific marker of systemic inflammation [50].
It is known that HIV and TB coinfection promotes secretion of cytokines and chemokines at great magnitudes and alteration in cytokine profiles was associated with adverse prognosis [51,52]. Changes in cytokine responses were reported for HIV positive and HIV negative Tuberculosis patients after specific therapy elsewhere [17,52]. In the current work, we found that the drop in CRP from V1 to V3 was accompanied by lower IL-6 plasma levels but also a reduction in IL-7, IL-8, IL-10 and IL-13, as it was depicted in patient-to-patient studies. It is likely that at longer times, anti-TB treatment and HAART would lead to the normalization of these parameters, with the improvement in the individual’s clinical condition. The combined anti-HIV/TB therapies significantly improves cytokines and chemokines levels but treated patients still exhibited differences compared to HD. HIV-TB cohort presented higher levels of IFN-γ, IL-5, IL-17, MIP-1β, TNF-α and lower IL-2 and MCP-1 plasma concentration compared to HD. Taken together, our data suggest that there is an altered secretion of soluble factors during HIV-TB coinfection, which causes a chronic state of both inflammation and immunosuppression, and contributes to the pathology of the disease.
The results obtained in this work suggest that the balance among adrenal hormones is associated with the clinical and immunological status of the individual during HIV and Mtb coinfection. The enhanced cortisol/DHEA-S and/or cortisol/DHEA ratios in untreated HIV-TB patients, the high frequencies of uTregs lymphocytes and the reduced IFN-γ specific response are unfavorable for the disease outcome, because they were associated with an altered production of cytokines and chemokines that lead to a pathological status. The relatively small size of the cohorts analyzed is a limitation of the current investigation, though it should be considered that the number of HIV-TB individuals enrolled is comparable to those previously informed in similar reports. [23,52–54] Despite this difficulty, significant associations were found between hormone plasma levels and clinical status. Furthermore, cortisol/DHEA ratio, as well as DHEA plasma concentration, might be used as predictive factors of infection resolution in our study population of HIV-TB patients, taking into account relevant clinical data (e.g., those contemplated in TB scoring systems). It is still an issue for further consideration whether the variations in adrenal hormone levels are a result to regulate immunological status or endocrine changes are a consequence of an ineffective immune response. This research contributes to understanding the role of adrenal hormones in HIV-TB patients and emphasizes the need for deepening their study in this context.
Highlights.
HIV-TB coinfection impacts on adrenal DHEA-S/Cortisol and DHEA/Cortisol balance.
Higher DHEA-S or DHEA plasma levels were related to improved clinical outcomes.
After anti-TB treatment it was observed a restoration of adrenal axis function.
Cortisol/DHEA ratio or DHEA levels may be used as predictors of disease resolution.
Acknowledgements
The authors would like to thank the study subjects for their participation, Dr. Pedro Cahn and Dr. Horacio Salomon for continuous support and Mr. Sergio Mazzini for revising the manuscript.
Funding statement
This work was supported by Agencia Nacional de Promoción Científica y Tecnológica [PICT 2012–0059 to MFQ] and by Universidad de Buenos Aires [UBACyT 20020120200050BA to MFQ]. This investigation also used resources that were supported by the Southwest National Primate Research Center grant P51 OD011133 from the Office of Research Infrastructure Programs, National Institutes of Health, USA.
Footnotes
Publisher's Disclaimer: This is a PDF file of an unedited manuscript that has been accepted for publication. As a service to our customers we are providing this early version of the manuscript. The manuscript will undergo copyediting, typesetting, and review of the resulting proof before it is published in its final form. Please note that during the production process errors may be discovered which could affect the content, and all legal disclaimers that apply to the journal pertain.
Declaration of competing interest
The authors declare that they have no competing interests.
Ethics approval
The study was carried out in line with the World Medical Association Declaration of Helsinki and approved by the Ethics Committee of Fundación Huésped (Buenos Aires, Argentina) and the University of Buenos Aires School of Medicine approved the current study.
Consent to participate
Study population voluntarily agreed to participate in this research study. Written informed consent was documented from all the participants.
Availability of data and material
All data generated or analyzed during this study are included in this published article and its additional information files.
References
- [1].World Health Organization. Global tuberculosis report 2019. 2019.
- [2].Esmail H, Riou C, du Bruyn E, Lai RP-J, Harley YXR, Meintjes G, et al. The Immune Response to Mycobacterium tuberculosis in HIV-1-Coinfected Persons. Annu Rev Immunol 2018;36:annurev-immunol-042617–053420. 10.1146/annurev-immunol-042617-053420. [DOI] [PubMed] [Google Scholar]
- [3].Tornheim JA, Dooley KE. Tuberculosis associated with HIV infection. Microbiol Spectr 2017;5:TNMI7–0028–2016. 10.1128/microbiolspec.TNMI7-0028-2016.Correspondence. [DOI] [PMC free article] [PubMed] [Google Scholar]
- [4].Díaz A, Bongiovanni B, D’Attilio L, Santucci N, Dídoli G, Fernández R del V, et al. The clinical recovery of tuberculosis patients undergoing specific treatment is associated with changes in the immune and neuroendocrine responses. Pathog Dis 2017;75:1–11. 10.1093/femspd/ftx087. [DOI] [PubMed] [Google Scholar]
- [5].Kleynhans L, Ruzive S, Ehlers L, Thiart L, Chegou NN, Conradie M, et al. Changes in host immune-endocrine relationships during tuberculosis treatment in patients with cured and failed treatment outcomes. Front Immunol 2017;8:1–13. 10.3389/fimmu.2017.00690. [DOI] [PMC free article] [PubMed] [Google Scholar]
- [6].D’Attilio L, Díaz A, Fernández RDV., Bongiovanni B, Santucci N, Dídoli G, et al. The neuroendocrine-immune relationship in pulmonary and pleural tuberculosis: a better local profile in pleural fluid. Int J Tuberc Lung Dis 2018;22:321–7. 10.5588/ijtld.17.0270. [DOI] [PubMed] [Google Scholar]
- [7].George MM, Bhangoo A. Human immune deficiency virus (HIV) infection and the hypothalamic pituitary adrenal axis. Rev Endocr Metab Disord 2013;14:105–12. 10.1007/s11154-013-9244-x. [DOI] [PubMed] [Google Scholar]
- [8].Buckingham JC, Loxley HD, Christian HC, Philip JG. Activation of the HPA axis by immune insults: roles and interactions of cytokines, eicosanoids, glucocorticoids. Pharmacol Biochem Behav 1996;54:285–98. [DOI] [PubMed] [Google Scholar]
- [9].Chrousos GP, Zapanti ED. Hypothalamic-Pituitary-Adrenal Axis in HIV Infection and Disease. Endocrinol Metab Clin North Am 2014;43:791–806. 10.1016/j.ecl.2014.06.002. [DOI] [PubMed] [Google Scholar]
- [10].Bons J, Moreau L, Lefebvre H. Adrenal disorders in human immunodeficiency virus (HIV) infected patients. Ann Endocrinol (Paris) 2013;74:508–14. 10.1016/j.ando.2013.09.002. [DOI] [PubMed] [Google Scholar]
- [11].Kalimi M, Shafagoj Y, Loria R, Padgett D, Regelson W. Anti-glucocorticoid effects of dehydroepiandrosterone (DHEA). Mol Cell Biochem 1994;131:99–104. 10.1007/BF00925945. [DOI] [PubMed] [Google Scholar]
- [12].Bottasso O, Bay ML, Besedovsky H, Del Rey A. The Immuno-endocrine Component in the Pathogenesis of Tuberculosis. Scand J Immunol 2007;66:166–75. 10.1111/j.1365-3083.2007.01962.x. [DOI] [PubMed] [Google Scholar]
- [13].Suarez GV, Angerami MT, Vecchione MB, Laufer N, Turk G, Ruiz MJ, et al. HIV–TB coinfection impairs CD8+ T-cell differentiation and function while dehydroepiandrosterone improves cytotoxic antitubercular immune responses. Eur J Immunol 2015;45:2529–41. 10.1002/eji.201545545. [DOI] [PubMed] [Google Scholar]
- [14].Quiroga MF, Angerami MT, Santucci N, Ameri D, Francos JL, Wallach J, et al. Dynamics of adrenal steroids are related to variations in Th1 and Treg populations during Mycobacterium tuberculosis infection in HIV positive persons. PLoS One 2012;7:e33061. 10.1371/journal.pone.0033061. [DOI] [PMC free article] [PubMed] [Google Scholar]
- [15].Angerami M, Suarez G, Pascutti MF, Salomon H, Bottasso O, Quiroga MF. Modulation of the phenotype and function of Mycobacterium tuberculosis-stimulated dendritic cells by adrenal steroids. Int Immunol 2013:1–7. 10.1093/intimm/dxt004. [DOI] [PubMed] [Google Scholar]
- [16].Vecchione MB, Laufer N, Sued O, Corti M, Salomon H, Quiroga MF. 7-oxo-DHEA enhances impaired M. tuberculosis-specific T cell responses during HIV-TB coinfection. J Biomed Sci 2020;27:20. 10.1186/s12929-019-0604-z. [DOI] [PMC free article] [PubMed] [Google Scholar]
- [17].Bongiovanni B, Díaz A, D’Attilio L, Santucci N, Dídoli G, Lioi S, et al. Changes in the immune and endocrine responses of patients with pulmonary tuberculosis undergoing specific treatment. Ann N Y Acad Sci 2012;1262:10–5. 10.1111/j.1749-6632.2012.06643.x. [DOI] [PubMed] [Google Scholar]
- [18].DHHS Panel on Antiretroviral Guidelines for Adults and Adolescents – A Working Group of the Office of AIDS Research Advisory Council (OARAC). Guidelines for the Use of Antiretroviral Agents in Adults and Adolescents with HIV. AIDSinfo 2019. https://aidsinfo.nih.gov/contentfiles/lvguidelines/adultandadolescentgl.pdf. [Google Scholar]
- [19].Dirección de Sida, ETS, Hepatitis y TBC S de G de S. Guía práctica para el diagnóstico y tratamiento de las personas con TB en el primer nivel de atención 2019. http://www.msal.gob.ar/images/stories/bes/graficos/0000001443cnt-2019-04-04_guia-TB.pdf.
- [20].Angerami MT, Suarez GV, Vecchione MB, Laufer N, Ameri D, Ben G, et al. Expansion of CD25-Negative Forkhead Box P3-Positive T Cells during HIV and Mycobacterium tuberculosis Infection. Front Immunol 2017;8. 10.3389/fimmu.2017.00528. [DOI] [PMC free article] [PubMed] [Google Scholar]
- [21].Endocrine Norbiato G., metabolic, and immunologic components of HIV infection. Ann N Y Acad Sci 2012;1262:51–5. 10.1111/j.1749-6632.2012.06620.x. [DOI] [PubMed] [Google Scholar]
- [22].Vecchione MB, Eiras J, Suarez GV, Angerami MT, Marquez C, Sued O, et al. Determination of dehydroepiandrosterone and its biologically active oxygenated metabolites in human plasma evinces a hormonal imbalance during HIV-TB coinfection. Sci Rep 2018;8:6692. 10.1038/s41598-018-24771-8. [DOI] [PMC free article] [PubMed] [Google Scholar]
- [23].Toossi Z, Mayanja-Kizza H, Hirsch CS, Edmonds KL, Spahlinger T, Hom DL, et al. Impact of tuberculosis (TB) on HIV-1 activity in dually infected patients. Clin Exp Immunol 2001;123:233–8. 10.1046/j.1365-2249.2001.01401.x. [DOI] [PMC free article] [PubMed] [Google Scholar]
- [24].Etna MP, Giacomini E, Severa M, Coccia EM. Pro-and anti-inflammatory cytokines in tuberculosis: A two-edged sword in TB pathogenesis. Semin Immunol 2014;26:543–51. 10.1016/j.smim.2014.09.011. [DOI] [PubMed] [Google Scholar]
- [25].Cicchese JM, Evans S, Hult C, Joslyn LR, Wessler T, Millar JA, et al. Dynamic balance of pro- and anti-inflammatory signals controls disease and limits pathology. Immunol Rev 2018;285:147–67. 10.1111/imr.12671. [DOI] [PMC free article] [PubMed] [Google Scholar]
- [26].Ferrando SJ, Rabkin JG, Poretsky L. Dehydroepiandrosterone Sulfate (DHEAS) and Testosterone: Relation to HIV Illness Stage and Progression Over One Year. JAIDS J Acquir Immune Defic Syndr 1999;22:146. 10.1097/00126334-199910010-00006. [DOI] [PubMed] [Google Scholar]
- [27].Kannangai R, Kandathil AJ, Ebenezer DL, Mathai E, Prakash AJ, Abraham OC, et al. Usefulness of alternate prognostic serum and plasma markers for antiretroviral therapy for human immunodeficiency virus type 1 infection. Clin Vaccine Immunol 2008;15:154–8. 10.1128/CVI.00193-07. [DOI] [PMC free article] [PubMed] [Google Scholar]
- [28].Bozza VV, D’Attilio L, Mahuad CV, Giri AA, Del Rey A, Besedovsky H, et al. Altered cortisol/DHEA ratio in tuberculosis patients and its relationship with abnormalities in the mycobacterial-driven cytokine production by peripheral blood mononuclear cells. Scand J Immunol 2007;66:97–103. 10.1111/j.1365-3083.2007.01952.x. [DOI] [PubMed] [Google Scholar]
- [29].Chittiprol S, Kumar AM, Shetty KT, Ravi Kumar H, Satishchandra P, Rao RSB, et al. HIV-1 clade C infection and progressive disruption in the relationship between cortisol, DHEAS and CD4 cell numbers: A two-year follow-up study. Clin Chim Acta 2009;409:4–10. 10.1016/j.cca.2009.06.032. [DOI] [PMC free article] [PubMed] [Google Scholar]
- [30].Christeff N, Gherbi N, Mammes O, Dalle MT, Gharakhanian S, Lortholary O, et al. Serum cortisol and DHEA concentrations during HIV infection. Psychoneuroendocrinology 1997;22 Suppl 1:S11–8. 10.1016/s0306-4530(97)00015-2. [DOI] [PubMed] [Google Scholar]
- [31].Kelestimur F, Unlu Y, Ozesmi M, Tolu I. A hormonal and radiological evaluation of adrenal gland in patients with acute or chronic pulmonary tuberculosis. Clin Endocrinol (Oxf) 1994;41:53–6. [DOI] [PubMed] [Google Scholar]
- [32].Dillon J Dehydroepiandrosterone, Dehydroepiandrosterone Sulfate and Related Steroids: Their Role in Inflammatory, Allergic and Immunological Disorders. Curr Drug Target -Inflammation Allergy 2005;4:377–85. 10.2174/1568010054022079. [DOI] [PubMed] [Google Scholar]
- [33].Loria R, Ben-nathan D. Protective effects of DHEA and AED against viral, bacterial and parasitic infections. Isr J Vet Med 2011;66:119–29. [Google Scholar]
- [34].Hernandez-Pando R, Streber ML, Orozco H, Arriaga K, Pavon L, Al-Nakhli SA. The effects of androstenediol and dehydroepiandrosterone on the course and cytokine profile of tuberculosis in BALB/c mice. Immunology 1998;95:234–41. [DOI] [PMC free article] [PubMed] [Google Scholar]
- [35].Loria RM, Conrad DH, Huff T, Carter H, Ben-nathan D. Androstenetriol and Androstenediol protection against lethal radiation and restoration of immunity after radiation injury. Ann NEW YORK Acad Sci 2000;917:860–7. [DOI] [PubMed] [Google Scholar]
- [36].Bussi C, Gutierrez MG. Mycobacterium tuberculosis infection of host cells in space and time. FEMS Microbiol Rev 2019;43:341–61. 10.1093/femsre/fuz006. [DOI] [PMC free article] [PubMed] [Google Scholar]
- [37].Lorent N, Sebatunzi O, Mukeshimana G, Van den Ende J, Clerinx J. Incidence and Risk Factors of Serious Adverse Events during Antituberculous Treatment in Rwanda: A Prospective Cohort Study. PLoS One 2011;6:e19566. 10.1371/journal.pone.0019566. [DOI] [PMC free article] [PubMed] [Google Scholar]
- [38].Bélard E, Semb S, Ruhwald M, Werlinrud AM, Soborg B, Jensen FK, et al. Prednisolone treatment affects the performance of the QuantiFERON gold in-tube test and the tuberculin skin test in patients with autoimmune disorders screened for latent tuberculosis infection. Inflamm Bowel Dis 2011;17:2340–9. 10.1002/ibd.21605. [DOI] [PubMed] [Google Scholar]
- [39].Clifford V, Zufferey C, Germano S, Ryan N, Leslie D, Street A, et al. The impact of anti-tuberculous antibiotics and corticosteroids on cytokine production in QuantiFERON-TB Gold In Tube assays. Tuberculosis 2015;95:343–9. 10.1016/j.tube.2015.02.039. [DOI] [PubMed] [Google Scholar]
- [40].Oni T, Patel J, Gideon HP, Seldon R, Wood K, Hlombe Y, et al. Enhanced diagnosis of HIV-1-associated tuberculosis by relating T-SPOT.TB and CD4 counts. Eur Respir J 2010;36:594–600. 10.1183/09031936.00171509. [DOI] [PMC free article] [PubMed] [Google Scholar]
- [41].Díaz A, Santucci N, Bongiovanni B, D’Attilio L, Massoni C, Lioi S, et al. Increased Frequency of CD4+ CD25+ FoxP3+ T Regulatory Cells in Pulmonary Tuberculosis Patients Undergoing Specific Treatment and Its Relationship with Their Immune-Endocrine Profile. J Immunol Res 2015;2015:1–8. 10.1155/2015/985302. [DOI] [PMC free article] [PubMed] [Google Scholar]
- [42].Bonelli M, Savitskaya A, Steiner C-W, Rath E, Smolen JS, Scheinecker C. Phenotypic and Functional Analysis of CD4 + CD25 − Foxp3 + T Cells in Patients with Systemic Lupus Erythematosus. J Immunol 2009;182:1689–95. 10.4049/jimmunol.182.3.1689. [DOI] [PubMed] [Google Scholar]
- [43].World Health Organization. TB/HIV: A clinical manual. 2004.
- [44].Ernst JD. The immunological life cycle of tuberculosis. Nat Rev Immunol 2012;12:581–91. 10.1038/nri3259. [DOI] [PubMed] [Google Scholar]
- [45].Hajian-Tilaki K Receiver operating characteristic (ROC) curve analysis for medical diagnostic test evaluation. Casp J Intern Med 2013;4:627–35. [PMC free article] [PubMed] [Google Scholar]
- [46].Berrar D, Flach P. Caveats and pitfalls of ROC analysis in clinical microarray research (and how to avoid them). Brief Bioinform 2012;13:83–97. 10.1093/bib/bbr008. [DOI] [PubMed] [Google Scholar]
- [47].Domingo-Gonzalez R, Prince O, Cooper A, Khader SA. Cytokines and Chemokines in Mycobacterium tuberculosis Infection. Tuberc. Tuber. Bacillus, 2nd ed, vol. 4, 2016. 10.1128/microbiolspec.TBTB2-0018-2016. [DOI] [PMC free article] [PubMed] [Google Scholar]
- [48].Schleicher GK, Herbert V, Brink A, Martin S, Maraj R, Galpin JS, et al. Procalcitonin and C-reactive protein levels in HIV-positive subjects with tuberculosis and pneumonia. Eur Respir J 2005;25:688–92. 10.1183/09031936.05.00067604. [DOI] [PubMed] [Google Scholar]
- [49].Fernández RD V, Díaz A, Bongiovanni B, Gallucci G, Bértola D, Gardeñez W, et al. Evidence for a More Disrupted Immune-Endocrine Relation and Cortisol Immunologic Influences in the Context of Tuberculosis and Type 2 Diabetes Comorbidity. Front Endocrinol (Lausanne) 2020;11. 10.3389/fendo.2020.00126. [DOI] [PMC free article] [PubMed] [Google Scholar]
- [50].Sproston NR, Ashworth JJ. Role of C-Reactive Protein at Sites of Inflammation and Infection. Front Immunol 2018;9:1–11. 10.3389/fimmu.2018.00754. [DOI] [PMC free article] [PubMed] [Google Scholar]
- [51].W JR,K NG. Immunological Profiles in HIV Positive Patients with or without Opportunistic Infections and the Influence of Highly Active Antiretroviral Therapy: A Systematic Review and Update. J Clin Cell Immunol 2016;7. 10.4172/2155-9899.1000429. [DOI] [Google Scholar]
- [52].da Silva TP, Giacoia-Gripp CBW, Schmaltz CA, Sant’ Anna FM, Rolla V, Morgado MG. T Cell Activation and Cytokine Profile of Tuberculosis and HIV-Positive Individuals during Antituberculous Treatment and Efavirenz-Based Regimens. PLoS One 2013;8:4–11. 10.1371/journal.pone.0066095. [DOI] [PMC free article] [PubMed] [Google Scholar]
- [53].Bal AM, Lakhashe SK, Thakar MR, Tripathy SP, Paranjape RS. Dysregulation of proinflammatory and regulatory cytokines in HIV infected persons with active tuberculosis. Cytokine 2005;30:275–81. 10.1016/j.cyto.2005.01.015. [DOI] [PubMed] [Google Scholar]
- [54].Rateni L, Lupo S, Racca L, Palazzi J, Ghersevich S. Assessing endocrine and immune parameters in human immunodeficiency virus-infected patients before and after the immune reconstitution inflammatory syndrome. Arch Endocrinol Metab 2018;62:64–71. 10.20945/2359-3997000000010. [DOI] [PMC free article] [PubMed] [Google Scholar]