

The search for an explanation of autism continues and this article supports the hypothesis that aberrations in neuronal connectivity are important defects in this disorder. Fifteen autistic and 8 control boys underwent DTI and fractional anisotropy was used as a measure of fiber tract integrity. FA for each fiber tract affected was correlated with scores of the Social Responsiveness Scale. Autistic patients showed bilateral FA reductions in numerous association, commissural, and projection tracts. Conclusion: DTI shows abnormalities in many long-range fiber tracts suggesting corticocortical connection defects. Because of the type of tracts affected, autism may have a specific neural phenotype.
Abstract
BACKGROUND AND PURPOSE:
There is mounting evidence suggesting widespread aberrations in neural connectivity as the underlying neurobiology of autism. Using DTI to assess white matter abnormalities, this study implemented a voxelwise analysis and tract-labeling strategy to test for a structural neural phenotype in autism.
MATERIALS AND METHODS:
Subjects included 15 boys with autism and 8 controls, group-matched on age, cognitive functioning, sex, and handedness. DTI data were obtained by using a 3T scanner. FSL, including TBSS, was used to process and analyze DTI data where FA was chosen as the primary measure of fiber tract integrity. Affected voxels were labeled by using an integrated white matter tractography atlas. Post hoc correlation analyses were performed between FA of each affected fiber tract and scores on the Social Responsiveness Scale.
RESULTS:
The autism group exhibited bilateral reductions in FA involving numerous association, commissural, and projection tracts, with the most severely affected being the forceps minor. The most affected association tracts were the inferior fronto-occipital fasciculus and superior longitudinal fasciculus. There were no areas of increased FA in the autism group. All post hoc correlation analyses became nonsignificant after controlling for multiple comparisons.
CONCLUSIONS:
This study provides preliminary evidence of reduced FA along many long-range fiber tracts in autism, suggesting aberrant long-range corticocortical connectivity. Although the spatial distribution of these findings suggests widespread abnormalities, there are major differences in the degree to which different tracts are affected, suggesting a more specific neural phenotype in autism.
Advances in anatomic and functional imaging techniques studying brain-behavior relationships and the application of these technologies to the study of ASD have resulted in substantial evidence correlating both core and secondary symptoms to abnormalities in brain connectivity.1–3 Over the past decade, there has been mounting evidence from structural MR imaging, fMRI, and DTI suggesting that the brain phenotype in ASD includes deficiencies of long-range connections such as association and commissural fibers connecting different lobes and hemispheres, respectively. However, the neuroimaging literature remains inconsistent, possibly owing to diagnostic heterogeneity, intersubject variability across sites, scanning protocols, and image processing and analysis methods. Because of the disjointed nature of the current body of evidence, the identification of an autism-specific neural phenotype remains elusive despite a rapidly growing body of research literature.
Since the widespread use of MR imaging in psychiatric research, many studies examining the neurobiology of autism have been published. Early volumetric MR imaging studies first established the existence of larger brains in ASD,4 and later research attributed this to increased white matter,5 the substance of neural fiber tracts. Later work, again using volumetric MR imaging techniques, suggested a pattern of short-range overconnectivity6 and long-range underconnectivity.7 With the application of fMRI in autism-related research came many studies using this technique to demonstrate a pattern of activation consistent with impairments in long-range connectivity.8–11 Finally, there are now many DTI studies that have consistently demonstrated abnormalities in FA in the brains of ASD participants.12–17 Because FA is a widely accepted measure of the structural integrity of white matter,18 these studies have collectively demonstrated a pattern of findings consistent with neural disconnectivity in ASD. However, given the significant heterogeneity in methodologies and participants in these studies, it is difficult to identify a common underlying pattern of neuropathology across all studies. Greater confidence in the disconnectivity hypothesis could be gained if an autism-specific neural phenotype was identified from data collected and analyzed by using more standardized methods.
FSL is an image processing and analysis suite that is widely used, freely available, and well documented (www.fmrib.ox.ac.uk/fsl). FSL includes several tools for processing and analyzing DTI data by using a standard processing and analysis pipeline that includes FDT and TBSS, discussed further in the Image Processing and Analysis section).19 At the time of this writing, it has been used in at least 4 DTI studies identifying white matter abnormalities in ASD.17,20–22 Although an encouraging trend, generalization of abnormalities cannot yet be established with such few studies; therefore, more studies sharing these procedures are needed. The current investigation responds to this need by implementing FSL with its recommended processing and analysis pipeline while also implementing a voxelwise, atlas-based tract-labeling approach not used in previously published studies. The latter provides more precise and quantitative characterization of potentially affected fiber tracts that is essential for the assessment of an autism-specific neural phenotype.
The specific hypotheses posed in the present study are motivated by 2 recently published DTI studies, both using an entirely different group of participants and processing and analysis procedures, demonstrating impairments in the inferior fronto-occipital fasciculus (among other association tracts) and the corpus callosum.17,23 The inferior fronto-occipital fasciculus is unique in that it connects all 4 major lobes of the brain,24 potentially serving an important role in linking all the components in what is commonly called the “social brain” (Fig 1). Therefore, it is hypothesized that the neural phenotype in ASD consists of widespread impairments in long-range connections with higher aberrations seen in the inferior fronto-occipital fasciculus. This would be supported by DTI data demonstrating widespread reductions in FA with abnormalities skewed toward the aforementioned tract. In addition, reductions in FA also are expected in fibers of the corpus callosum, a structure consistently reported as abnormal in ASD.25
Fig 1.

Schematic diagram of the 4 major cerebral lobes, association tracts, and brain regions involved in social information processing.
Materials and Methods
Subjects
Study participants included 15 children and adolescents with ASD (mean age, 10.9 ± 3.7 years; range, 4.9–17.0 years) and 8 TDC participants (mean age, 11.5 ± 2.6 years; range, 8.9–16.7 years), matched on age, sex, handedness, and race. Female participants were very limited in number and were excluded from the analysis because the sample size was insufficient to accommodate the structural variability associated with sex. Those included in the ASD group had confirmed Diagnostic and Statistical Manual of Mental Disorders, 4th edition26 diagnoses and absence of medical and neurologic disease that might be associated with ASD. Diagnosis of ASD was based on parental information, clinical history, and expert evaluation. In addition, 2 standard research diagnostic instruments were used: Autism Diagnostic Interview-Revised27and Autism Diagnostic Observation Schedule.28 The TDC group consisted of healthy volunteers recruited from the same community as participants with ASD. A semistructured clinical interview was conducted with TDC participants, their parents, or both to rule out any history of neurologic problems, neurologic insult resulting in loss of consciousness, psychiatric disorders, and history of ASD in first- or second-degree relatives. The DAS29 was administered to study participants to assess the wider range of cognitive functioning inherent in ASD subjects. Additional psychological measurements were collected for all participants, including the SRS.30 The study was approved by the University Human Investigations Committee. Informed consent was obtained from the parent(s) or guardian(s) of all participants, as well as each participant's verbal assent.
Image Acquisition
MR imaging was performed by using a 3T Magnetom Tim Trio system (Siemens, Erlangen, Germany). Diffusion-weighted data were collected with an 8-channel head coil, using parallel imaging to gain better signal intensity at air-tissue interfaces. Diffusion imaging parameters include: diffusion directions = 30, B0 = 5, TR = 6200 ms, TE = 85 ms, FOV = 240 mm2, section thickness = 2.5 mm (isotropic), GRAPPA on, number of sections = 55, averages = 3, and total scan time = 11 minutes. With a standard single-channel head coil, whole-brain T1-weighted MR imaging was performed by using a sagittal 1-mm3 magnetization-prepared rapid acquisition of gradient echo sequence. The pulse sequence parameters were as follows: TR = 2530 ms, TE = 3.66 ms, TI = 1100 ms, flip angle = 7°, NEX = 1, number of sections = 176, bandwidth = 181 Hz/pixel, matrix = 256 × 256, FOV = 256 mm2, GRAPPA off, and scan time = 8 minutes. All imaging was performed in the same session.
Image Processing and Analysis
Data preprocessing and local diffusion modeling were conducted using FSL.31 First, all volumes were inspected by an experienced rater for severe motion and other artifacts. Diffusion-weighted images were then corrected for eddy current distortion and simple head motion. Next, the 3 runs (per subject) of diffusion-weighted data were averaged to improve signal intensity–to-noise ratio. The program was then used to generate a mask to separate brain from nonbrain areas. The binary brain mask, averaged diffusion-weighted data, b-values, and vector information were then input into FDT, which fits a diffusion tensor model at each voxel. The result of this process was a FA map for each subject. Given the preliminary nature of this investigation and the aim to eloquently identify a neural phenotype, FA was chosen as the sole measure of the structural integrity of axonal fiber tracts.
Voxelwise analysis of multisubject diffusion data was conducted using TBSS that provide a satisfactory solution to the challenge of aligning FA images from different groups for subsequent voxelwise analysis that differs from standard registration algorithms.19 With the use of an optimized nonlinear registration followed by projection onto an alignment-invariant tract representation, TBSS allows for valid conclusions to be drawn from analysis of multisubject diffusion imaging studies. The procedure as implemented in the current study consists of the following steps: 1) conversion of FA data into appropriate format, 2) application of nonlinear registration so all FA images are in MNI space, 3) creation of mean FA image, 4) skeletonization of mean FA image by using an FA threshold of 0.3,20 5) projection of all subjects' FA data onto the mean FA skeleton, and 6) submission of the 4D-projected FA data for statistical testing. Voxel-wise analysis was performed on multisubject diffusion data. Areas of significant difference were computed and displayed as 1 P value image, where P < 0.05, corrected for multiple comparisons across space via threshold-free cluster enhancement.32 Using the T1-weighted MR imaging data, intracranial volume was calculated by using FreeSurfer image analysis suite (Martinos Center for Biomedical Imaging, Charlestown, Massachusetts) that consists of automated tools for reconstruction of the brain from MR imaging data.33
Affected white matter structures were identified by using the JHU White Matter Tractography Atlas,34 which is fully integrated into the FSL software package. This atlas was not only useful for identification of potentially affected fiber tracts (ie, those tracts onto which the voxels of significant difference were mapped via the tractography atlas) but also for more precise characterization of potential pathology by quantifying affected voxels based on their tract labels. The MNI coordinates of all affected voxels were captured and intersected with the JHU White Matter Tractography Atlas. These voxels were assigned to atlas labels numbered from 0 (no label) to 1–21, with the latter group consisting of association, commissural, and projection tracts. For all participants individually, affected voxels were grouped by label with their corresponding FA, and counts were generated for each fiber tract. The following summary statistics were computed for each fiber tract: mean FA, SD, and effect size (Cohen d). Finally, exploratory Pearson correlation analyses were performed between mean FA data of the most severely affected fiber tracts and SRS scores, by using the Statistical Package for the Social Sciences 17.0 (SPSS, Chicago, Illinois). Bonferroni correction was used to control for multiple comparisons.
Results
There were no significant group differences in age, intracranial volume, and cognitive functioning (Table 1). The main results of this study are summarized in Table 2 and Fig 2. The ASD group had significant bilateral reductions in FA involving numerous association, commissural, and projection tracts. Affected association tracts include inferior fronto-occipital fasciculus, superior longitudinal fasciculus, inferior longitudinal fasciculus, uncinate fasciculus, and cingulum. Commissural fibers include both forceps major and minor of the corpus callosum. Projection tracts included the anterior thalamic radiation and corticospinal tract. As evident from Table 2, all white matter structures were not equally affected, and the variability was substantial. The fiber tracts with the greatest number of affected voxels were the forceps minor, right inferior fronto-occipital fasciculus, and left inferior fronto-occipital fasciculus. Notably, there were no voxels where FA was significantly increased in the ASD group. Exploratory Pearson correlation analyses did not yield any significant relationships between mean FA within affected fibers and clinical measures (SRS) after adjusting for multiple comparisons.
Table 1:
Subject characteristics
| ASD Group, n = 15 |
TDC Group, n = 8 |
t Test, df = 21 |
||||
|---|---|---|---|---|---|---|
| Mean | SD | Mean | SD | t | P | |
| Age | 10.87 | 3.75 | 11.46 | 2.62 | 0.394 | .698 |
| Intracranial volume, ml3 | 1433.6 | 202.6 | 1497.7 | 236.4 | 0.682 | .502 |
| DAS | 94.87 | 25.57 | 110.25 | 7.59 | 1.647 | .114 |
Table 2:
Characteristics of affected long-range fiber tract by type
| Affected Long-Range Fiber Tract | Analysis Using Tract-Based Spatial Statistics |
|||
|---|---|---|---|---|
| Voxels | Mean FA ± SD |
Cohen d | ||
| ASD | TDC | |||
| Association fiber tracts | ||||
| Left cingulum | 447 | 0.45451 ± 0.03748 | 0.52135 ± 0.03437 | 1.86 |
| Right cingulum | 384 | 0.39698 ± 0.03405 | 0.46118 ± 0.03644 | 1.82 |
| Left inferior fronto-occipital fasciculus | 1800 | 0.42609 ± 0.02737 | 0.47815 ± 0.01963 | 2.19 |
| Right inferior fronto-occipital fasciculus | 2613 | 0.40417 ± 0.02381 | 0.45627 ± 0.02336 | 2.21 |
| Left inferior longitudinal fasciculus | 600 | 0.40164 ± 0.02973 | 0.45423 ± 0.02529 | 1.90 |
| Right inferior longitudinal fasciculus | 516 | 0.35894 ± 0.02004 | 0.40471 ± 0.01826 | 2.39 |
| Left superior longitudinal fasciculus | 1139 | 0.39142 ± 0.02292 | 0.44631 ± 0.03429 | 1.88 |
| Right superior longitudinal fasciculus | 1239 | 0.38618 ± 0.02924 | 0.43763 ± 0.02567 | 1.87 |
| Left uncinate fasciculus | 629 | 0.38364 ± 0.02023 | 0.42668 ± 0.01602 | 2.36 |
| Right uncinate fasciculus | 692 | 0.40255 ± 0.02456 | 0.45125 ± 0.01872 | 2.23 |
| Projection fiber tracts | ||||
| Left anterior thalamic radiation | 1249 | 0.44658 ± 0.02330 | 0.49437 ± 0.01814 | 2.29 |
| Right anterior thalamic radiation | 1676 | 0.44793 ± 0.02493 | 0.49573 ± 0.01988 | 2.12 |
| Left corticospinal tract | 781 | 0.57413 ± 0.03155 | 0.61171 ± 0.02482 | 1.32 |
| Right corticospinal tract | 701 | 0.52393 ± 0.03138 | 0.56246 ± 0.01939 | 1.48 |
| Commissural fiber tracts | ||||
| Forceps major | 716 | 0.50708 ± 0.03044 | 0.55487 ± 0.02163 | 1.81 |
| Forceps minor | 2878 | 0.51958 ± 0.02770 | 0.57127 ± 0.01877 | 2.18 |
Fig 2.
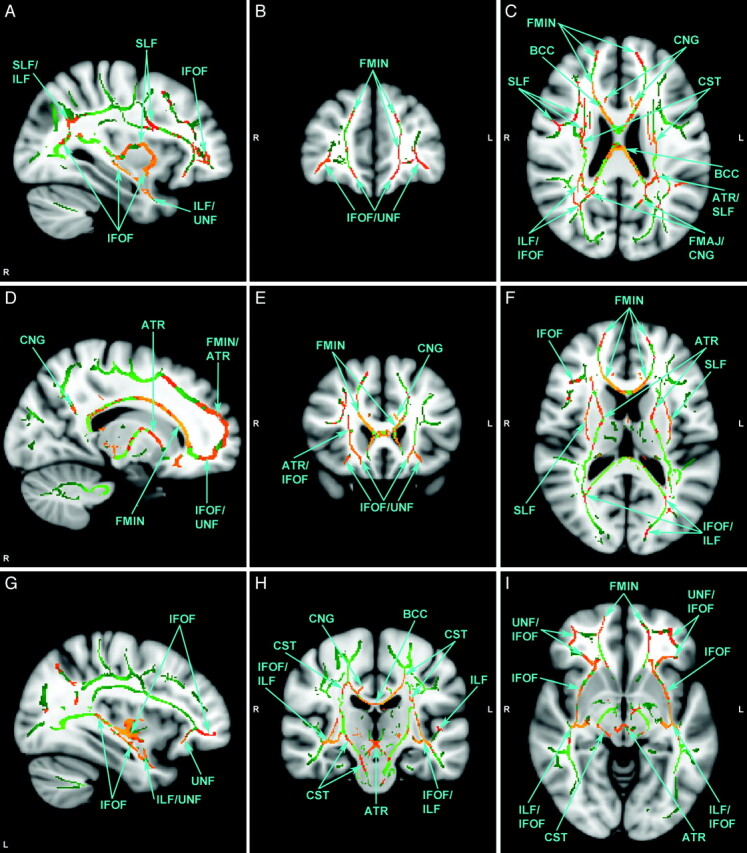
Selected views of affected fiber tracts with reduced FA, illustrated on MNI template brain. Identified in green are those voxels in the group-wise comparison where FA is not significantly different. Identified in red-orange are those voxels where FA is significantly lower in the autism group. Orange indicates higher statistical significance. There are no voxels where FA is significantly higher in the autism group. MNI coordinates for each view are as follows: x=57 (A), y=167 (B), z=95 (C), x=73 (D), y=149 (E), z=86 (F), x=124 (G), y=106 (H), and z=66 (I). L=left; R=right.
Discussion
The central question addressed in the present study was whether an autism-specific neural phenotype can be identified from DTI data collected and analyzed by using more standardized methods (ie, FSL/TBSS). It was hypothesized that the brain phenotype in ASD is characterized by a generalized pattern of impaired long-range connectivity with pathology skewed toward fiber tracts with probable connections to the modules of the social brain, particularly the inferior fronto-occipital fasciculus (Fig 1). This hypothesis was supported by DTI data presented in this preliminary study, where numerous long-range tracts (association, commissural, and projection) in both hemispheres were affected as evidenced by reductions in FA, a well-established measure of fiber tract integrity.18 Although it is evident from Table 2 that all major long-range fiber tracts are affected, not all tracts were equally impaired. The fiber tract with the greatest number of affected voxels was the forceps minor. This was followed by the right and left inferior fronto-occipital fasciculi, respectively. Abnormalities in the corpus callosum may be a nonspecific manifestation of generalized deficits in long-range connectivity because abnormalities also have been reported in other neuropsychiatric disorders such as schizophrenia,35 Alzheimer disease,36 and bipolar disorder.37 However, significant findings in the inferior fronto-occipital fasciculus may reflect ASD-specific atypicalities given its connections to all major cerebral lobes, thus potentially connecting all major modules in the social brain network (Fig 1). This does not imply that aberration of a single fiber tract can explain the diversity of clinical manifestations that characterize ASD. Although numerous tracts may be implicated, the pattern by which all tracts are affected may be revealing, raising the question of whether a unique disconnectivity “fingerprint” may be ascribed to ASD.
Why the inferior fronto-occipital fasciculus may play an important role in the neurobiology of ASD is evident after considering its spatial extent and what it known about the areas of the brain involved in social information processing. Postmortem studies show that the inferior fronto-occipital fasciculus has direct connections to the fusiform gyrus and provides connections between all major lobes of the human brain: frontal, temporal, parietal, and occipital.24 This broad neuroanatomic extent is a unique quality of the inferior fronto-occipital fasciculus and fits well with broad spatial distribution of brain structures involved in social cognition (Fig 1), including but not limited to, the fusiform gyrus (temporal lobe), amygdala (temporal lobe), superior temporal sulcus (temporal lobe), ventromedial prefrontal cortex (frontal lobe), temporoparietal junction (temporal and parietal lobes), and somatosensory cortices (parietal lobe). More striking, however, is the recent report demonstrating the important role of the inferior fronto-occipital fasciculus in correctly recognizing emotion in faces. In a large group of patients with focal brain lesions (n = 103), damage associated with the right inferior fronto-occipital fasciculus significantly predicted overall facial emotion recognition impairment with specific deficits recognizing sadness, anger, and fear.38 The inability to properly identify and recognize facial emotions is a well-known impairment in ASD.39 Moreover, previously published DTI studies lend support to abnormalities of the inferior fronto-occipital fasciculus in ASD.15,17,21,23,40,41 In the present study, the right inferior fronto-occipital fasciculus was the most severely affected association tract, which suggests a potential mechanism for known impairments in facial emotion recognition in ASD.
Another severely affected association tract was the superior longitudinal fasciculus, which was the second most severely affected association tract in the current study. In the left hemisphere, this fiber tract connects the Broca and Wernicke areas.42 It is well known that damage to this pathway can cause a relatively rare language disorder called conduction aphasia.43 Given that language and communication abnormalities are core deficits in ASD, an abnormality in the left superior longitudinal fasciculus comes as no surprise. In fact, this finding is consistent with an influential fMRI study that found impaired functional connectivity between language areas by using a sentence comprehension task in individuals with ASD.10 Moreover, several DTI studies also have revealed abnormalities of the left superior longitudinal fasciculus in ASD.17,20,23,41,44 Although the important role the left superior longitudinal fasciculus has in language processing has been known since the 19th century, the importance of this structure in the right hemisphere is emerging. Abnormalities of the right superior longitudinal fasciculus also have important implications for ASD due to its connection to the superior temporal sulcus,42 a region well known for its role in processing biologic motion, which is abnormal in ASD.45 Moreover, several DTI studies have revealed abnormalities of the right superior longitudinal fasciculus.17,20–22,46 Finally, similar to the inferior fronto-occipital fasciculus, the superior longitudinal fasciculus also has a broad neuroanatomic extent, connecting the frontal, parietal, and temporal lobes.42 As evident in Fig 1, this tract also may potentially serve an important role in linking all the components of brain structures involved in social cognition.
The widespread presence of potential pathology is evident from Table 2 where numerous white mater tracts seem to be affected. Thus, there are many more affected tracts other than the inferior fronto-occipital fasciculus and superior longitudinal fasciculus. Even though specific clinical manifestations are difficult to link to each affected tract, this neither contradicts the hypothesis that the neurobiology of ASD consists of impairments in long-range connections nor precludes the possible existence of an autism-specific neural phenotype. The importance of all fiber tracts can be appreciated given that, as a group, they join centers of language and communication, modules responsible for processing social information, or both (Fig 1); therefore, disruption in any fiber tract can theoretically cause disconnection. Moreover, the wide range of affected tracts remains consistent with the DTI literature on the neurobiology of ASD that, to date, consists of at least 25 published reports. Although a comprehensive review of this literature is beyond the scope of this discussion, many of the affected tracts listed in Table 2 have been reported previously as abnormal. Therefore, abnormal connectivity need not be limited to the inferior fronto-occipital fasciculus and superior longitudinal fasciculus. The possibility that other white matter structures are affected is expected, and this is consistent with the widely held belief that ASD are heterogeneous and distributed disorders.47
Although speculative, the brain phenotype in autism may be characterized by widespread fiber tract compromise with bias toward the inferior fronto-occipital fasciculus, superior longitudinal fasciculus, and corpus callosum. How the inferior fronto-occipital and superior longitudinal fasciculi might account for the social disability that characterizes autism is shown schematically in Fig 3. With the disability of major pathways connecting the modules of the social brain (ie, inferior fronto-occipital and superior longitudinal fasciculi that connect frontal, temporal, and parietal lobes), there is possible reliance on smaller tracts that may lead to inefficient corticocortical communication. However, the aberrations present in all fiber tracts exacerbate the problem. Whether social information processing is possible may depend on how severely impaired the major pathways are and whether alternative pathways are available. The overall pattern of tract deficits may not only dictate the expression of autism but also its severity and heterogeneity.
Fig 3.

Schematic diagram illustrating how the inferior fronto-occipital and superior longitudinal fasciculi might account for the social disability that characterizes autism. Disability of major pathways connecting the modules of the social brain causes reliance on smaller tracts leading to inefficient corticocortical communication. Whether any social information processing is possible depends on how severely impaired the major pathways are and whether alternative pathways are available. Abbreviations indicate modules of social information processing.
Findings reported in this study must be interpreted in the context of several methodologic limitations. This is a preliminary study, and the sample size and age range reflect this fact; however, these impose limitations on the generalization of findings. This is further complicated by the relatively heterogeneous nature of the ASD group. In addition, the control group imposed limitations due to absence of developmentally delayed children without ASD. In the absence of such a comparison group, it remains unclear whether these findings are specific to ASD. Finally, there are several limitations in the voxelwise, atlas-based tract-labeling approach. The JHU White Matter Tractography Atlas provides a probability value and was constructed by using a different age group of subjects and registration procedure. Thus, this approach does not account for multiple fiber tracts within a single voxel. The differences in the registration procedure and subject sample may potentially induce errors. However, this would not be expected to bias the results given that the same procedure is used in both autism and control groups. Most important is that the autism subjects, who have aberrant long-range connections, also may have different fiber connections. Therefore, using the tractography atlas constructed from neurotypical subjects may potentially also introduce tract errors.
Conclusions
This study provides evidence of reduced FA along numerous long-range fiber tracts in ASD, supporting the existence of reduced long-range connectivity. The most severely affected association tracts include the inferior fronto-occipital fasciculus and superior longitudinal fasciculus, both of which have important implications in language and social information processing. The distribution of these findings points to a widespread abnormality in long-range connections that may not only contribute to both core and associated symptoms but also the well-known heterogeneity of this spectrum of disorders. Most importantly, however, is the widely different degree to which individual tracts are affected, raising the question of whether a unique disconnectivity fingerprint may be ascribed to ASD. Although speculative, this neural phenotype may consist of widespread fiber tract compromise with bias toward the inferior fronto-occipital fasciculus, superior longitudinal fasciculus, and corpus callosum. However, additional work is clearly needed before any conclusions can be made regarding an autism-specific brain phenotype. These future studies should implement a standardized image collection, processing, and analysis protocol and include large samples of individuals with autism subjects matched with developmentally delayed individuals without autism. A customized tractography atlas should be implemented for voxel labeling to reduce the probability of tract errors.
Acknowledgments
We acknowledge the help of Caitlin Hudac and Brent Vander Wyk, with data assembly. We are grateful for the effort and commitment of the participants and their families in this study.
Abbreviations
- AMY
amygdala
- ASD
autism spectrum disorders
- ATR
anterior thalamic radiation
- BCC
body of corpus callosum
- CNG
cingulum
- CST
corticospinal tract
- DAS
Differential Abilities Scale
- DTI
diffusion tensor imaging
- FA
fractional anisotropy
- FDT
FMRIB Diffusion Toolbox
- FFA
fusiform face area
- FMAJ
forceps major
- FMIN
forceps minor
- fMRI
functional MR imaging
- FMRIB
Oxford Centre for Functional Magnetic Resonance Imaging of the Brain
- FSL
FMRIB Software Library
- GRAPPA
generalized autocalibrating partially parallel acquisition
- IFOF
inferior fronto-occipital fasciculus
- ILF
inferior longitudinal fasciculus
- JHU
Johns Hopkins University
- MNI
Montreal Neurologic Institute
- SLF
superior longitudinal fasciculus
- SRS
Social Responsiveness Scale
- SSC
somatosensory cortex
- STS
superior temporal sulcus
- TBSS
Tract-Based Spatial Statistics
- TDC
typically developing control
- TPJ
temporal parietal junction
- UNF
uncinate fasciculus
- VMPC
ventromedial prefrontal cortex
Footnotes
Disclosures: Roger J. Jou, Research Support: Pfizer, Detail: ANA/Pfizer Fellowships in Clinical Practice from Pfizer's Medical and Academic Partnership program: This program is intended to contribute to the career development of nurses, pharmacists, or physicians who have completed their clinical training and have elected to specialize as clinicians-scientists. Award period: 7/1/10-6/30/12. Fred R. Volkmar, Research Support: National Institute of Mental Health, National Institute of Child Health and Human Development, Details: Federal grant support (principal investigator of 2 program project grants), Other Financial Relationships: Editor–Journal, Details: Journal of Autism and Developmental Disorders, Springer.
This work was supported by grants from the National Institute of Mental Health, Autism Speaks, and the Simons Foundation (SFARI 95489 to K.A.P.). This research also was made possible through 2008–2009 American Academy of Child & Adolescent Psychiatry Pilot Research Award for Junior Faculty and Child Psychiatry Fellows supported by Lilly USA, LLC; and 2010–2012 ANA/Pfizer Fellowships in Clinical Practice from Pfizer's Medical and Academic Partnership program.
Paper previously presentated at: 2010 International Meeting for Autism Research; May 20–22, 2010; Philadelphia, Pennsylvania.
References
- 1. Courchesne E, Pierce K. Why the frontal cortex in autism might be talking only to itself: local over-connectivity but long-distance disconnection. Curr Opin Neurobiol 2005; 15: 225–30 [DOI] [PubMed] [Google Scholar]
- 2. Geschwind DH, Levitt P. Autism spectrum disorders: developmental disconnection syndromes. Curr Opin Neurobiol 2007; 17: 103–11 [DOI] [PubMed] [Google Scholar]
- 3. Minshew NJ, Williams DL. The new neurobiology of autism: cortex, connectivity, and neuronal organization. Arch Neurol 2007; 64: 945–50 [DOI] [PMC free article] [PubMed] [Google Scholar]
- 4. Piven J, Arndt S, Bailey J, et al. An MRI study of brain size in autism. Am J Psychiatry 1995; 152: 1145–49 [DOI] [PubMed] [Google Scholar]
- 5. Courchesne E, Karns CM, Davis HR, et al. Unusual brain growth patterns in early life in patients with autistic disorder: an MRI study. Neurology 2001; 57: 245–54 [DOI] [PubMed] [Google Scholar]
- 6. Herbert MR, Ziegler DA, Makris N, et al. Localization of white matter volume increase in autism and developmental language disorder. Ann Neurol 2004; 55: 530–40 [DOI] [PubMed] [Google Scholar]
- 7. Jou RJ, Mateljevic N, Minshew NJ, et al. Reduced central white matter volume in autism: implications for long-range connectivity. Psychiatry Clin Neurosci 2010; 65: 98–101 [DOI] [PMC free article] [PubMed] [Google Scholar]
- 8. Castelli F, Frith C, Happe F, et al. Autism, Asperger syndrome and brain mechanisms for the attribution of mental states to animated shapes. Brain 2002; 125: 1839–49 [DOI] [PubMed] [Google Scholar]
- 9. Cherkassky VL, Kana RK, Keller TA, et al. Functional connectivity in a baseline resting-state network in autism. Neuroreport 2006; 17: 1687–90 [DOI] [PubMed] [Google Scholar]
- 10. Just MA, Cherkassky VL, Keller TA, et al. Cortical activation and synchronization during sentence comprehension in high-functioning autism: evidence of underconnectivity. Brain 2004; 127: 1811–21 [DOI] [PubMed] [Google Scholar]
- 11. Villalobos ME, Mizuno A, Dahl BC, et al. Reduced functional connectivity between V1 and inferior frontal cortex associated with visuomotor performance in autism. Neuroimage 2005; 25: 916–25 [DOI] [PMC free article] [PubMed] [Google Scholar]
- 12. Barnea-Goraly N, Kwon H, Menon V, et al. White matter structure in autism: preliminary evidence from diffusion tensor imaging. Biol Psychiatry 2004; 55: 323–26 [DOI] [PubMed] [Google Scholar]
- 13. Ben Bashat D, Kronfeld-Duenias V, Zachor DA, et al. Accelerated maturation of white matter in young children with autism: a high b value DWI study. Neuroimage 2007; 37: 40–47 [DOI] [PubMed] [Google Scholar]
- 14. Catani M, Jones DK, Daly E, et al. Altered cerebellar feedback projections in Asperger syndrome. Neuroimage 2008; 41: 1184–91 [DOI] [PubMed] [Google Scholar]
- 15. Pugliese L, Catani M, Ameis S, et al. The anatomy of extended limbic pathways in Asperger syndrome: a preliminary diffusion tensor imaging tractography study. Neuroimage 2009; 47: 427–34 [DOI] [PubMed] [Google Scholar]
- 16. Thakkar KN, Polli FE, Joseph RM, et al. Response monitoring, repetitive behaviour and anterior cingulate abnormalities in autism spectrum disorders (ASD). Brain 2008; 131: 2464–78 [DOI] [PMC free article] [PubMed] [Google Scholar]
- 17. Shukla DK, Keehn B, Muller RA. Tract-specific analyses of diffusion tensor imaging show widespread white matter compromise in autism spectrum disorder. J Child Psychol Psychiatry 2011; 52: 286–95 [DOI] [PMC free article] [PubMed] [Google Scholar]
- 18. Mori S, Zhang J. Principles of diffusion tensor imaging and its applications to basic neuroscience research. Neuron 2006; 51: 527–39 [DOI] [PubMed] [Google Scholar]
- 19. Smith SM, Jenkinson M, Johansen-Berg H, et al. Tract-based spatial statistics: voxelwise analysis of multi-subject diffusion data. Neuroimage 2006; 31: 1487–505 [DOI] [PubMed] [Google Scholar]
- 20. Barnea-Goraly N, Lotspeich LJ, Reiss AL. Similar white matter aberrations in children with autism and their unaffected siblings: a diffusion tensor imaging study using tract-based spatial statistics. Arch Gen Psychiatry 2010; 67: 1052–60 [DOI] [PubMed] [Google Scholar]
- 21. Cheng Y, Chou KH, Chen IY, et al. Atypical development of white matter microstructure in adolescents with autism spectrum disorders. Neuroimage 2010; 50: 873–82 [DOI] [PubMed] [Google Scholar]
- 22. Kumar A, Sundaram SK, Sivaswamy L, et al. Alterations in frontal lobe tracts and corpus callosum in young children with autism spectrum disorder. Cereb Cortex 2010; 20: 2103–13 [DOI] [PubMed] [Google Scholar]
- 23. Jou RJ, Jackowski AP, Papademetris X, et al. Diffusion tensor imaging in autism spectrum disorders: preliminary evidence of abnormal neural connectivity. Aust N Z J Psychiatry 2011; 45: 153–62 [DOI] [PMC free article] [PubMed] [Google Scholar]
- 24. Martino J, Brogna C, Robles SG, et al. Anatomic dissection of the inferior fronto-occipital fasciculus revisited in the lights of brain stimulation data. Cortex 2010; 46: 691–99 [DOI] [PubMed] [Google Scholar]
- 25. Frazier TW, Hardan AY. A meta-analysis of the corpus callosum in autism. Biol Psychiatry 2009; 66: 935–41 [DOI] [PMC free article] [PubMed] [Google Scholar]
- 26. APA. Diagnostic and Statistical Manual of Mental Disorders, 4th edition, text revision (DSM-IV-TR). Washington, DC: American Psychiatric Association; 2000 [Google Scholar]
- 27. Lord C, Rutter M, Le Couteur A. Autism Diagnostic Interview-Revised: a revised version of a diagnostic interview for caregivers of individuals with possible pervasive developmental disorders. J Autism Dev Disord 1994; 24: 659–85 [DOI] [PubMed] [Google Scholar]
- 28. Lord C, Rutter M, Goode S, et al. Autism Diagnostic Observation Schedule: a standardized observation of communicative and social behavior. J Autism Dev Disord 1989; 19: 185–212 [DOI] [PubMed] [Google Scholar]
- 29. Elliott CD. Differential Ability Scale: Introductory and Technical Manual. San Antonio: The Psychological Corporation; 1990 [Google Scholar]
- 30. Constantino JN. The Social Responsiveness Scale. Los Angeles: Western Psychological Services; 2002. [Google Scholar]
- 31. Smith SM, Jenkinson M, Woolrich MW, et al. Advances in functional and structural MR image analysis and implementation as FSL. Neuroimage 2004; 23: S208–19 [DOI] [PubMed] [Google Scholar]
- 32. Smith SM, Nichols TE. Threshold-free cluster enhancement: addressing problems of smoothing, threshold dependence and localisation in cluster inference. Neuroimage 2009; 44: 83–98 [DOI] [PubMed] [Google Scholar]
- 33. Fischl B, van der Kouwe A, Destrieux C, et al. Automatically parcellating the human cerebral cortex. Cereb Cortex 2004; 14: 11–22 [DOI] [PubMed] [Google Scholar]
- 34. Hua K, Zhang J, Wakana S, et al. Tract probability maps in stereotaxic spaces: analyses of white matter anatomy and tract-specific quantification. Neuroimage 2008; 39: 336–47 [DOI] [PMC free article] [PubMed] [Google Scholar]
- 35. Innocenti GM, Ansermet F, Parnas J. Schizophrenia, neurodevelopment and corpus callosum. Mol Psychiatry 2003; 8: 261–74 [DOI] [PubMed] [Google Scholar]
- 36. Di Paola M, Spalletta G, Caltagirone C. In vivo structural neuroanatomy of corpus callosum in Alzheimer's disease and mild cognitive impairment using different MRI techniques: a review. J Alzheimers Dis 2010; 20: 67–95 [DOI] [PubMed] [Google Scholar]
- 37. Bellani M, Yeh PH, Tansella M, et al. DTI studies of corpus callosum in bipolar disorder. Biochem Soc Trans 2009; 37: 1096–98 [DOI] [PubMed] [Google Scholar]
- 38. Philippi CL, Mehta S, Grabowski T, et al. Damage to association fiber tracts impairs recognition of the facial expression of emotion. J Neurosci 2009; 29: 15089–99 [DOI] [PMC free article] [PubMed] [Google Scholar]
- 39. Hobson RP. The autistic child's appraisal of expressions of emotion: a further study. J Child Psychol Psychiatry 1986; 27: 671–80 [DOI] [PubMed] [Google Scholar]
- 40. Keller TA, Kana RK, Just MA. A developmental study of the structural integrity of white matter in autism. Neuroreport 2007; 18: 23–27 [DOI] [PubMed] [Google Scholar]
- 41. Sahyoun CP, Belliveau JW, Mody M. White matter integrity and pictorial reasoning in high-functioning children with autism. Brain Cogn 2010; 73: 180–88 [DOI] [PMC free article] [PubMed] [Google Scholar]
- 42. Catani M, Jones DK, Ffytche DH. Perisylvian language networks of the human brain. Ann Neurol 2005; 57: 8–16 [DOI] [PubMed] [Google Scholar]
- 43. Wernicke C. Der Aphatische Symptomencomplex: Eine Psychologische Studie auf Anatomischer Basis. Breslau, Germany: Cohn and Weigert; 1874 [Google Scholar]
- 44. Fletcher PT, Whitaker RT, Tao R, et al. Microstructural connectivity of the arcuate fasciculus in adolescents with high-functioning autism. Neuroimage 2010; 51: 1117–25 [DOI] [PMC free article] [PubMed] [Google Scholar]
- 45. Kaiser MD, Hudac CM, Shultz S, et al. Neural signatures of autism. Proc Natl Acad Sci U S A 2010; 107: 21223–28 [DOI] [PMC free article] [PubMed] [Google Scholar]
- 46. Cheung C, Chua SE, Cheung V, et al. White matter fractional anisotrophy differences and correlates of diagnostic symptoms in autism. J Child Psychol Psychiatry 2009; 50: 1102–12 [DOI] [PubMed] [Google Scholar]
- 47. Muller RA. The study of autism as a distributed disorder. Ment Retard Dev Disabil Res Rev 2007; 13: 85–95 [DOI] [PMC free article] [PubMed] [Google Scholar]