SUMMARY:
CTX is a rare lipid-storage disease. Novel MRS findings from 3 patients, using a short TE, were the presence of lipid peaks at 0.9 and 1.3 ppm in the depth of the cerebellar hemisphere; this might represent an additional marker of disease that is CNS-specific and noninvasive. A decrease in NAA concentration was also detected and attributed to neuroaxonal damage. One patient presented an increase in mIns concentration, pointing to gliosis and astrocytic proliferation.
CTX is a rare metabolic disorder whose main clinical manifestations are juvenile cataracts, chronic diarrhea, and tendinous xanthomas.1–5 It is caused by mutations in the CYP27A1 gene, which codes for sterol 27-hydroxylase, an enzyme essential for bile acid synthesis.2,4 This defect leads to abnormally high levels of cholestanol in various tissues—the biochemical hallmark of CTX.1–5 Treatment is oral administration of chenodeoxycholic acid, which inhibits cholestanol synthesis.5
The most distinctive MR imaging abnormalities are bilateral T2 hyperintensity in the dentate nuclei and adjacent cerebellar white matter.1,6 A previous MRS study disclosed a reduction of the NAA peak and the presence of a lactate peak.6 We studied 3 patients with CTX, attempting to assess possible novel MRS findings, focusing on short-TE acquisitions.
Case Reports
Case 1
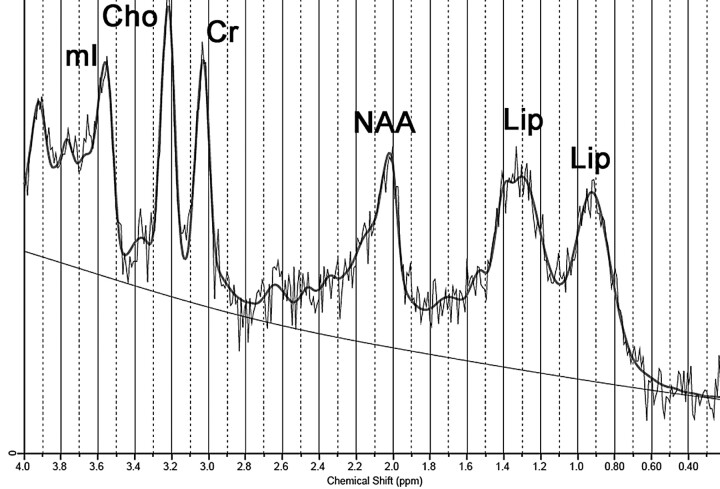
A 22-year-old man, African-Brazilian, a second sibling of first-cousin parents, had normal developmental milestones until 3 years of age, when his motor and cognitive abilities declined. During childhood, he had diagnosed bilateral cataracts and started to present chronic intermittent diarrhea. Clinical examination disclosed bilateral achillean xanthomas. He was severely mentally retarded, dysarthric, with trunk and limb ataxia, spastic gait, and distal limb atrophy. His serum cholestanol level was elevated (118.7 μg/mL; reference value, <6.6 μg/mL). MRS, at 1.5T, was performed on the depth of cerebellar hemisphere, encompassing T2-hyperintense white matter (Fig 1), by using a single-voxel STEAM sequence (TR/TE/mixing time, 1500/30/13.7 ms; 128 acquisitions; and VOI size, 8 cm3). Spectral analysis was performed by using LCModel software (Stephen Provencher, Oakville, Ontario, Canada)7; it demonstrated a decreased NAA level and abnormal lipid peaks at 0.9 and 1.3 ppm (Fig 2 and Table).
Fig 1.
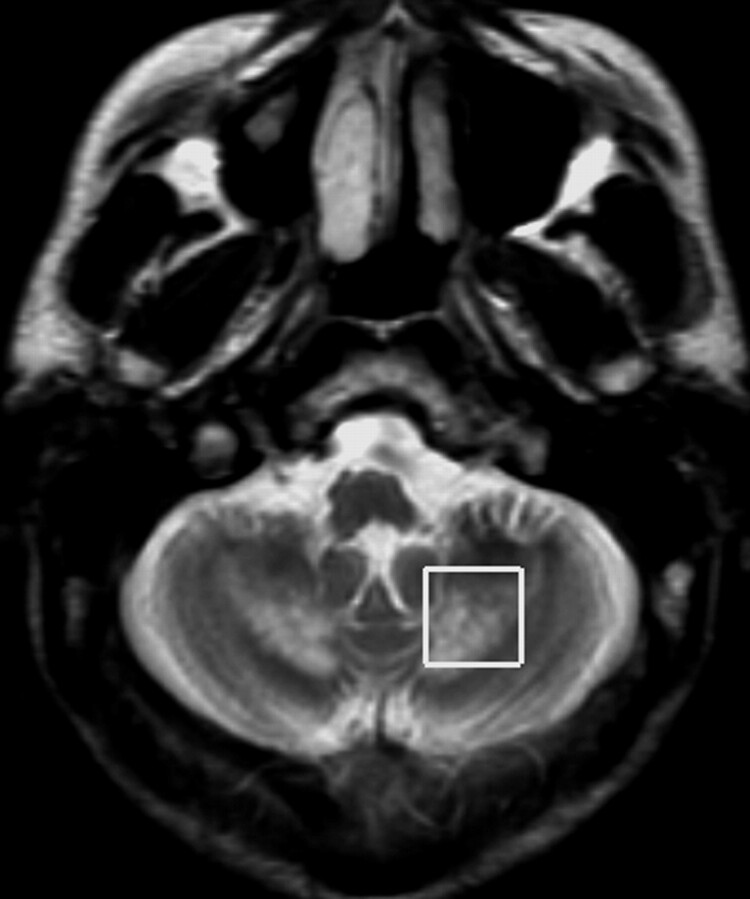
Axial T2-weighted image demonstrates hyperintense lesions encompassing both dentate nuclei and surrounding white matter; this image also shows region-of-interest placement for MRS.
Fig 2.
Spectrum obtained from case 1 (1.5T; STEAM; TR/TE, 1500/30 ms) demonstrates lipid peaks at 0.9 and 1.3 ppm. Notice also a slight decrease in the NAA peak.
Short TE (30–35 ms) single-voxel MRS data: cerebellar tissue and absolute concentrationsa
| B0 (T) | Lip09 (a.u.) | Lip13 (a.u.) | NAA (a.u.) | Cr (a.u.) | Cho (a.u.) | mIns (a.u.) | |
|---|---|---|---|---|---|---|---|
| Controls (n = 10) | 1.5 | 4.93 ± 1.60 | 7.46 ± 4.23 | 6.12 ± 1.69 | 5.87 ± 1.50 | 1.76 ± 0.35 | 5.18 ± 1.55 |
| Case 1 | 1.5 | 12.90 | 22.69 | 2.24 | 4.43 | 1.87 | 5.73 |
| Case 2 | 1.5 | 14.52 | 19.53 | 2.00 | 5.44 | 2.23 | 7.32 |
| Case 2 | 3.0 | 14.33 | 12.99 | 1.83 | 5.95 | 2.16 | 8.47 |
| Case 3 | 3.0 | 12.62 | 13.43 | 4.80 | 6.68 | 2.36 | 5.09 |
Metabolite values from controls are expressed as mean ± SD. Absolute metabolite concentrations are expressed as i.u., scaled to internal water signal. Control values were obtained at 1.5T from a healthy group of 10 subjects (mean age, 17 ± 4 years).
Case 2
A 47-year-old man, who was the third of 6 siblings of nonconsanguineous parents from Okinawa Island, Japan, had an infancy-onset progressive decline of motor and cognitive abilities. He had no history of chronic diarrhea or lens opacities. Clinical examination disclosed achillean, plantar, and elbow xanthomas. He was profoundly demented, wheelchair-bound, anarthric, drooling, and totally dependent for daily activities. He had limb spasticity and ataxia. His serum cholestanol level was only slightly elevated (9.1 μg/mL).
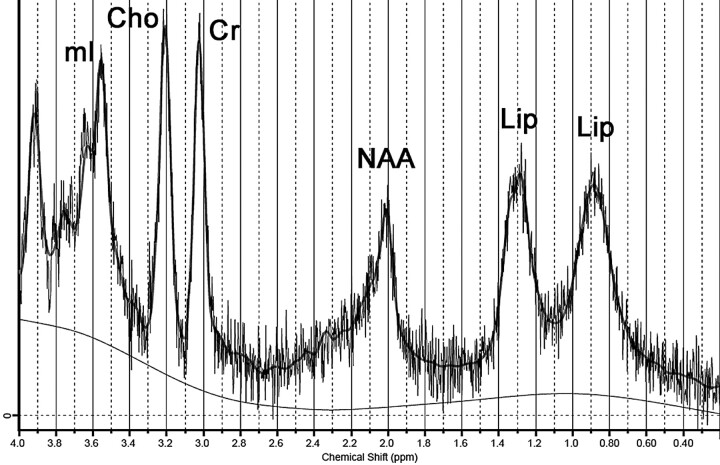
Cerebellar MRS was performed twice, 3 years apart, one time at initial diagnosis (1.5T) and the other during follow-up (3T). Parameters of first examination were similar to those of case 1; his last MRS examination was performed with a single-voxel PRESS sequence (TR/TE, 1871/35 ms; 96 acquisitions; and VOI size, 8 cm3). The same spectral analysis disclosed, in both examinations, markedly decreased NAA levels, high mIns concentrations, and the same abnormal lipid peaks (Fig 3 and Table).
Fig 3.
Spectrum obtained from case 2 (3T; PRESS; TR/TE, 1871/35 ms) demonstrates lipid peaks at 0.9 and 1.3 ppm. Notice also a marked decrease in the NAA peak and an increase in the mIns peak.
Case 3
A 35-year-old man, who is the fifth sibling of case 2, had normal developmental milestones. He started presenting progressive spastic gait and muscle cramps at age 28. He finished high school but, since early childhood, had chronic intermittent diarrhea and bilateral achillean xanthomas. Neurologic examination disclosed no cognitive abnormality, mild dysarthria, and spastic gait. Mild lower limb distal atrophy was also detected. His serum cholestanol level was elevated (61.5 μg/mL).
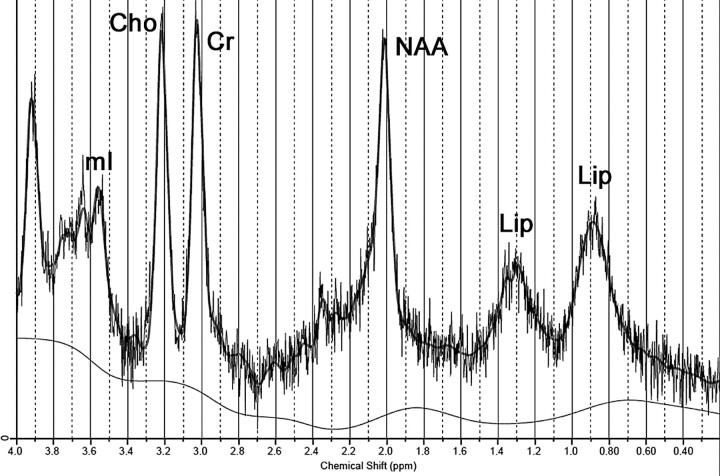
Cerebellar MRS, performed at 3T, in the same way as in case 2, showed a slight decrease in NAA level and also the same abnormal lipid peaks (Fig 4 and Table).
Fig 4.
Spectrum obtained from case 3 (3T; PRESS; TR/TE, 1871/35 ms) demonstrates lipid peaks at 0.9 and 1.3 ppm. Notice also a slight trend toward a decrease in the NAA peak.
Discussion
Neuropathologic findings in CTX include demyelination and gliosis in the cerebellar white matter and corticospinal tracts, with multiple dispersed lipid crystal clefts, the consequence of accumulation of cholesterol and cholestanol in affected tissues.8
In this study, MRS showed a decrease in NAA concentration, which was similar to that previously reported6; the decrease can be interpreted as the expression of neuronal damage,6 because deposition of cholestanol seems to be neurotoxic.8 The magnitude of decrease in our sample roughly paralleled clinical impairment; case 2 was the most affected.
Case 2 also presented an increase in mIns levels. If one assumes that mIns represents a glial marker,9 the increase points to the well-known gliosis and astrocytic proliferation.8
A previously unreported finding was the presence of abnormal lipid peaks detected at 0.9 and 1.3 ppm. One MRS study available in patients with CTX used a long TE (272 ms),6 probably precluding identification of these lipid peaks, which usually have short T2s and do not appear in long-TE spectra.10
Lipid peaks are not detected in normal tissue. Although it is speculative, their presence in CTX can have 2 explanations. On one hand, they can represent membrane breakdown and can precede histologic necrosis, as seen in other diseases.9 On the other hand, they can be the surrogate markers of the major lipid storage that occurs in this disease.8
Some aspects reinforce the hypothesis that at least part of these peaks represent abnormal lipid accumulation. In serum samples from patients with CTX, by using high-resolution nuclear MRS, peaks assigned to cholestanol were found at 0.645 and 0.817 ppm.11 Also, besides the more commonly found abnormal lipid peaks detected at 0.9 and 1.3 ppm, which correspond to methyl (CH3) and the methylene group (CH2) respectively,12 other lipid protons resonate in these areas, as is the case for cholesterol.11
The apparent lack of correlation between the 1.3 and 0.9 ppm peaks may point to a more complex pattern of lipid deposit. If both represented the same single lipid molecule in all patients, a constant ratio between both peaks would be expected, which is not the case. Some similar findings have already emerged from MRS data of other diseases, which correspond with lipid accumulation in brain tissue, such as Sjögren-Larsson syndrome.10
This case report has limitations. The sample size is small, though this is a rare disease. There are no controls for the 3T spectra, but we believe that all the assumptions made for the 1.5T examinations are also valid for the 3T ones, because MRS examinations from case 2 performed on both MR imaging scanners presented no significant differences. Another point is that lipid-peak detection does not depend heavily on the existence of a control group because these peaks are not present in significant amounts in normal tissue. Finally, we cannot preclude the possibility that lactate may have contributed to the observed resonance at 1.3 ppm because lactate and lipids are known to overlap in this region. However, if there is any lactate contribution, it is probably negligible because long-TE spectra acquired in our patients revealed a small lactate peak in only 2 of them.
In conclusion, our cases suggest that lipid peaks detected at short-TE MRS in the cerebellum of patients with CTX might represent an additional marker of the disease, which is CNS-specific and noninvasive, with a potential role in monitoring therapy response.
Abbreviations
- a.u.
arbitrary unit
- Cho
choline-containing compounds
- CNS
central nervous system
- Cr
creatine/phosphocreatine
- CTX
cerebrotendinous xanthomatosis
- Lip
lipid
- Lip09
lipid signals at 0.9 ppm
- Lip13
lipid signals at 1.3 ppm
- mIns
myo-inositol
- MRS
MR spectroscopy
- NAA
N-acetylaspartate
- PRESS
point-resolved spectroscopy sequence
- STEAM
short echo time stimulated echo acquisition mode
- VOI
volume of interest
References
- 1. Barkhof F, Verrips A, Wesseling P, et al. Cerebrotendinous xanthomatosis: the spectrum of imaging findings and the correlation with neuropathologic findings. Radiology 2000;217:869–76 [DOI] [PubMed] [Google Scholar]
- 2. Verrips A, Hoefsloot LH, Steenbergen GC, et al. Clinical and molecular genetic characteristics of patients with cerebrotendinous xanthomatosis. Brain 2000;123:908–19 [DOI] [PubMed] [Google Scholar]
- 3. Federico A, Dotti MT. Cerebrotendinous xanthomatosis: clinical manifestations, diagnostic criteria, pathogenesis, and therapy. J Child Neurol 2003;18:633–38 [DOI] [PubMed] [Google Scholar]
- 4. Gallus GN, Dotti MT, Federico A. Clinical and molecular diagnosis of cerebrotendinous xanthomatosis with a review of the mutations in the CYP27A1 gene. Neurol Sci 2006;27:143–49 [DOI] [PubMed] [Google Scholar]
- 5. Berginer VM, Gross B, Morad K, et al. Chronic diarrhea and juvenile cataracts: think cerebrotendinous xanthomatosis and treat. Pediatrics 2009;123:143–47 [DOI] [PubMed] [Google Scholar]
- 6. De Stefano N, Dotti MT, Mortilla M, et al. Magnetic resonance imaging and spectroscopic changes in brains of patients with cerebrotendinous xanthomatosis. Brain 2001;124:121–31 [DOI] [PubMed] [Google Scholar]
- 7. Provencher SW. Estimation of metabolite concentrations from localized in vivo proton NMR spectra. Magn Reson Med 1993;30:672–79 [DOI] [PubMed] [Google Scholar]
- 8. Pilo de la Fuente B, Ruiz I, Lopez de Munain A, et al. Cerebrotendinous xanthomatosis: neuropathological findings. J Neurol 2008;255:839–42 [DOI] [PubMed] [Google Scholar]
- 9. Gillard JH, Waldman A, Barker P. Clinical MR neuroimaging: diffusion, perfusion, and spectroscopy. Cambridge, UK: Cambridge University Press; 2005:7–26 [Google Scholar]
- 10. Willemsen MA, Van Der Graaf M, Van Der Knaap MS, et al. MR imaging and proton MR spectroscopic studies in Sjogren-Larsson syndrome: characterization of the leukoencephalopathy. AJNR Am J Neuroradiol 2004;25:649–57 [PMC free article] [PubMed] [Google Scholar]
- 11. Oostendorp M, Engelke UF, Willemsen MA, et al. Diagnosing inborn errors of lipid metabolism with proton nuclear magnetic resonance spectroscopy. Clin Chem 2006;52:1395–405 [DOI] [PubMed] [Google Scholar]
- 12. Maheshwari SR, Fatterpekar GM, Castillo M, et al. Proton MR spectroscopy of the brain. Semin Ultrasound CT MR 2000;21:434–51 [DOI] [PubMed] [Google Scholar]


