Abstract
BACKGROUND AND PURPOSE:
In patients with carotid stenosis or occlusion, cerebral blood could be supplied through collateral pathways to improve regional blood flow and protect against ischemic events. The contribution of collaterals from the ICA can be assessed by depiction of vascular perfusion territories with ASL. However, so far there is no method available to evaluate the collateral perfusion territory from the ECA in MR imaging. In this study, we present a new labeling scheme based on VE-ASL to quantitatively assess the perfusion territory of the ECA.
MATERIALS AND METHODS:
A new labeling approach with a Hadamard encoding scheme was developed to label major arteries, especially the ECA. Twelve healthy subjects with normal cerebrovascular anatomy were examined to demonstrate their perfusion territories. Eight patients with carotid artery stenosis or occlusion were assessed before and after surgery to show changes of their collateral blood supply.
RESULTS:
The proposed method enables assessment of the perfusion territories of the ECA. Good agreement was found between the vascular territories and normal cerebrovascular anatomy in healthy subjects. For the patients with carotid stenosis or occlusion, our noninvasive results provided information on collateral flow comparable with that from DSA. Their collateral flows from the ECA, moreover, could be quantitatively estimated pre- and postoperatively.
CONCLUSIONS:
The modified approach has been validated by the consistency of collateral perfusion territories with cerebrovascular anatomy, and quantitative assessment of collaterals proved useful for assisting in evaluating therapeutic interventions.
Collateral circulation is a critical determinant of cerebral ischemia in carotid stenosis or occlusion, providing alternative ways to stabilize CBF in the ischemic region. In general, the sources of collateral circulation can be divided into 2 pathways: the principal collateral through the arteries of the circle of Willis and the secondary pathways consisting of the ECA via the ophthalmic artery and leptomeningeal vessels. Once the primary circulation fails, the secondary collateral pathways are presumed to be recruited.1–6 In particular, the recruitment of ophthalmic or leptomeningeal collateral pathways may be associated with hemodynamic impairment in the brain.7,8
Assessment of collateral circulation plays an important role in the selection of treatment strategies for cerebrovascular disease therapy, and the perfusion changes of collateral flow could be used to evaluate therapeutic interventions. In practice, imaging techniques such as DSA can show qualitatively the presence of collateral flow, but the actual contribution of collateral flow to brain perfusion cannot be quantified.9–12 In this regard, advanced imaging modalities to visualize perfusion maps of collaterals have considerable value for facilitating treatment and evaluating cerebrovascular stenosis or occlusion.
ASL,13–18 by using magnetically labeled protons in arterial water as an endogenous tracer, has been widely used in MR imaging to visualize perfusion territories of major carotid arteries noninvasively. Recently, VE-ASL19,20 was introduced as a more time-efficient method for mapping multiple vascular territories and thereby inferring the status of collaterals. A previous study21 has demonstrated that VE-ASL could show the presence and distal flow of collaterals within ICA stenosis. However, the collateral flow developing from the ECA cannot be detected by VE-ASL.
The purpose of this study was to investigate the feasibility of noninvasively mapping the perfusion territory of collateral flow from the ECA. We developed a new labeling scheme based on the VE-ASL technique to selectively label the ECA in addition to the right and left ICAs and VAs. In patients undergoing carotid surgery, pre- and postoperative collateral flows from the ECA are characterized to quantitatively estimate the surgery outcome.
Materials and Methods
Subjects and Consent
Twelve healthy subjects (6 men, 6 women; 22–67 years of age) without known cerebrovascular disease and 8 patients (5 men, 3 women; 46–63 years of age) with carotid stenosis or occlusion were examined in this study. Carotid stent placement was performed on the right ICA in 1 patient and the VAs of another patient. ECIC bypass was performed on the other 6. The patients were scanned twice: 1 week before surgery and 2 weeks after surgery. The study protocol was approved by the ethics committee, and written informed consent was obtained from all participants.
DSA
All DSA diagnoses were obtained by using a biplane angiography unit (Advantx; GE Healthcare, Milwaukee, Wisconsin). Each vessel angiogram was obtained in 2 projections (frontal and lateral), in which 6–8 mL of contrast material (Ultravist [300 mg of iopromide per milliliter]; Schering, Berlin, Germany) was injected at a flow rate of 4 mL/s.
MR Imaging
All examinations were conducted on a 3T whole-body system (High Definition; GE Healthcare) by using a commercial 8-channel head radio-frequency coil array and a body coil for radio-frequency transmission.
3D Time-of-Flight MRA
The circle of Willis was visualized with an MRA sequence: TR, 21 ms; TE, 3.2 ms; flip angle, 15°; 1 signal intensity acquired; 176 sections; section thickness, 1.6 mm with a section overlap of 0.8 mm; FOV, 240 mm; matrix size, 384; acquisition time, 5 minutes. Then a reconstruction was made in 3 orthogonal directions with a maximum-intensity-projection algorithm.
Modified VE-ASL Based on Hadamard Encoding
In Hadamard encoding, the relative phase of an individual vessel is set corresponding to rows of the Hadamard matrix. After acquisition of images corresponding to every row, a reconstruction algorithm is applied to separate the perfusion territories of vessels. The Hadamard encoding process can be described mathematically by
where y is the resulting signal intensities and the Hadamard encoding matrix A and vector x vary with different encoding schemes.
The Hadamard encoding scheme for 3-vessel separation in the original VE-ASL technique20 is as follows:
 |
where R, L, B, and S represent the MR imaging signals of the right ICA (R), left ICA (L), basilar arteries (B), and static tissue (S).
In our study, to encode the contribution of the ECA with separation from the right ICA, left ICA, and VAs, a tagging scheme modifying the original Hadamard matrix was developed. The modified encoding matrix is the following:
 |
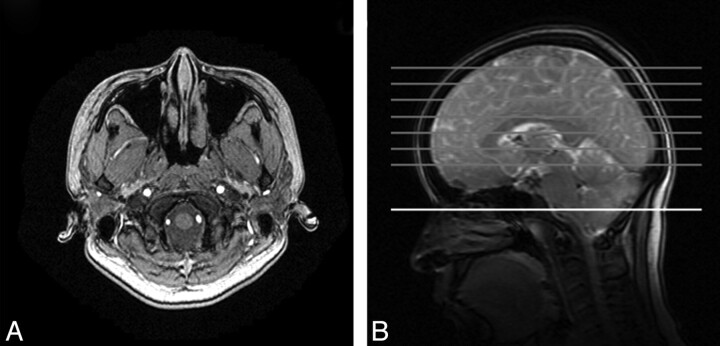
where R, L, V, E, and S in x are the contributions of tagged blood signals from the right ICA (R), left ICA (L), VAs (V), ECA (E), and static tissue (S), respectively, and in the modified encoding matrix A, 1, −1, and 0 represent the inflowing blood of a specific vessel fully relaxed, fully inverted, and saturated, respectively. Thus, the first row of the modified encoding matrix A corresponds to the control state in that all vessels and static tissue are fully relaxed in the labeling plane (Fig 1). The other 3 rows of A, on the other hand, present the steps to encode the perfusion territories of right ICA, left ICA, VAs, and ECA, respectively.
Fig 1.
A, Arrangement of the right ICA, left ICA, VAs, and ECA within the labeling plane seen with MRA. B, Location of the labeling plane (white) and image sections (gray).
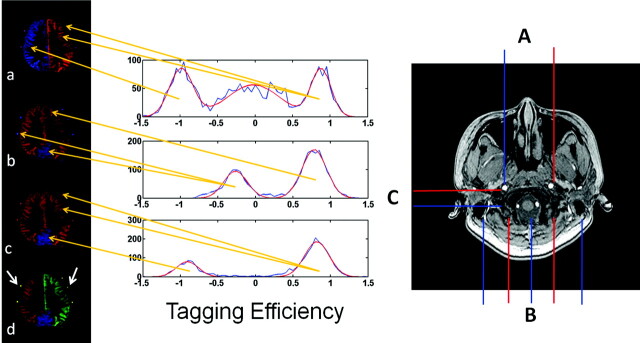
This modification scheme can be interpreted in combination with the images shown in Fig 2 , as the examples obtained by 3 different 2-vessel encoding steps. In the image a, corresponding to the second row of A, the left and right ICAs are separately encoded with high efficiency, but the posterior circulation cannot be separated from the anterior circulation. In image b, the posterior circulation is separated through the third row of the modified encoding matrix A. In image c, the separation is accomplished between the VAs and the ECA by encoding different patterns. Therefore, the combination of the first and third maps (a and c) results in a 3-vessel separation of the right ICA, left ICA, and VAs. Then the perfusion territory of the ECA is extracted by the second and third encoding steps (b and c). As a result, the vascular territories of the right ICA, left ICA, VAs, and ECA are finally separated in a resultant map (d) by using the data from those 3 encoding steps.
Fig 2.
Left: Perfusion territory maps. Images a, b, and c represent the results of 3 scans (right) with different spatial gradient-encoding methods. Image d indicates the integrated results of the perfusion image with encoded vessels. Blood flows contributed by the vessels of the right ICA, left ICA, VAs, and ECA are red, green, blue, and yellow (white arrows), respectively. Center: The histograms (shown in blue) of the calculated tagging efficiencies for each encoding step. Gaussian fits to the peaks in the histograms are red; the center of the Gaussian fits, as the estimated tagging efficiencies for each vessel, are used to reconstruct the modified encoding matrix. The orange arrows originating from the histograms indicate the corresponding labeling vessels whose tagging efficiencies are estimated by the abscissa values of the center of the Gaussian fits (eg, in the first row of the histograms, the center of the Gaussian fit in an abscissa of −1 represents the tagging efficiency of the right ICA, in which the center of the Gaussian fit in nearly an abscissa of 1 represents the tagging efficiency of the left ICA and ECA). Right: The modified tagging geometries. The red and blue lines represent the locations that are marked as contrast (one represents the vessel inverted; the other, the vessel relaxed). A, The right and left ICAs are separated. B, Carotid and vertebral arteries are prominently distinguished. C, The VAs and ECAs are contrasted.
The modified VE-ASL is still based on the PCASL tagging method.22 Within the tagging plane, Gxy is added between radio-frequency pulses along the line from 1 vessel to the other.20 Moreover, Gxy is applied with an alternating sign and an area of π/γb, where b is the distance between 2 targeted vessels (vessel A and B), producing a phase shift of π between them. Under the influence of Gxy, additional phases are generated to keep the radio-frequency pulses always in phase with spins in vessel A. Therefore, spins in vessel A continuously experience adiabatic inversion, and spins in vessel B experience pulses with alternating signs, resulting in a transparent inversion pulse. Consequently, only spins in vessel A experience inversion (−1) and spins in vessel B remain relaxed (1). If the distance from vessel A to another vessel C is n * b/2 (n = 1, 2, 3…), spins in vessel C will be saturated (0). On the basis of actual vascular geometry, the additional gradient pulse is adjusted by the distance between vessels of interest so that ICAs, VAs, and ECA are encoded in a different pattern corresponding to rows of the modified encoding matrix.
The scanning parameters of the modified VE-ASL were as follows: The tagging pulse-train length was 1600 ms, composed of 1640 radio-frequency pulses with a spacing of 960 μs. The postlabeling delay time was set at 1000 ms; TR/TE, 3000/3.4 ms; section thickness/section gap, 8/2 mm; FOV, 240 mm; matrix, 128; a total of 20 signal-intensity averages for each cycle of the encoding scheme; single-shot 2D spiral acquisition with fat saturation; readout length per section, 40 ms. Seven axial imaging sections were also acquired in the caudal-to-cranial direction. The total scanning time was 18.3 minutes: localizer, 1 minute; MRA, 5 minutes; and modified VE-ASL, 4.1 × 3 minutes.
Data Processing and Analysis
Data were processed by using Matlab (MathWorks, Natick, Massachusetts). The perfusion territories, including those of the right ICA, left ICA, VAs, and ECA, were generated by pseudoinversion of the modified encoding matrix.23 As described above, the 4 × 5 modified encoding matrix with the highest SNR efficiency was proposed as the optimal design. However, this 4 × 5 matrix was difficult to realize in pulse-sequence design, and the following 8 × 5 matrix was used to get the same encoding effect. With perfect tagging efficiency, the modified encoding (A) and decoding (A+) matrices for this 4-vessel separation were the following:
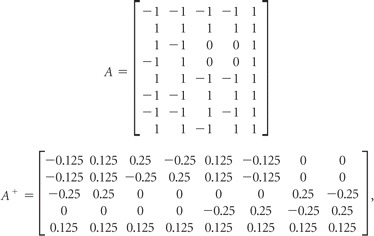 |
where the columns of A still correspond to the right ICA, left ICA, VAs, ECA, and static tissue components, and the rows represent 8 encoding cycles. The first 2 encoding cycles of A are referred to as “tag” and “control” images of whole brain. The following 6 rows are used as three 2-vessel encoding steps (eg, the third and fourth encoding cycles are used as 1 encoding step to distinguish the perfusion territory of the right ICA from that in the left ICA by alternatively placing 1 of these 2 vessels in the tag condition).
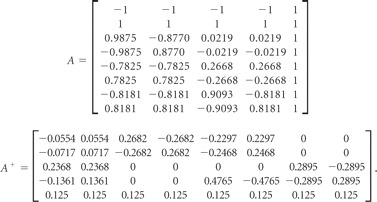
The relative tagging efficiency for each vessel was measured directly from the experimental data20,24 and was used in the reconstruction of the modified encoding matrix to compensate for the calculated deviation caused by various geometry and flow velocity of the vessels of interest. As shown in Fig 2 (center), the tagging efficiencies of vessels were measured per each encoding step (2 encoding cycles). In 1 encoding step, measured tagging efficiency of individual vessels was filled in the relevant position in the modified encoding matrix (the row number was determined by the current encoding step; the column number was related to the corresponding tagging vessel). These become
 |
All images were oriented according to radiologic convention (the left hemisphere of the brain corresponds to the right side of the image).
The general CBF maps were obtained by subtraction of the tagged images from the control images. Then these general CBF maps were combined with modified VE-ASL result maps generated above into 4-color selective CBF maps of the right ICA, left ICA, VAs, and ECA. ROIs were selected manually over “colored” individual vascular territory, covering the approximate extent of each perfusion territory. To quantify CBF, we fitted the signal intensity to the perfusion model as described by Wong,25 with the following values as the physical constants26: α (efficiency of the inversion pulse) = 0.7, T1blood = 1664 ms. Then the mean blood flow was measured in each territory.
Results
Vascular Territory Maps of the ICA and ECA in Healthy Subjects
As an example, the vessel-encoded images from 1 of the healthy subjects are shown in Fig 3 . The first row of Fig 3 gives the results of the right ICA, left ICA, and VAs, indicated by red, green, and blue, respectively. The second row presents the territory of the ECA (in yellow), with the combination of the 3 others above as a background (in gray), which makes the vascular territories of the internal and external carotid arteries clearly displayed.
Fig 3.
Perfusion territory maps of a healthy subject by using modified VE-ASL. The first row is the perfusion territories of the right ICA (red), left ICA (green), and VAs (blue); the second row is the perfusion territories of intracarotid (gray) and extracarotid (yellow) arteries. Note that the bottom section shows flow in the frontal brain region, which appears to be artifacts caused by magnetic inhomogeneities of B0 or eye motion. In the fourth image from the bottom, there is also a hint of ghosting in the white matter of the right hemisphere, which may be caused by the decoding process.
For any healthy subject, the ECA will not supply the intracranial perfusion territories. Our outcome of the vascular territories from the healthy volunteers, as shown in Fig 3, is consistent with that known evidence. The results show that among these subjects, 12 of 12 (100%) possess a rare ICA territory with the ECA supply. In CBF quantification, the intracranial territory receives <1.0 mL/min/100 g from the ECA for each healthy subject.
Modified VE-ASL Results in Patients before and after Surgery
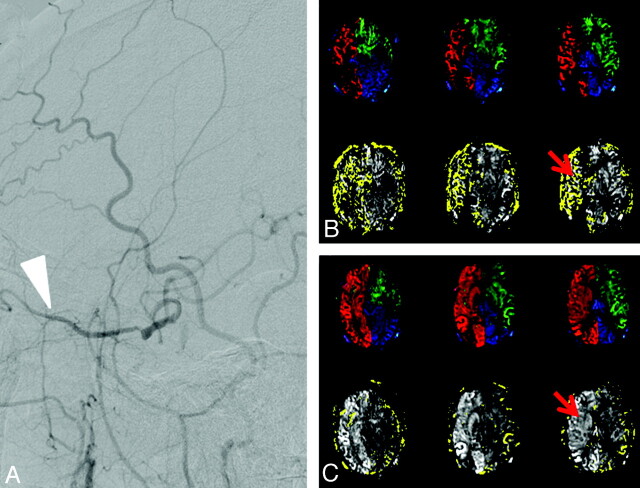
Pre- and postoperative imaging with the modified VE-ASL performed in the patients reveals the hemodynamic changes as well as the improvement of perfusion, as shown in Fig 4 . Being consistent with the DSA findings (Fig 4A), Fig 4B displays the blood flow from the ECA to supply the right hemisphere before surgery. Figure 4C gives the results after carotid stent placement, with much less perfusion of the ECA (in yellow) in the right hemisphere. For comparison, the quantitative CBFs of the right ICA, left ICA, VAs, and ECA before and after carotid stent placement are listed in the Table.
Fig 4.
Sagittal DSA results (left) and vascular territories (right) in a patient undergoing carotid stent placement for right ICA stenosis. A, DSA results of the patient before surgery show that there is collateral flow from the ECA (white arrow). B, Preoperatively, the collateral supply is manifested as the ECA supply to the right ICA territory (red arrow). C, Postoperatively, there is normalization of the right ICA perfusion with a corresponding reduction of collateral supply (red arrow). Hyperperfusion of the right hemisphere after stent placement is also clearly shown.
Quantification of CBF of RICA, LICA, VAs, and ECA before and after surgery using modified VE-ASL
| Subject | Symptom | Scanning Time | CBFa |
|||
|---|---|---|---|---|---|---|
| RICA | LICA | VAs | ECA | |||
| 1 | RICA severe stenosis | Before ICA stenting, | 14.3 | 28.0 | 26.4 | 25.2 |
| after ICA stenting | 42.2 | 31.3 | 29.1 | 2.0 | ||
| 2b | LICA occlusion, VA stenosis | Before VA stenting, | 15.8 | 0.0 | 16.5 | 18.9 |
| after VA stenting | 15.8 | 0.0 | 17.5 | 12.2 | ||
| 3 | LICA occlusion | Before bypass, | 22.1 | 0.0 | 19.3 | 0.0 |
| after bypass | 20.5 | 0.0 | 19.1 | 12.3 | ||
| 4 | RMCA occlusion | Before bypass, | 14.4 | 23.3 | 18.9 | 0 |
| after bypass | 25.8 | 21.5 | 17.5 | 19.1 | ||
| 5 | RICA occlusion | Before bypass, | 21.9 | 17.6 | 23.6 | 0 |
| after bypass | 13.7 | 14.9 | 16.4 | 20.2 | ||
| 6 | RICA occlusion, VA severe stenosis | Before bypass, | 0 | 30.8 | 31.5 | 0 |
| after bypass | 0 | 19.4 | 22.7 | 17.3 | ||
| 7c | RICA occlusion | Before bypass, | ||||
| after bypass | 17.3 | 17.2 | 21.5 | 11.8 | ||
| 8c | RMCA severe stenosis | Before bypass, | ||||
| after bypass | 0 | 15.2 | 14.2 | 20.5 | ||
Note:—RMCA indicates the right MCA; RICA, right ICA; LICA, left ICA.
CBF is mL/min/100 g.
Before VA stenting treatment, the patient was treated with bypass surgery.
Data of subjects 7 and 8 before bypass surgery are missing.
Before carotid stent placement, the right ACA and MCA territories received 14.3 mL/min/100 g of blood flow from the right ICA and 25.2 mL/min/100 g from the ECA. The supply of the ECA to the right ICA was interpreted as collateral flow compensating for the impairment of right ICA perfusion.
Postoperatively, the blood flow of the right hemisphere of the brain was apparently higher than that before carotid stent placement. The right ICA supply had increased from 14.3 to 42.2 mL/min/100 g. Meanwhile, the ECA supply to the right ICA territory had decreased from 25.2 to 2.0 mL/min/100 g. After surgery, moreover, the blood flow of the right ICA perfusion territory was even higher than that of the left ICA territory, which was consistent with hyperperfusion after carotid stent placement.
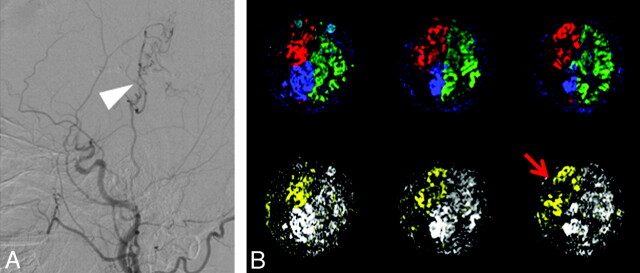
Perfusion territories of a patient with right MCA occlusion undergoing bypass surgery are shown in Fig 5 . After the bypass surgery, a blood flow of 11.8 mL/min/100 g from the ECA was detected to supply the right ICA perfusion territory as collateral flow, in keeping with the DSA results.
Fig 5.
Sagittal DSA results (A) and vascular territories (B) in a patient with right MCA occlusion after ECIC bypass surgery. Postoperatively, the blood flow from the ECA is detected (red arrow), in agreement with the collaterals shown on DSA (white arrow).
The CBF values of the other patients who underwent stent placement or bypass surgery are listed also in the Table, which shows obvious changes of the vascular territories before and after the operations.
Discussion
Discrimination of vascular territories has been the subject of interest for many years. Previous studies16,27 have developed a labeling approach based on pulsed ASL techniques. That imaging technique can be used to selectively map the flow territories of the left ICA, right ICA, and posterior circulation. However, the geometric confounders such as vascular curvature could interfere with the labeling plane. In contrast, VE-ASL, as an alternative approach for vessel differentiation, relying only on the distance between arteries determined by vascular anatomies,20,24 is demonstrated to be able to significantly improve vessel discrimination with the corrections of vessel-specific labeling efficiencies. In this study, the developed method modifies the encoding scheme of VE-ASL, to make it possible to quantitatively depict not only internal but also external carotid territory maps.
Three primary findings are included in our study. First, the perfusion territory of the ECA obtained by the modified VE-ASL is consistent with cerebrovascular anatomy in healthy volunteers; this finding validates the method from the point of view of anatomy. Our quantitative examinations revealed that the intracranial territory of each healthy volunteer received blood flow of <1.0 mL/min/100 g from the ECA, which deviates from most supposed cases of no blood supply from the ECA. Although there is a discrepancy between the measured results and the physiologic explanation, the CBF values measured in healthy volunteers are at a very low level.
Second, the novel encoding method could improve the detection of collateral flow from the ECA for patients with carotid stenosis or occlusion. Collateral circulation can improve regional blood flow to protect against ischemic events in patients with carotid stenosis or occlusion. For patients with carotid stenosis or occlusion, understanding the status of their collateral circulation plays a pivotal role in the guidance and evaluation of therapeutic interventions.1–6 Currently, DSA, considered as the reference standard, is invasive, and sometimes causes neurologic complications.9,10 In our study, both the presence and actual contribution of collaterals were assessed, and the variations in ECA supply territory were detectable effectively. For all subjects, the quantified contributions of individual arteries to each vascular territory could be obtained in terms of blood flow per unit of tissue. In this sense, the method provides collateral information similar to that of conventional angiography.
Third, the collateral flow changes can be quantified to reflect pre- and postoperative vascular territory supplies, which provide a valuable insight for the assessment of cerebrovascular surgery. Assessment of the perfusion changes of collateral flow could be used in the selection of treatment strategies and evaluation of therapeutic interventions.
Some previous studies have suggested that by using the DSC MR perfusion technique, the hemodynamic status after surgery can be evaluated by the changes in cerebral perfusion.28–30 Although DSC MR perfusion can offer a whole-brain perfusion map with a high SNR, the technique cannot provide regional perfusions supplied by different vessels. In the present study, we provide regional perfusion changes offered by various vessels enabled by the modified VE-ASL, which can be used to assess the outcome of therapeutic interventions. Moreover, the contributions of collaterals can be obtained quantitatively, to offer investigator-independent information for estimation of bypass patency, which is very important in the postoperative course of ECIC bypass procedures.31–33
There are also some limitations to this study. The problem of no other quantitative method able to evaluate the ECA supply limits quantified validation of the study on the subjects. DSA cannot be conducted on the healthy subjects to justify the results presented in this study. Furthermore, because of limited experimental conditions, repeating the study within 2 weeks may not provide the exact assessment of the improved perfusion via the ECIC bypass because the bypass requires a longer period to mature. Besides, the SNR of images acquired by using our method is low at present, which will be improved in a future study.
In summary, this work demonstrates that the proposed modified VE-ASL is able to visualize the perfusion territory of the ECA to depict the status of collateral circulation. The results suggest that the approach can be used as a promising tool to assess cerebrovascular surgery. Additional testing in healthy subjects and patients with cerebrovascular disease will further clarify the clinical role of this new method.
Conclusions
Vascular territories obtained with our proposed approach are consistent with cerebrovascular anatomy and quantitative assessment of the ECA supply in subjects with and without pathology and are shown to be helpful in therapeutic evaluation.
Appendix
Hadamard Encoding Theory
The Hadamard encoding matrix34 applied in the ASL technique can lead to SNR efficiency optimal encoding—that is, all inflowing blood can be either fully inverted or fully relaxed in each tagging cycle. Moreover, the resultant decoding process equals the subtraction of tag from control images for each vessel of interest. In conventional ASL for example, the whole-brain perfusion maps are generated by subtraction of tag and control images, which can be expressed in Hadamard encoding20 by
where I and S in vector x represent the MR signal intensity of inflowing blood and static tissue. A is the encoding matrix, and the rows of A are the encoding steps to generate y1 and y2, corresponding to tag and control images. In the decoding process, x can be reconstructed by inversion to yield x = A+y (A+ is pseudoinverse matrix of A). Thus
The result of the matrix operation shows that I is proportional to y2 − y1, demonstrating that the perfusion signal intensity can be acquired by the Hadamard-encoding ASL technique.
In the same way, the Hadamard encoding matrix is extended correspondingly to separately encode >1 vessel. As a result, vessels of interest are encoded into different patterns per encoding step so that the individual perfusion territory of each vessel can be obtained.
Acknowledgments
We thank Eric Wong for his help in developing VE-ASL techniques and Hua Zhong for her assistance with manuscript modification.
ABBREVIATIONS:
- ACA
anterior cerebral artery
- ASL
arterial spin-labeling
- DSC
dynamic susceptibility contrast
- ECA
external carotid artery
- ECIC
extracranial–intracranial
- Gxy
additional gradient pulse
- PCASL
pseudocontinuous arterial spin-labeling
- TCD
transcranial Doppler sonography
- VA
vertebral artery
- VE
vessel-encoded
Footnotes
This work was supported by the Fundamental Research Funds for the Central Universities.
References
- 1. Caplan LR, Hennerici M. Impaired clearance of emboli (washout) is an important link between hypoperfusion, embolism, and ischemic stroke. Arch Neurol 1998;55:1475–82 [DOI] [PubMed] [Google Scholar]
- 2. Hofmeijer J, Klijn CJ, Kappelle LJ, et al. Collateral circulation via the ophthalmic artery or leptomeningeal vessels is associated with impaired cerebral vasoreactivity in patients with symptomatic carotid artery occlusion. Cerebrovasc Dis 2002;14:22–26 [DOI] [PubMed] [Google Scholar]
- 3. Liebeskind DS. Collateral circulation. Stroke 2003;34:2279–84 [DOI] [PubMed] [Google Scholar]
- 4. Powers WJ. Cerebral hemodynamics in ischemic cerebrovascular disease. Ann Neurol 1991;29:231–40 [DOI] [PubMed] [Google Scholar]
- 5. Schomer DF, Marks MP, Steinberg GK, et al. The anatomy of the posterior communicating artery as a risk factor for ischemic cerebral infarction. N Engl J Med 1994;330:1565–70 [DOI] [PubMed] [Google Scholar]
- 6. Yamauchi H, Kudoh T, Sugimoto K, et al. Pattern of collaterals, type of infarcts, and haemodynamic impairment in carotid artery occlusion. J Neurol Neurosurg Psychiatry 2004;7:1697–701 [DOI] [PMC free article] [PubMed] [Google Scholar]
- 7. Rutgers DR, Klijn CJ, Kappelle LJ, et al. A longitudinal study of collateral flow patterns in the circle of Willis and the ophthalmic artery in patients with a symptomatic internal carotid artery occlusion. Stroke 2000;31:1913–20 [DOI] [PubMed] [Google Scholar]
- 8. Vernieri F, Pasqualetti P, Matteis M, et al. Effect of collateral blood flow and cerebral vasomotor reactivity on the outcome of carotid artery occlusion. Stroke 2001;32:1552–58 [DOI] [PubMed] [Google Scholar]
- 9. Bendszus M, Koltzenburg M, Burger R, et al. Silent embolism in diagnostic cerebral angiography and neurointerventional procedures: a prospective study. Lancet 1999;354:1594–97 [DOI] [PubMed] [Google Scholar]
- 10. Henderson RD, Eliasziw M, Fox AJ, et al. Angiographically defined collateral circulation and risk of stroke in patients with severe carotid artery stenosis. Stroke 2000;31:128–32 [DOI] [PubMed] [Google Scholar]
- 11. Kincaid MS. Transcranial Doppler ultrasonography: a diagnostic tool of increasing utility. Curr Opin Anesthesiol 2008;21:552–59 [DOI] [PubMed] [Google Scholar]
- 12. Markus HS. Transcranial Doppler ultrasound. Br Med Bull 2000: 56:378–88 [DOI] [PubMed] [Google Scholar]
- 13. Hendrikse J, Petersen ET, van Laar PJ, et al. Cerebral border zones between distal end branches of intracranial arteries: MR imaging. Radiology 2008;246:572–80 [DOI] [PubMed] [Google Scholar]
- 14. Lim CC, Petersen ET, Ng I, et al. MR regional perfusion imaging: visualizing functional collateral circulation. AJNR Am J Neuroradiol 2007;28:447–48 [PMC free article] [PubMed] [Google Scholar]
- 15. van Laar PJ, Hendrikse J, Golay X, et al. In vivo flow territory mapping of major brain feeding arteries. Neuroimage 2006;29:136–44 [DOI] [PubMed] [Google Scholar]
- 16. van Laar PJ, Hendrikse J, Klijn CJ, et al. Symptomatic carotid artery occlusion: flow territories of major brain-feeding arteries. Radiology 2007;242:526–34 [DOI] [PubMed] [Google Scholar]
- 17. van Osch MJ, Hendrikse J, Golay X, et al. Non-invasive visualization of collateral blood flow patterns of the circle of Willis by dynamic MR angiography. Med Image Anal 2006;10:59–70 [DOI] [PubMed] [Google Scholar]
- 18. Wintermark M, Sesay M, Barbier E, et al. Comparative overview of brain perfusion imaging techniques. Stroke 2005;36:e83–99 [DOI] [PubMed] [Google Scholar]
- 19. Kansagra AP, Wong EC. Quantitative assessment of mixed cerebral vascular territory supply with vessel encoded arterial spin labeling MRI. Stroke 2008;39:2980–85 [DOI] [PubMed] [Google Scholar]
- 20. Wong EC. Vessel-encoded arterial spin-labeling using pseudocontinuous tagging. Magn Reson Med 2007;58:1086–91 [DOI] [PubMed] [Google Scholar]
- 21. Wu B, Wang X, Guo J, et al. Collateral circulation imaging: MR perfusion territory arterial spin-labeling at 3T. AJNR Am J Neuroradiol 2008;29:1855–60 [DOI] [PMC free article] [PubMed] [Google Scholar]
- 22. Garcia D, de Bazelaire C, Alsop D. Pseudo-continuous flow driven adiabatic inversion for arterial spin labeling. In: Proceedings of the 13th Annual Meeting of International Society of Magnetic Resonance in Medicine, Miami Beach, Florida. May 7–13, 2005 [Google Scholar]
- 23. Golub G, Kahan W. Calculating the singular values and pseudo-inverse of a matrix. Journal of the Society for Industrial and Applied Mathematics 1965;2:205–24 [Google Scholar]
- 24. Wong EC, Kansagra AP. Improved separation of vascular territories in vessel encoded pseudo-continuous arterial spin labeling. In: Proceedings of Joint Annual Meeting of the International Society for Magnetic Resonance in Medicine and the European Society of Magnetic Resonance in Medicine and Biology, Berlin, Germany. May 19–25, 2007 [Google Scholar]
- 25. Wong EC. Quantifying CBF with pulsed ASL: technical and pulse sequence factors. J Magn Reson Imaging 2005;22:727–31 [DOI] [PubMed] [Google Scholar]
- 26. Lu H, Clingman C, Golay X, et al. Determining the longitudinal relaxation time (T1) of blood at 3.0 Tesla. Magn Reson Med 2004;52:679–82 [DOI] [PubMed] [Google Scholar]
- 27. Hendrikse J, van der Grond J, Lu H, et al. Flow territory mapping of the cerebral arteries with regional perfusion MRI. Stroke 2004;35:882–87 [DOI] [PubMed] [Google Scholar]
- 28. Gauvrit JY, Delmaire C, Henon H, et al. Diffusion/perfusion-weighted magnetic resonance imaging after carotid angioplasty and stenting. J Neurol 2004;251:1060–67 [DOI] [PubMed] [Google Scholar]
- 29. Adel JG, Sherma AK, Carroll TJ, et al. The use of quantitative magnetic resonance perfusion for assessment of CBF in the perioperative management of carotid stenosis: case illustration. The Open Neurosurgery Journal 2008;1:1–5 [Google Scholar]
- 30. Wilkinson ID, Griffiths PD, Hoggard N, et al. Short-term changes in cerebral microhemodynamics after carotid stenting. AJNR Am J Neuroradiol 2003;24:1501–07 [PMC free article] [PubMed] [Google Scholar]
- 31. Bozzao A, Fasoli F, Finocchi V, et al. Long-term evaluation of brain perfusion with magnetic resonance in high flow extracranial-intracranial saphenous graft bypass. Eur Radiol 2007;17:33–38 [DOI] [PubMed] [Google Scholar]
- 32. Garrett MC, Komotar RJ, Merkow MB, et al. The Extracranial-Intracranial Bypass Trial: implications for future investigations. Neurosurg Focus 2008;24:E4 [DOI] [PubMed] [Google Scholar]
- 33. Horn P, Vajkoczy P, Schmiedek P, et al. Evaluation of extracranial-intracranial arterial bypass function with magnetic resonance angiography. Neuroradiology 2004;46:723–29 [DOI] [PubMed] [Google Scholar]
- 34. Paley R. On orthogonal matrices. J Math Phys 1933;12:311–20 [Google Scholar]


