

Abstract
BACKGROUND AND PURPOSE:
Abnormalities in GABA concentration [GABA] have been associated with several neuropsychiatric disorders, and research has suggested that GABA may play a role in sensorimotor cortex function. We sought to determine whether identifying a change in [GABA] within the sensorimotor cortex of patients with MS has any effect on motor function and would provide information about the adaptive/compensatory mechanisms involved in the attempt to maintain motor function during disease progression.
MATERIALS AND METHODS:
In 19 healthy controls and 30 patients with MS, we assessed task performance with the MS Functional Composite scale and its components (T25FW test, 9HPT, and PASAT). With in vivo MR spectroscopy, we measured [GABA] in the sensorimotor cortex and determined correlations between [GABA] and task performance. We also assessed the association between [GABA] and cortical activation volume after a bilateral finger-tapping task.
RESULTS:
[GABA] was inversely correlated with 9HPT scores in patients with MS, indicating a worsening of performance with increased [GABA]. No significant correlation was observed between [GABA] and T25FW or PASAT scores. [GABA] was directly correlated with primary motor cortex activation volume after the finger-tapping task in patients with MS.
CONCLUSIONS:
These results suggest that cortical [GABA] may be a marker of function and reorganization/adaptation of cortical gray matter in MS.
Spectroscopic measurement of GABA has garnered attention in recent years because of the role of GABA as a major inhibitory transmitter in the human brain. Abnormalities in GABA concentration [GABA] have been associated with several neuropsychiatric disorders,1 and recent reports have suggested that GABA may play a role in sensorimotor cortex function in both healthy and disease states.2–9 In particular, GABA may be involved in brain plasticity, cortical adaptation, and reorganization in neurodegenerative disease processes. Reduction in GABA inhibition has been reported to facilitate long-term potentiation-like activity in the motor cortex.3,4 GABAergic inhibition has been identified as one of the mechanisms operating in use-dependent plasticity in the intact human motor cortex, which suggests similarities between the mechanisms underlying this form of plasticity and long-term potentiation.2 The GABA agonist lorazepam is associated with suppression of profound reorganization in the somatosensory cortex, as demonstrated with motor-learning paradigms.8 [GABA] reduction in the sensorimotor cortex of healthy controls during motor learning has been reported5; and decreases in [GABA] in the sensorimotor cortex have been observed in patients with focal dystonia.6 Reduction of [GABA] in the sensorimotor cortex induced by acute deafferentation has also been reported.7 A recent study reported a positive correlation between the decrease in primary motor cortex (M1) [GABA] and the degree of motor learning as well as the motor learning–induced fMRI signal change within the M1.9
MS frequently produces significant motor impairment in affected patients. Damage to both GM and WM components of the motor system has been reported in patients with MS.10,11 Functional imaging studies have suggested that adaptive and/or compensatory mechanisms are involved in the attempt to maintain motor function during disease progression.10,12–14 These studies generally have demonstrated an increase in the extent of functional cortical activation in patients with MS versus controls during performance of specific tasks; this increased brain activation has been interpreted as cortical reorganization and/or adaptation. Given the role of GABA in other disease processes, we hypothesized that identifying a change in [GABA] within the sensorimotor cortex of patients with MS would provide us with additional information about the ongoing disease process and these compensatory mechanisms.
In this study, we measured the sensorimotor cortex [GABA] in healthy controls and in patients with MS with MR spectroscopy. These [GABA] values were correlated with the MS Functional Composite15 scores and with scores of the individual components of the scale involving ambulatory, arm function, and cognitive tasks. Additionally, to investigate the potential role of GABA in cortical reorganization, we assessed the association between [GABA] and cortical activation volume following a bilateral finger-tapping task.
Materials and Methods
Nineteen healthy controls and 30 patients with relapsing-remitting MS participated in this study. The patients had their last doses of steroids at least 8 weeks before the MR imaging and were clinically stable, with no changes in the Expanded Disability Status Scale for at least 8 weeks before imaging. From these participants, datasets for 8 controls and 13 patients were discarded because of unacceptable subject motion.16,17 GABA signal was either too low or inconclusive in the datasets for 1 control and 4 patients (the spectra were either too noisy to fit with the Advanced Method for Accurate, Robust, and Efficient Spectral fitting,18 or had other comparable peaks present in the edited spectra, possibly due to poor editing). Data from the remaining 10 healthy controls (8 women, 2 men; mean age = 38.4 ± 13.6 years; mean MS Functional Composite = 0.408 ± 0.445) and 13 patients with MS (10 women, 3 men; mean age = 47.2 ± 8.3 years; disease duration = 9.5 ± 7.0 years; mean Expanded Disability Status Scale score = 3.15 ± 2.30; mean MS Functional Composite = 0.212 ± 0.559) were included in this study. Sixteen of a total 96 time points were discarded in 1 acceptable dataset because of motion, while no other dataset had to be discarded among the acceptable studies. The local institutional review board approved the study procedures, and all patients and controls provided informed consent.
Behavioral Study
The behavioral study consisted of MS Functional Composite testing with 3 components: 1) the T25FW test, a measure of ambulation in which the time required for the subject to walk 25 feet back and forth is recorded; 2) the 9HPT, a measure of arm function and fine-motor coordination, in which the time taken by the subject to pick up and place 9 dowels in 9 holes is recorded19; and 3) the PASAT, a measure of cognition in which the subject is presented with a series of 60 numbers spaced 2 seconds apart and asked to add the 2 most recent numbers and the number of correct responses is recorded.20 The z score for each component and the total MS Functional Composite score for each subject were calculated with the methods outlined by the National Multiple Sclerosis Society Clinical Outcomes Assessment Task Force.15,21,22
MR Imaging Study
MR images were obtained on a 3T Trio scanner (Siemens, Erlangen, Germany). A circularly polarized head coil was used. All patients and healthy volunteers were scanned with a sequence based on the MEGA-PRESS sequence that was designed by Mescher et al.23
To identify motion-corrupted data for all controls and the first 25 patients with MS, we used water signal–based interleaved navigator pulses,17 a methodology that has been identified as an effective way to discard only the portion of data from a scan that is motion-corrupted and to therefore reduce possible misinterpretation of the edited spectra. For the last 5 patients with MS, we used an alternative method of motion detection. This method identified motion by collecting data in weak water-suppression mode to detect residual water-signal fluctuation.16 This change in the motion-identification method was implemented to improve the signal and ease of acquisition and has similar efficacy in detecting motion compared with the first method. Because the main MEGA-PRESS module used in the 2 methods is the same, a change in motion-detection method does not influence the measured GABA concentration. This was verified by scanning phantoms containing GABA of a known concentration. Three percent or more change in water signal is indicative of unacceptable motion in both methods.16,17
The complete protocol consisted of the following scans, as discussed in our previous work24:
A localizer scan.
Gradient-echo field mapping.
A whole-brain T1-weighted magnetization-prepared rapid acquisition of gradient echo scan with the following parameters: 144 axial sections; thickness = 1 mm; FOV = 25.6 × 25.6 cm; TR = 1900 ms; TE = 1.89 ms; flip angle = 8 °; 256 × 128 matrix; readout bandwidth = 125 kHz; and scan time = 8 minutes 5 seconds.
An fMRI scan: The gradient-echo echo-planar fMRI scan parameters were as follows: TR = 2000 ms; TE = 30 ms; flip angle = 90°; number of transverse sections = 32; and section thickness = 4 mm without any intersection gap. Subjects performed self-paced bilateral finger tapping (index finger simultaneously in opposition to the thumb on each hand) in blocks of interleaved 32-second ON and 32-second OFF patterns. The voxel at the motor cortex was selected by using the real-time fMRI Student t statistic activation map-generation program Neuro 3D (Siemens). A single voxel (2 × 2 × 2 cm3) centered at the area of maximum activation in the precentral gyrus of the right hemisphere was selected for the spectroscopy scans from pixels with t ≥ 4.0 (P < .001).
A MEGA-PRESS–based GABA editing scan with a water signal–based interleaved navigator scan17 by using the following parameters: voxel = 2 × 2 × 2 cm3; TR = 2700 ms; TE = 68 ms; number of excitations = 96; flip angle = 90°; unsuppressed water-excitation flip angle = 20°; edit pulse frequency = 1.90 ppm (the other 180° pulse was placed at 1.50 ppm to minimize macromolecule contamination25); edit pulse width ∼ 44 Hz (duration = 20 ms); and scanning time = 8 minutes 39 seconds The navigator-based sequence was replaced with MEGA-PRESS in weak water-suppression mode for the last 5 patients.16
A metabolite nulling scan with an 180° inversion pulse added to the sequence used in scan 5 with a TI of 650 ms.24 Even though pulsing at 1.90 and 1.50 ppm minimizes macromolecule contamination, this scan was added to ensure minimization of any residual macromolecule contamination resulting from shot-to-shot B0 variation.26
A PRESS scan with TR = 2700 ms and number of excitations = 48.
A PRESS scan with TR = 2700 ms, number of excitations = 1, and no water suppression.
Repeat of the localizer scan.
A bite-bar was used during all scans to reduce head motion.
The MR spectroscopy data were analyzed with the jMRUI software package (http://www.mrui.uab.es/mrui)27; we described the steps of this data analysis in detail in a previous study.24 In brief, the data analysis consisted of the following: 1) discarding the first 4 measurements from each scan to ensure steady-state magnetization and identifying and discarding motion-corrupted data on the basis of fluctuation of the unsuppressed navigator water/residual water signal; 2) performing zero-order phase correction; 3) performing frequency-shift correction of the individual subspectra by using residual water as a reference; 4) summing the phase- and frequency-corrected subspectra; 5) performing residual water suppression with a Hankel-Lanczos singular-value decomposition filter28; 6) performing apodization with a 5-Hz Gaussian filter; and 7) performing zero-filling. Finally, the OFF-resonance spectrum was subtracted from the ON-resonance spectrum to obtain the final edited spectrum.
Next, as we previously described,24 the GM, WM, and CSF contributions to the voxel composition were determined with the fMRI of the Brain Automated Segmentation Tool (http://fsl.fmrib.ox.ac.uk/fsl/fslwiki/FAST) algorithm29 of the fMRI of the Brain Software Library (http://www.fmrib.ox.ac.uk/analysis/techrep/tr04ss2/tr04ss2/node19.html)30; the anatomic 3D magnetization-prepared rapid acquisition of gradient echo scan was used as the base image, and a mask was applied at the voxel location. The fraction volumes of gray matter, white matter, and CSF (fGM_vol, fWM_vol, and fvol_CSF) were used to perform absolute quantification of the GABA level.
The absolute GABA level was obtained following a 2-step process as described in our previous study24:
- The [GABA]/[Cr] ratio was obtained in the first step from scans 5 and 6 by using the equation:
where G* is the area under the 3.01-ppm peak in the edited spectrum, M is the area under the 2.99-ppm residual macromolecule peak in the metabolite-nulled spectrum after correcting for the relaxation effects, ICr is the area under the 3.93-ppm peak (methylene Cr) in the OFF-resonance spectrum, and EE is the editing factor. All areas were measured by using the Advanced Method for Accurate, Robust, and Efficient Spectral fitting algorithm.17 The editing factor EE was calculated following the method used by Terpstra et al26 by comparing the unmodulated GABA relative to the glycine signal from a PRESS scan (TR = 2700 ms, TE = ms) with that from a MEGA-PRESS scan of the same voxel of a phantom containing GABA and glycine. Terpstra et al26 had assumed an identical T2 of Cr methyl and C4H GABA resonances, and T2 of Cr methyl and methylene resonances were reported at the occipital lobe by Mlynárik et al31at 3T. Assuming the T2 of Cr resonances in occipital and motor areas to be similar, we calculated the difference in T2 relaxation effect between Cr methyl and methylene at TE = 68 ms to be negligible, and the T2 of the Cr methylene and of the C4H GABA resonances was assumed to be identical in this study. In addition, the potential difference in the T1 relaxation effect at TR = 2700 ms was assumed to be negligible in this study, in line with the assumption of comparable T1 of all metabolites23 and our observation of similar T1 of GABA and Cr from phantom scans. In this study, we used the methylene resonance of Cr instead of the methyl resonance because the latter can introduce a systematic error in [GABA]/[Cr] measurement.32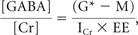
- Next, the creatine concentration, [Cr], was determined from scans 7 and 8 by using the following equation as in Gasparovic et al33:
where ICr is the area under the 3.93-ppm peak in scan 7, and fGM, fWM, and fCSF are the fractions of GM, WM, and CSF water respectively. RH2O_GM, RH2O_WM, and RH2O_CSF are the relaxation attenuation factors for water in GM, WM, and CSF respectively; SH2O_obs is the area under the unsuppressed water peak in scan 8; RCr is the relaxation attenuation factor for Cr methylene resonance; #HCr (n = 2) is the number of protons in Cr methylene; and [H2O] (55 mol/L) is the concentration of pure water. fGM, fWM, and fCSF were calculated by using fGM_vol, fWM_vol, and fvol_CSF as in Bhattacharyya et al24 and Gasparovic et al.33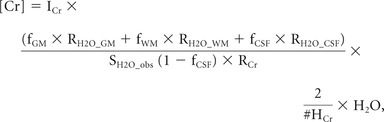
Finally, the GABA concentration was determined by taking the product of the [GABA]/[Cr] ratio and [Cr].
Because the water content in an MS lesion is 6.3 ± 0.3% higher than that in normal-appearing WM34 and the water content in normal-appearing WM is approximately 2.2% higher than that in normal WM,34 we made the necessary corrections for calculating [GABA] in patients with MS. It should be pointed out that the WM lesion content within spectroscopy voxels as determined from the T1-weighted image was only approximately 0.2%.
To account for the effect of voxel composition in patients with MS, we estimated [GABA] in GM and WM. It has recently been shown, with linear regression analysis, that [GABA] values within GM and WM in the sensorimotor region are 2.87 ± 0.61 and 0.33 ± 0.11 mmol/L, respectively, in healthy controls, which results in a GM/WM [GABA] ratio of 8.70 ± 3.44.24 Because [GABA] in the cortical GM may vary among patients depending on the severity of disease, we determined that it was not feasible to perform linear regression analysis on patient data. To estimate the GM/WM [GABA] in patients, we therefore assumed that the ratio of GM and WM [GABA] was similar in patients with MS and controls. In the absence of any a priori knowledge, we performed the analysis several times by using different GM and WM [GABA] ratios, ranging from 5 to 11.
We analyzed the fMRI data to look for a correlation between activation volume and [GABA]. The first 4 volumes from the fMRI time-series were discarded. The remaining data were spatially filtered by using a 64-point radially symmetric 2D Hamming filter in the Fourier domain and were then retrospectively motion-corrected by using Analysis of Functional NeuroImages software (AFNI; http://dbic.dartmouth.edu/wiki/index.php/AFNI).35 Data were analyzed for activation by least-squares fitting the time-series for each pixel to a boxcar reference function plus a slope.36 Student t maps and a magnetization-prepared rapid acquisition of gradient echo scan for each subject were transformed into the standard stereotaxic space defined by Talairach and Tournoux37 by using AFNI.35 ROI analysis was performed by using the Human Motor Area Template (http://lrnlab.org/), a set of ROI masks defining the M1, primary sensory cortex, dorsal premotor cortex, ventral premotor cortex, and supplemental motor area in Talairach space.38 The number of activated voxels (Student t > 3.5, 1-sided, uncorrected P < 3 × 10⁻⁴) within the Human Motor Area Template ROI mask corresponding to M1 was determined. The right hemisphere of the brain was chosen for this analysis because the spectroscopy voxel was selected from within the right hemisphere for each subject.
Results
Figure 1 shows spectra from 5 subjects (all patients) obtained by using a MEGA-PRESS sequence. Table 1 shows the [GABA]/[Cr] ratio, [Cr], and [GABA] in a 20 × 20 × 20 mm3 voxel in the sensorimotor region of the healthy controls and patients with MS. [GABA]/[Cr] and [GABA] were not significantly different between controls and patients (P = .10 and 0.15, respectively).
Fig 1.
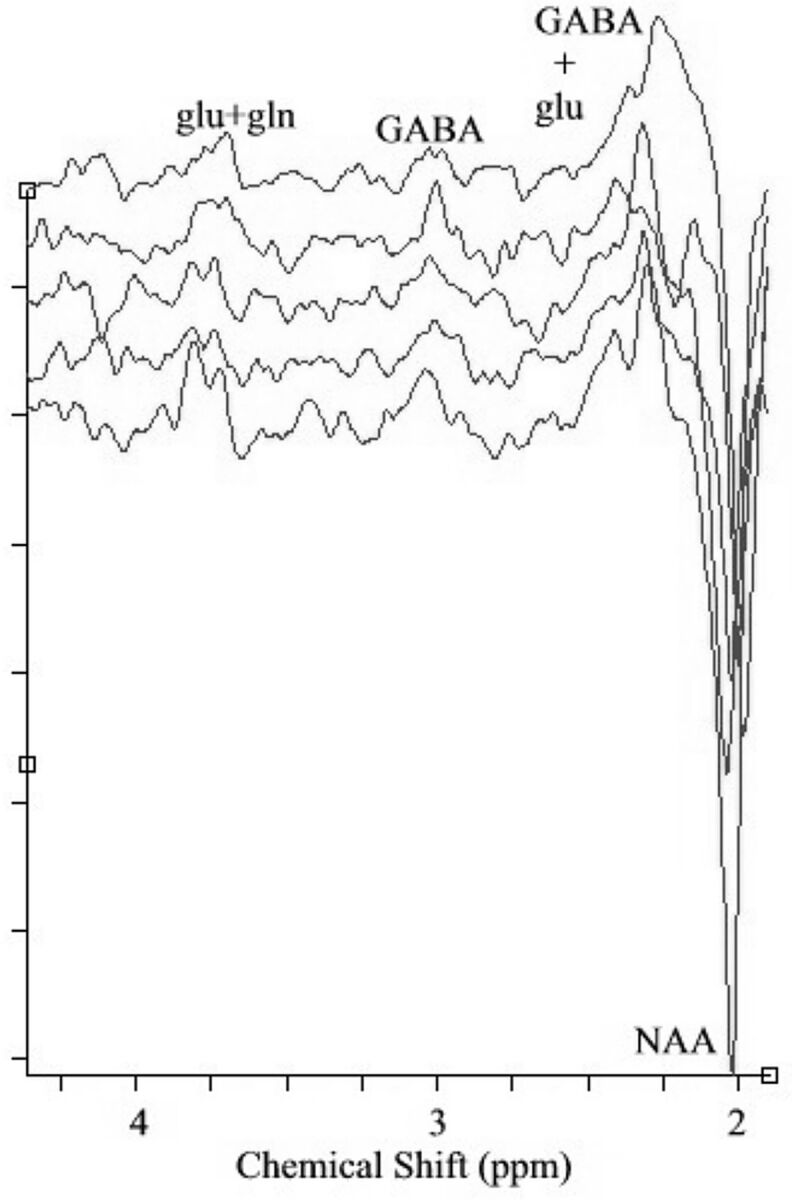
GABA-edited spectra from 5 subjects (all patients) obtained by using MEGA-PRESS sequence. NAA and coedited glutamate (glu) and glutamine (gln) can be seen in the spectra in addition to GABA.
Table 1:
GABA and Cr concentrations in healthy controls and patients with MSa
| Voxel Composition |
[GABA]/[Cr] | [Cr] (mM) | [GABA] (mM) | |||
|---|---|---|---|---|---|---|
| % GM | % WM | % CSF | ||||
| Controls (n = 10) | 37 ± 7 | 52 ± 12 | 11 ± 8 | 0.15 ± 0.05 | 9.22 ± 0.85 | 1.43 ± 0.48 |
| Patients (n = 13) | 34 ± 7 | 49 ± 10 | 16 ± 5 | 0.19 ± 0.06 | 9.43 ± 1.43 | 1.71 ± 0.42 |
Values are means.
The calculated correlation coefficients between MS Functional Composite scores (and the components of the MS Functional Composite) and [GABA] are shown in Table 2. We observed a very strong inverse correlation between [GABA] and the 9HPT in patients with MS (Fig 2). Because the spectroscopy voxels were always selected from the right hemisphere, we repeated the same analysis by using 9HPT data for the contralateral (left) hand only. We also repeated the analysis by using only the cortical GM [GABA], for which we used the range of GM [GABA], as mentioned earlier. In all cases, significant inverse correlation between 9HPT scores and [GABA] was observed. Most interesting, the control subjects' data did not show any such correlation (P = .78). The [GABA]/[Cr] ratio did not significantly correlate with the MS Functional Composite or its components for either controls or patients. Combined plots of [GABA] versus 9HPT are shown in On-line Fig 1.
Table 2:
Correlation coefficients of MSFC and components with GABA concentration and the ratio of GABA and Cr concentration
| GABA MSFC | GABA/Cr MSFC | GABA 9HPT | GABA/Cr 9HPT | GABA T25FW | GABA/Cr T25FW | GABA PASAT | GABA/Cr PASAT | |
|---|---|---|---|---|---|---|---|---|
| Controls (n = 10) | −0.2233, P = .54 | −0.1728, P = .63 | 0.1035, P = .78 | 0.1824, P = .61 | −0.1680, P = .64 | −0.0133, P = .97 | −0.3341, P = .35 | −0.3124, P = .38 |
| Patients (n = 13) | −0.3324, P = .27 | −0.2052, P = .50 | −0.6750,a P = .01 | −0.4807, P = .1 | −0.3865, P = .19 | −0.4155, P = .16 | 0.0504, P = .87 | 0.1161, P = .71 |
Note:—MSFC indicates Multiple Sclerosis Functional Composite.
Statistically significant.
Fig 2.

Inverse correlation of sensorimotor γ-aminobutyric acid concentration and Nine-Hole Peg Test scores in patients with multiple sclerosis. A fixed error bar of 30% is used for [GABA] in the plot.
The total number of M1 voxels was 497 ± 50 and 498 ± 64 in controls and patients, respectively. The number of activated voxels in the controls (124 ± 92) was not significantly different from that in patients with MS (176 ± 63). The trend of our data suggests a significant correlation between the number of activated voxels (ie, activation volume) and [GABA] in the patients with MS (P = .05; Fig 3). No significant correlation was seen between activation volume and [GABA] in the healthy controls (P = .81). The [GABA]/[Cr] ratio did not have any significant correlation with primary cortex activation volume in either controls (P = .90) or patients (P = .16). Combined plots of [GABA] versus activation volume are shown in On-line Fig 2.
Fig 3.

Correlation of sensorimotor γ-aminobutyric acid concentration and fMRI activation volume in patients with multiple sclerosis. A fixed error bar of 30% is used for [GABA] in the plot.
Discussion
In this study, we found that [GABA] was inversely correlated with 9HPT scores in patients with MS, indicating a worsening of performance with increases in [GABA]. The [GABA] value was also directly correlated with primary motor cortex–activation volume after a bilateral finger-tapping task in patients with MS.
Recent histopathologic observations have suggested that GABA receptor levels may be reduced in the motor cortex of patients with MS,39,40 whereas our results suggest that [GABA] is increased within the motor cortex in patients who demonstrate poorer motor performance. The reasons for these different findings are unclear. It is possible that these varying results may reflect differences in the patient populations evaluated; the pathologic studies included predominantly patients with late end-stage chronic MS, whereas we included patients with relapsing-remitting MS.
The 9HPT is a clinical measure that probes dominant and nondominant hand and finger coordination and dexterity. Thus, this test more specifically addresses motor function in a manner similar to finger tapping, which was used for GABA spectroscopy voxel selection. In our study, no significant correlation was found between [GABA] and the T25FW or PASAT components of the MS Functional Composite in patients with MS. These results, in conjunction with the inverse correlation between [GABA] and the 9HPT in study patients, suggest that [GABA] measurements within a given cortical region relate directly to the expected function of the underlying parenchyma rather than reflecting a generalized effect of global disease progression.
While several investigators have studied the relationship between GABA and motor plasticity in healthy controls,2,5,9,41 the work has focused on tasks involving motor learning. In this study, we adopted a task that does not involve motor learning. Our observation of lack of any correlation between sensorimotor [GABA] and M1 activation volume in healthy controls is in line with a previous observation of no sensorimotor [GABA] modulation during unlearnable nonrepetitive tasks.5 Cortical reorganization or adaptation has been found to take place in patients with MS as a compensatory mechanism for functioning.10,12–14 This reorganization/adaptation is manifested by increased activation, as measured by fMRI, involving a broader range of cortical regions in these patients versus controls. Reddy et al10 reported increased activation in the ipsilateral sensorimotor cortex with simple hand movements in patients with MS. In another study, a distinct pattern of cortical activation from disability and brain injury in MS was observed.13 The degree of adaptive cortical functional change has also been shown to be correlated with the extent of brain injury in patients with nondisabling MS.14 The underlying mechanism responsible for this cortical reorganization or adaptation is still unknown, and a cortical marker of adaptation has not previously been explored in great detail. Our observation of increased cortical [GABA] with increased motor activation suggests that GABA plays a role in this cortical adaptation process.
Although the inclusion criteria for datasets in our study reduced the final sample size, the increased reliability of GABA measurements was considerable; additionally, the inverse correlation between [GABA] and 9HPT scores and the correlation between [GABA] and the number of activated pixels were statistically significant.
Potential differences in self-paced finger tapping between individuals is a limitation of this study. Because motor learning has been reported to the sensorimotor cortex GABA levels,5 we chose self-paced finger tapping as the task for this study instead of having the subjects follow a specific pattern. Our experience with this in past studies42,43 is that similar paradigms have sufficiently light attention demands so that patients with MS can easily perform them with little training and the variability in performance is minimal.
Also some of the medications prescribed to the patients may have some effect on GABA levels. In addition, modulation of the occipital cortex GABA level during the menstrual period has been reported in literature44 and may have some effect in our sensorimotor GABA measurement. However, function-specific correlations suggest that the effect we are observing primarily arises from the MS disease process.
In addition, heterogeneity in subject population could potentially dilute some of the changes in the components in the MS Functional Composite. This is another potential limitation of the study. We have reported an interesting observation that suggests the role of the cortical GABA level in MS. At this stage, we are not in a position to comment on the mechanism of this observation at the cellular level or the implication of this in GABAergic drug medications. Another limitation of this study is the small subject population. The study was not powered to find changes in T25FW or PASAT. Further studies are needed to explore this, and we are pursuing that as well. However, our observation with the current sample size strongly suggests that sensorimotor [GABA] in MS is inversely related to the 9HPT and not correlated with the T25FW or PASAT.
A note on multiple comparisons is in order. Although multiple hypotheses were tested in the work reported here, we think that a Bonferroni correction is not warranted, due to the fact that we had a priori expectations for each of the tests. Our principal hypothesis was that a strong significant inverse correlation was observed between [GABA] and the 9HPT in patients. Because [GABA] was measured at the sensorimotor cortex and the 9HPT directly addresses a function that involves the sensorimotor cortex, we had a priori expectations that these would correlate. Similarly, because [GABA] was measured at the sensorimotor cortex and like the 9HPT, finger tapping directly addresses a function that involves the sensorimotor cortex, we had an a priori expectation that the volume of activation in the primary motor cortex would be correlated with [GABA]. On application of a strict multiple-comparison correction, the volume correlation loses significance. However, given the a priori nature of the comparison and the exploratory nature of the study, we think that such a correction is not warranted.
Conclusions
We found that [GABA] in the region of the sensorimotor cortex associated with hand activity in patients with MS was inversely correlated with performance on the 9HPT, a task that involves hand coordination. Additionally, [GABA] had no significant correlation with tasks not involving hand activity and the associated brain regions, suggesting that these results are functionally and anatomically specific. We also observed that [GABA] was directly correlated with activation volume in the primary motor cortex after self-paced bilateral finger tapping. No such correlations were observed between [GABA] and 9HPT performance or primary motor cortex activation in healthy controls. These results suggest that cortical [GABA] may play a role in and be a potential marker of function and reorganization/adaptation of cortical GM in patients with MS.
Supplementary Material
Acknowledgments
We acknowledge Siemens Medical Solutions for support with pulse sequence development and Jian Lin, Blessy Mathew, and Katherine Koenig, MD, for assistance with data analysis. We also thank R. Gruetter, MD, for his helpful contributions and suggestions during MEGA-PRESS protocol development.
ABBREVIATIONS:
- 9HPT
Nine-Hole Peg Test
- GABA
γ-aminobutyric acid
- GM
gray matter
- PASAT
Paced Auditory Serial Addition Test
- PRESS
point-resolved spectroscopy sequence
- T25FW
Timed 25-Foot Walk Test
Footnotes
Disclosures: Pallab K. Bhattacharyya—RELATED: Grant: National Institutes of Health,* National Multiple Sclerosis Society,* Support for Travel to Meetings for the Study or Other Purposes: National Multiple Sclerosis Society.* Lael A. Stone—RELATED: Grant: National Multiple Sclerosis Society.* Mark J. Lowe—RELATED: Grant: National Institutes of Health,* National Multiple Sclerosis Society.* Robert A. Bermel—UNRELATED: Consultancy: Biogen Idec, Teva, Astellas, Novartis, Grants/Grants Pending: National Multiple Sclerosis Society,* Novartis.* *Money paid to the institution.
This work was supported by the National Institutes of Health (1R21 EB005302-01A); the National Multiple Sclerosis Society (RG 3753A1/2); and the Cleveland Clinic Research Program Committee (RPC 2009–1006).
Paper previously presented in part at: 18th Annual Meeting of the International Society for Magnetic Resonance in Medicine, May 1–7, 2010, Stockholm, Sweden; 20th Annual Meeting of the International Society for Magnetic Resonance in Medicine, May 5–11, 2012, Melbourne, Australia; and 62nd Annual Meeting of the American Academy of Neurology, April 10–17, 2010, Toronto, Ontario, Canada.
REFERENCES
- 1.Chang L, Cloak CC, Ernst T. Magnetic resonance spectroscopy studies of GABA in neuropsychiatric disorders. J Clin Psychiatry 2003;64(suppl 3):7–14 [PubMed] [Google Scholar]
- 2.Bütefisch CM, Davis BC, Wise SP, et al. Mechanisms of use-dependent plasticity in the human motor cortex. Proc Natl Acad Sci U S A 2000;97:3661–65 [DOI] [PMC free article] [PubMed] [Google Scholar]
- 3.Castro-Alamancos MA, Connors BW. Short-term synaptic enhancement and long-term potentiation in neocortex. Proc Natl Acad Sci U S A 1996;93:1335–39 [DOI] [PMC free article] [PubMed] [Google Scholar]
- 4.Castro-Alamancos MA, Donoghue JP, Connors BW. Different forms of synaptic plasticity in somatosensory and motor areas of the neocortex. J Neurosci 1995;15:5324–33 [DOI] [PMC free article] [PubMed] [Google Scholar]
- 5.Floyer-Lea A, Wylezinska M, Kincses T, et al. Rapid modulation of GABA concentration in human sensorimotor cortex during motor learning. J Neurophysiol 2006;95:1639–44 [DOI] [PubMed] [Google Scholar]
- 6.Levy LM, Hallett M. Impaired brain GABA in focal dystonia. Ann Neurol 2002;51:93–101 [PubMed] [Google Scholar]
- 7.Levy LM, Ziemann U, Chen R, et al. Rapid modulation of GABA in sensorimotor cortex induced by acute deafferentation. Ann Neurol 2002;52:755–61 [DOI] [PubMed] [Google Scholar]
- 8.Pleger B, Schwenkreis P, Dinse HR, et al. Pharmacological suppression of plastic changes in human primary somatosensory cortex after motor learning. Exp Brain Res 2003;148:525–32 [DOI] [PubMed] [Google Scholar]
- 9.Stagg CJ, Bachtiar V, Johansen-Berg H. The role of GABA in human motor learning. Curr Biol 2011;21:480–84 [DOI] [PMC free article] [PubMed] [Google Scholar]
- 10.Reddy H, Narayanan S, Arnoutelis R, et al. Evidence for adaptive functional changes in the cerebral cortex with axonal injury from multiple sclerosis. Brain 2000;123(pt 11):2314–20 [DOI] [PubMed] [Google Scholar]
- 11.Sailer M, Fischl B, Salat D, et al. Focal thinning of the cerebral cortex in multiple sclerosis. Brain 2003;126(pt 8):1734–44 [DOI] [PubMed] [Google Scholar]
- 12.Rocca MA, Mezzapesa DM, Falini A, et al. Evidence for axonal pathology and adaptive cortical reorganization in patients at presentation with clinically isolated syndromes suggestive of multiple sclerosis. Neuroimage 2003;18:847–55 [DOI] [PubMed] [Google Scholar]
- 13.Reddy H, Narayanan S, Woolrich M, et al. Functional brain reorganization for hand movement in patients with multiple sclerosis: defining distinct effects of injury and disability. Brain 2002;125(pt 12):2646–57 [DOI] [PubMed] [Google Scholar]
- 14.Rocca MA, Falini A, Colombo B, et al. Adaptive functional changes in the cerebral cortex of patients with nondisabling multiple sclerosis correlate with the extent of brain structural damage. Ann Neurol 2002;51:330–39 [DOI] [PubMed] [Google Scholar]
- 15.Cutter GR, Baier ML, Rudick RA, et al. Development of a multiple sclerosis functional composite as a clinical trial outcome measure. Brain 1999;122(pt 5):871–82 [DOI] [PubMed] [Google Scholar]
- 16.Bhattacharyya PK, Beall EB, Lowe MJ. Residual water for motion identification in J-difference editing. In: Proceedings of the International Society for Magnetic Resonance Workshop on Current Concepts of Motion Correction for MRI and MRS, Kitzbühel, Tyrol, Austria. February 24–28, 2010 [Google Scholar]
- 17.Bhattacharyya PK, Lowe MJ, Phillips MD. Spectral quality control in motion-corrupted single-voxel J-difference editing scans: an interleaved navigator approach. Magn Reson Med 2007;58:808–12 [DOI] [PubMed] [Google Scholar]
- 18.Vanhamme L, van den Boogaart A, Van Huffel S. Improved method for accurate and efficient quantification of MRS data with use of prior knowledge. J Magn Reson 1997;129:35–43 [DOI] [PubMed] [Google Scholar]
- 19.Mathiowetz V, Volland G, Kashman N, et al. Adult norms for the Box and Block Test of manual dexterity. Am J Occup Ther 1985;39:386–91 [DOI] [PubMed] [Google Scholar]
- 20.Gronwall DM. Paced Auditory Serial-Addition Task: a measure of recovery from concussion. Percept Mot Skills 1977;44:367–73 [DOI] [PubMed] [Google Scholar]
- 21.Rudick R, Antel J, Confavreux C, et al. Recommendations from the National Multiple Sclerosis Society Clinical Outcomes Assessment Task Force. Ann Neurol 1997;42:379–82 [DOI] [PubMed] [Google Scholar]
- 22.Fischer JS, Rudick RA, Cutter GR, et al. The Multiple Sclerosis Functional Composite Measure (MSFC): an integrated approach to MS clinical outcome assessment—National MS Society Clinical Outcomes Assessment Task Force. Mult Scler 1999;5:244–50 [DOI] [PubMed] [Google Scholar]
- 23.Mescher M, Merkle H, Kirsch J, et al. Simultaneous in vivo spectral editing and water suppression. NMR Biomed 1998;11:266–72 [DOI] [PubMed] [Google Scholar]
- 24.Bhattacharyya PK, Phillips MD, Stone LA, et al. In vivo magnetic resonance spectroscopy measurement of gray-matter and white-matter gamma-aminobutyric acid concentration in sensorimotor cortex using a motion-controlled MEGA point-resolved spectroscopy sequence. Magn Reson Imaging 2011;29:374–79 [DOI] [PMC free article] [PubMed] [Google Scholar]
- 25.Henry PG, Dautry C, Hantraye P, et al. Brain GABA editing without macromolecule contamination. Magn Reson Med 2001;45:517–20 [DOI] [PubMed] [Google Scholar]
- 26.Terpstra M, Ugurbil K, Gruetter R. Direct in vivo measurement of human cerebral GABA concentration using MEGA-editing at 7 Tesla. Magn Reson Med 2002;47:1009–12 [DOI] [PubMed] [Google Scholar]
- 27.Naressi A, Couturier C, Devos JM, et al. Java-based graphical user interface for the MRUI quantitation package. Magma 2001;12:141–52 [DOI] [PubMed] [Google Scholar]
- 28.Pijnappel WW, van den Boogaart A, de Beer R, et al. SVD-based quantification of magnetic resonance signals. J Magn Reson 1992;97:122–34 [Google Scholar]
- 29.Zhang Y, Brady M, Smith S. Segmentation of brain MR images through a hidden Markov random field model and the expectation-maximization algorithm. IEEE Trans Med Imaging 2001;20:45–57 [DOI] [PubMed] [Google Scholar]
- 30.Smith SM, Jenkinson M, Woolrich MW, et al. Advances in functional and structural MR image analysis and implementation as FSL. Neuroimage 2004;23(suppl 1):S208–19 [DOI] [PubMed] [Google Scholar]
- 31.Mlynárik V, Gruber S, Moser E. Proton T (1) and T (2) relaxation times of human brain metabolites at 3 Tesla. NMR Biomed 2001;14:325–31 [DOI] [PubMed] [Google Scholar]
- 32.Bhattacharyya PK. Systematic error in the measurement of [GABA]/[Cr] ratio using methyl resonance of creatine. In: Proceedings of the International Society for Magnetic Resonance in Medicine Workshop on MR Spectroscopy and Neurotransmitter Function in Neuropsychiatric Disorders, Quebec City, Quebec, Canada. November 7–10, 2008 [Google Scholar]
- 33.Gasparovic C, Song T, Devier D, et al. Use of tissue water as a concentration reference for proton spectroscopic imaging. Magn Reson Med 2006;55:1219–26 [DOI] [PubMed] [Google Scholar]
- 34.Laule C, Vavasour IM, Moore GR, et al. Water content and myelin water fraction in multiple sclerosis: a T2 relaxation study. J Neurol 2004;251:284–93 [DOI] [PubMed] [Google Scholar]
- 35.Cox RW, Hyde JS. Software tools for analysis and visualization of fMRI data. NMR Biomed 1997;10:171–78 [DOI] [PubMed] [Google Scholar]
- 36.Lowe MJ, Russell DP. Treatment of baseline drifts in fMRI time series analysis. J Comput Assist Tomogr 1999;23:463–73 [DOI] [PubMed] [Google Scholar]
- 37.Talairach J, Tournoux P. Co-Planar Stereotaxic Atlas of the Human Brain. New York: Thieme Medical; 1988 [Google Scholar]
- 38.Mayka MA, Corcos DM, Leurgans SE, et al. Three-dimensional locations and boundaries of motor and premotor cortices as defined by functional brain imaging: a meta-analysis. Neuroimage 2006;31:1453–74 [DOI] [PMC free article] [PubMed] [Google Scholar]
- 39.McDonough J, Dutta R, Gudz T, et al. Decreases in GABA and mitochondrial genes are implicated in MS cortical pathology through microarray analysis of postmortem MS cortex. Soc Neurosci Abstr 2003;213:212 [Google Scholar]
- 40.Dutta R, McDonough J, Yin X, et al. Mitochondrial dysfunction as a cause of axonal degeneration in multiple sclerosis patients. Ann Neurol 2006;59:478–89 [DOI] [PubMed] [Google Scholar]
- 41.Ziemann U, Muellbacher W, Hallett M, et al. Modulation of practice-dependent plasticity in human motor cortex. Brain 2001;124:1171–81 [DOI] [PubMed] [Google Scholar]
- 42.Horenstein C, Lowe MJ, Koenig KA, et al. Comparison of unilateral and bilateral complex finger tapping-related activation in premotor and primary motor cortex. Hum Brain Mapp 2009;30:1397–412 [DOI] [PMC free article] [PubMed] [Google Scholar]
- 43.Lowe MJ, Beall EB, Sakaie KE, et al. Resting state sensorimotor functional connectivity in multiple sclerosis inversely correlates with transcallosal motor pathway transverse diffusivity. Hum Brain Mapp 2008;29:818–27 [DOI] [PMC free article] [PubMed] [Google Scholar]
- 44.Epperson CN, Haga K, Mason GF, et al. Cortical gamma-aminobutyric acid levels across the menstrual cycle in healthy women and those with premenstrual dysphoric disorder: a proton magnetic resonance spectroscopy study. Arch Gen Psychiatry 2002;59:851–58 [DOI] [PubMed] [Google Scholar]
Associated Data
This section collects any data citations, data availability statements, or supplementary materials included in this article.