

Abstract
BACKGROUND AND PURPOSE:
In proximal anterior circulation occlusive strokes, collateral flow is essential for good outcome. Collateralized vessel intensity in TOF- and contrast-enhanced MRA is variable due to different acquisition methods. Our purpose was to quantify collateral supply by using flow-weighted signal in TOF-MRA and blood volume–weighted signal in contrast-enhanced MRA to determine each predictive contribution to tissue infarction and reperfusion.
MATERIALS AND METHODS:
Consecutively (2009–2013), 44 stroke patients with acute proximal anterior circulation occlusion met the inclusion criteria with TOF- and contrast-enhanced MRA and penumbral imaging. Collateralized vessels in the ischemic hemisphere were assessed by TOF- and contrast-enhanced MRA using 2 methods: 1) visual 3-point collateral scoring, and 2) collateral signal quantification by an arterial atlas-based collateral index. Collateral measures were tested by receiver operating characteristic curve and logistic regression against 2 imaging end points of tissue-outcome: final infarct volume and percentage of penumbra saved.
RESULTS:
Visual collateral scores on contrast-enhanced MRA but not TOF were significantly higher in patients with good outcome. Visual collateral scoring on contrast-enhanced MRA was the best rater-based discriminator for final infarct volume < 90 mL (area under the curve, 0.81; P < .01) and percentage of penumbra saved >50% (area under the curve, 0.67; P = .04). Atlas-based collateral index of contrast-enhanced MRA was the overall best independent discriminator for final infarct volume of <90 mL (area under the curve, 0.94; P < .01). Atlas-based collateral index combining the signal of TOF- and contrast-enhanced MRA was the overall best discriminator for effective reperfusion (percentage of penumbra saved >50%; area under the curve, 0.89; P < .001).
CONCLUSIONS:
Visual scoring of contrast-enhanced but not TOF-MRA is a reliable predictor of infarct outcome in stroke patients with proximal arterial occlusion. By atlas-based collateral assessment, TOF- and contrast-enhanced MRA both contain predictive signal information for penumbral reperfusion. This could improve risk stratification in further studies.
In stroke patients with acute proximal artery occlusion, collateral blood supply is pivotal for functional outcome.1 Collateral perfusion limits ischemic core expansion by maintaining oligemic tissue-at-risk until reperfusion takes place and is an independent predictor of final infarct volume and clinical outcome.1–3 Collaterals enhance recanalization and avert hemorrhagic transformation by minimizing severe local perfusion impairment.4,5 For rapidly applicable and reproducible collateral assessment in the triage of acute stroke, several angiographic scoring methods have been introduced.2,6–8 Contrary to DSA, direct visualization of time-resolved collateral flow in the leptomeningeal arteries is not possible with conventional CTA or MRA. Instead, the visual abundance of contrasted, collateralized vessels distal to the occlusion has been used as a surrogate scoring system for leptomeningeal collateral supply in high-resolution CTA.1,7,9 In particular, a malignant CTA collateral profile is highly specific for poor outcome.9
Collateral assessment using TOF- or contrast-enhanced (CE)-MRA is less straightforward. Visualization of collateralized vessels distal to mainstem occlusion is problematic in TOF-MRA, which is highly sensitive to low flow due to spin saturation.10,11 In CE-MRA, T1-shortening by gadolinium induces a vessel signal nearly independent of blood flow (for a sufficiently broad bolus) and primarily depends on blood volume (ie, intravascular volume). The different signal of collateralized vessels in both modalities may contain independent information; however, the efficacy of collateral assessment for outcome prediction attributed to each MRA technique has not been investigated in detail.11–14 Our purpose was to differentially quantify collateralized vessels in proximal anterior circulation occlusive strokes, including both flow-weighted signal in TOF-MRA and volume-weighted signal in CE-MRA, and to determine each predictive contribution to tissue outcome.
Materials and Methods
Patient Selection
Study data were acquired with institutional review board approval (Ethik-Kommission der Ärztekammer Hamburg). We screened consecutive patients with acute proximal occlusive stroke presenting to our department between January 2009 to August 2013 who met the study inclusion criteria: 1) occlusion of the intracranial ICA and/or the M1 segment of the MCA confirmed by DSA if available or CE-MRA; 2) pretreatment TOF-MRA, CE-MRA, DWI, and PWI within 6 hours after onset; 3) follow-up imaging within 72 hours; 4) NIHSS score of >4. Patients were excluded for poor image quality of MRA datasets or evidence of symptomatic intracranial hemorrhage with mass effect and signs of prior territorial stroke.
Image Acquisition
Patients were triaged with a standardized institutional acute stroke protocol for MR imaging independent of the study design. No extra contrast medium for CE-MRA was administered outside the routine clinical protocol. Admission stroke imaging was performed using a 1.5T MR imaging scanner (Magnetom Avanto; Siemens, Erlangen, Germany), including axial DWI, FLAIR, and TOF-MRA. Additional CE-MRA and PWI were performed in case of present proximal occlusion to guide and plan potential mechanical thrombectomy in light of current arguable evidence for benefit.15 TOF- and CE-MRA covered the distal internal carotid artery and the anterior and middle cerebral arteries (MCA up to third-order branches). CE-MRA also covered the extracranial ICA. TOF-MRA was acquired with 2 × 40 section slabs; 0.9-mm section thickness; 0.47 × 0.47 mm in-plane resolution; 512 × 384 matrix; TE, 7 ms; TR, 27 ms; flip angle, 25°; acquisition time, 130 seconds. CE-MRA was acquired in a coronal 1 × 112 section slab with 0.7 mm per section; TE, 1.4 ms; TR, 3.8 ms; 0.6 × 0.63 mm in-plane resolution; 512 × 384 matrix; flip angle, 25°; 10-mL bolus of gadopentetate dimeglumine (Magnograf; Marotrast, Jena, Germany) at 3 mL/s triggered by Care Bolus (Siemens); acquisition time, 2 × 45 seconds. Time-resolved perfusion raw data were acquired with 2D echo-planar imaging (22-mL bolus of gadopentetate dimeglumine; 5.0 mL/s; TE, 22 ms; TR, 1800 ms; flip angle, 80°; 26 sections; 4 mm per section) and an acquisition time of 113 seconds. Perfusion parameter maps (time-to-maximum [Tmax]) were calculated using an established in-house software (ANTONIA).16 The arterial input function for Tmax estimation was selected from the contralateral middle cerebral artery. Delay-corrected deconvolution for Tmax estimation was performed by standard singular value decomposition.
Image Analysis
The MRA signal intensity of MCA vasculature distal to the occlusion relative to the normal hemisphere was assessed as an indicator of leptomeningeal collateral supply to the MCA territory. This was accomplished by visual rater-based collateral scoring and automated-software-assisted quantification of collateral MRA signal in TOF- and CE-MRA.
Visual Collateral Scoring
Images of TOF-MRA and CE-MRA were evaluated independently by 2 raters (M.E. and A.K., certified neuroradiologists). Raters were blinded to clinical and concomitant admission and follow-up imaging data. MRA images were co-registered. Precise registration was checked by red-green shift, and images were presented as maximum intensity projections (20-mm slab thickness, 1-mm increment) (Fig 1).
Fig 1.

Illustration of visual collateral scores in TOF- and CE-MRA. A, Source images showing retrograde MCA filling in CE-MRA (scored 1) but not in TOF (scored 0) (arrowheads), with differing signal of collaterals as shown in red-green shift. B, No retrograde MCA filling in both, TOF- and CE-MRA (scored 0).
The visual collateral score (CS) in each MRA dataset (CSTOF and CSCE-MRA) was rated by visual abundance of MCA vascularity distal to the occlusion in the ischemic hemisphere compared with the normal side by using a 3-point grading scale (0 = none/poor, 1 = fair, 2 = good/normal) as used previously.1 The sinus and large veins were not included for scoring vasculature. Ratings were compared and decided by consensus if scores differed. A combined 5-point (0–4) collateral score, CScombined, was a priori defined as the sum of each separate TOF- and CE-MRA subscore to further subdivide and rank collateral status using both MRA modalities in conjunction (On-line Appendix).
Automated Atlas-Based Collateral Quantification
To include objective rater-independent quantification of collaterals with a continuous imaging parameter, we used an automated method to determine the relative vascular signal intensity of MCA vasculature in the ischemic hemisphere compared to the normal side. For this purpose, collateral vessel abundance (CVA) was measured by the signal intensity of all MCA vascular voxels in each hemisphere distal to the M1-MCA segment. This measurement was accomplished by using a statistical cerebroarterial atlas derived from 700 normal MRA datasets published elsewhere (On-line Appendix).17 The ratio of the MCA vascular intensities in the ischemic hemisphere compared to the normal hemisphere was defined as the collateral index (CI) (equation 1). The CI was determined in TOF- and CE-MRA datasets (CITOF and CICE-MRA). Any theoretical value of CI > 1 in equation 1 was truncated to 1.
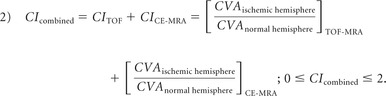
The combined collateral index, CIcombined, containing the collateral signal from TOF-and CE-MRA was defined by summing the CI of both MRA modalities. Any theoretical value of CIcombined of >2 in equation 2 was truncated to 2.
 |
Definition and Measurement of Tissue Outcome End Points
Collateral measures were tested against 2 imaging-based tissue outcome parameters. Final infarct volume (FIV) quantifies the absolute amount of tissue damage that is directly related to clinical outcome. The percentage of tissue-at-risk spared from infarction (percentage of penumbra saved, [PPS]) quantifies reperfusion per volume of tissue-at-risk. It is related to the efficacy of recanalization normalized to the volume of penumbra present at admission imaging. Imaging lesion masks were segmented with semiautomated edge detection by using a standardized operational definition (Analyze 11.0 software; AnalyzeDirect, Overland Park, Kansas). FIV was segmented section-by-section in follow-up imaging (targeted at 48-hour onset to imaging). For PPS calculation (equation 3), volume (VOL) of ischemic lesions in Tmax MR-perfusion maps and DWI were segmented. Tissue-at-risk to infarct was classified by Tmax bolus delay (VOLTmax) using a fixed window-level at the optimal threshold of 6 seconds with variable window width for optimal contrast (On-line Appendix).18–22 Lesion masks of tissue-at-risk (VOLTmax), initial ischemic core (VOLDWI), and final infarct volume were registered. PPS was calculated as follows:
Statistical Analysis
Normally distributed continuous variables are shown as mean and SD or as median and interquartile range for non-normal distribution; discrete variables are reported as counts and percentages. Interrater agreement for visual CS was determined by κ statistics. Spearman rank correlation coefficients were used to analyze correlations between visual collateral scores and tissue outcomes. The level of significance was defined as a 2-tailed P < .05. Multiple linear regression analysis was performed to test for independent association of visual (CSCE-MRA and CSTOF) and automated (CICE-MRA and CITOF) collateral measures with respect to continuous tissue outcome parameters (FIV and PPS).
Patients were a priori stratified by dichotomizing tissue outcome (good-versus-poor). FIV was dichotomized at 90 mL, which has been shown to be most specific for poor clinical outcome in a patient population with major strokes with anterior proximal artery occlusion.23 This highly specific cutoff for poor clinical outcome was chosen because it corresponds to a low rate of false-positives (low rate of falsely assuming poor outcome). A collateral measure that predicts FIV > 90 mL, therefore, indicates a high probability of futile recanalization with respect to clinical outcome, which is essential for treatment decisions when weighing benefits and risks.
PPS quantifies reperfusion in terms of tissue saved relative to ischemic core and penumbra. PPS was dichotomized at 50% to define effective reperfusion at the tissue level, which has been associated with good functional outcome in the Diffusion and Perfusion Imaging Evaluation for Understanding Stroke Evolution (DEFUSE) 2 trial.24 Stratified patients (good-versus-poor outcomes) were compared by using an unpaired t test (normal distribution) and Mann-Whitney U rank sum test (non-normal distribution) for quantitative continuous or discrete variables and the Fischer exact test for qualitative categoric variables, respectively.
Receiver operating characteristic (ROC) curve analysis was performed to quantify the resolving power and optimal cutoff value of each collateral imaging measure, single and in combination, to classify patients into good and poor tissue outcome (FIV < 90 mL and PPS > 50%). The collateral measures CScombined and CIcombined were defined above to test whether the added vascular signal of both, TOF- and CE-MRA, has a higher discriminative power for outcome than either one by itself.
The best performing collateral measures for good tissue outcome were further used in stepwise multivariate logistic regression analysis including the 3 most relevant univariate predictors of infarct growth and penumbral loss (admission NIHSS score, DWI infarct volume, and age).25–27
To assess the relative benefit of recanalization dependent on collateral status, we calculated the odds ratio for good outcome in patients with and without recanalization (On-line Appendix). Recanalization status was not included as a predictor in multivariate analysis because of statistical power.
The method of atlas-based collateral index to measure contrasted MCA vessels in CE-MRA secondary to retrograde filling via leptomeningeal collaterals was compared with DSA collateral scoring. DSA collateral scores were rated in intra-arterially treated patients and correlated with CICE-MRA. ROC curves between DSA and CICE-MRA for good outcome (FIV < 90 mL) were compared pair-wise (On-line Appendix).
All data analysis was performed with SPSS Statistics 20.0 (IBM, Armonk, New York) and Wolfram Mathematica 7.0 software (http://www.wolfram.com/mathematica/).
Results
The study included 44 patients with anterior circulation proximal occlusive strokes. Patients stratified by good-versus-poor tissue outcome and reperfusion (FIV < 90 mL and PPS > 50%) were comparable and not significantly different with regard to sex, side of occlusion, treatment, risk factors, and stroke etiology. The discharge NIHSS score was significantly higher in patients with poor tissue outcome parameters; age was lower in patients with PPS > 50% (Table 1). With regard to group statistics of imaging parameters (Table 2), visual CSCE-MRA but not CSTOF was significantly higher in patients with good outcome (FIV < 90 mL and PPS > 50%). Atlas-based CICE-MRA and CITOF were both significantly higher in patients with good outcome.
Table 1:
Patient characteristics stratified by good and poor tissue-outcome parameters
| Patient Characteristicsa | All Patients | Final Infarct <90 mL | Final Infarct >90 mL | P | Penumbra Saved >50% | Penumbra Saved <50% | P |
|---|---|---|---|---|---|---|---|
| Subjects (No.) (%) | 44 (100.0) | 29 (65.9) | 15 (34.1) | 33 (75.0) | 11 (25.0) | ||
| Age (yr) (mean ± SD) | 69.3 (14.8) | 65.9 (17.7) | 71.0 (13.0) | .34 | 61.7 (18.1) | 71.8 (12.8) | .05b |
| Sex (female) (No.) (%) | 28 (63.6) | 18 (62.1) | 10 (66.7) | 1.00 | 21 (63.6) | 7 (63.6) | 1.00 |
| Admit NIHSS (median, IQR) | 14 (10.3–19.8) | 14 (9.0–16.5) | 18 (12.0–21.0) | .05b | 14 (9.5–19.0) | 16 (14.0–20.0) | .13 |
| Discharge NIHSS (median, IQR) | 12 (4.0–19.3) | 7 (3.0–14.0) | 17 (9.0–23.0) | .01b | 9 (3.0–15.0) | 17 (11.0–33.0) | .01b |
| Left MCA infarction (No.) (%) | 24 (54.5) | 14 (48.3) | 10 (66.7) | .34 | 16 (48.5) | 8 (72.7) | .29 |
| Vessel occlusion | |||||||
| M1 segment of MCA (No.) (%) | 28 (63.6) | 21 (72.4) | 7 (46.6) | .11 | 22 (66.6) | 6 (37.5) | .49 |
| Carotid bifurcation/M1 segment (No.) (%) | 16 (36.4) | 8 (27.6) | 8 (53.3) | .11 | 11 (33.3) | 5 (26.7) | .49 |
| Treatment (No.) (%) | 44 (100.0) | ||||||
| Intravenous thrombolysis (No.) (%) | 15 (34.1) | 12 (41.4) | 3 (20.0) | .19 | 12 (36.4) | 3 (27.3) | .72 |
| IA mechanical therapy (No.) (%) | 29 (65.9) | 17 (58.6) | 12 (80.0) | .19 | 21 (63.6) | 8 (72.7) | .72 |
| Cardiovascular risk factors | |||||||
| Hypertension (No.) (%) | 30 (68.2) | 19 (65.5) | 11 (73.3) | .74 | 21 (63.6) | 9 (81.8) | .46 |
| Diabetes mellitus (No.) (%) | 7 (15.9) | 5 (17.2) | 2 (13.3) | 1.00 | 4 (12.1) | 3 (27.3) | .34 |
| Coronary heart disease (No.) (%) | 8 (18.2) | 6 (20.7) | 2 (13.3) | .70 | 7 (21.2) | 1 (9.1) | .66 |
| Atrial fibrillation (No.) (%) | 22 (50.0) | 15 (51.7) | 7 (46.7) | 1.00 | 17 (51.5) | 5 (45.5) | 1.00 |
| Smoking (No.) (%) | 8 (18.2) | 4 (13.8) | 4 (26.7) | .41 | 6 (18.2) | 2 (18.2) | 1.00 |
| Etiology | |||||||
| Atherothrombotic (No.) (%) | 16 (36.4) | 12 (41.4) | 4 (26.7) | .51 | 11 (33.3) | 5 (45.5) | .49 |
| Cardioembolic (No.) (%) | 18 (40.9) | 12 (41.4) | 6 (40.0) | 1.00 | 15 (45.5) | 3 (27.3) | .48 |
| Undetermined etiology (No.) (%) | 5 (11.4) | 3 (10.3) | 2 (13.3) | .64 | 4 (12.1) | 1 (9.1) | 1.00 |
| Other etiology (No.) (%) | 5 (11.4) | 2 (6.9) | 3 (20.0) | .31 | 3 (9.1) | 2 (18.2) | .59 |
Note:—IA indicates intra-arterial; IQR, interquartile range.
Continuous and discrete quantitative variables compared with the unpaired t test and Mann-Whitney U rank sum test, respectively. Qualitative categoric variables compared with the Fischer exact test.
Significant.
Table 2:
Imaging parameters and collateral measures (visual and automated TOF- and CE-MRA)
| Imaging Parametersa | All Patients | Final Infarct <90 mL | Final Infarct >90 mL | P | Penumbra Saved >50% | Penumbra Saved <50% | P |
|---|---|---|---|---|---|---|---|
| Tissue imaging measurements | |||||||
| Admit DWI infarct volume (mL) (mean ± SD) | 30.8 (41.0) | 16.3 (18.9) | 59.0 (56.2) | .01b | 22.6 (27.0) | 55.5 (63.3) | .12 |
| Final DWI infarct volume (mL) (mean ± SD) | 89.4 (114.9) | 25.3 (26.3) | 213.4 (119.1) | <.01b | 42.5 (47.8) | 230.2 (142.8) | .01b |
| Penumbra saved (%) (mean ± SD) | 68.5 (39.2) | 88.4 (22.2) | 30.0 (36.5) | <.01b | 89.5 (14.2) | 5.7 (12.9) | <.01b |
| Admit Tmax volume (mL) (mean ± SD) | 182.0 (97.0) | 158.3 (70.5) | 227.8 (124.7) | .06 | 189.5 (81.0) | 159.5 (136.9) | .50 |
| Successful recanalization (No.) (%) | 32 (73) | 25 (86) | 7 (47) | .01b | 27 (82) | 5 (45) | .05b |
| Visual collateral score (range, 0–2) | |||||||
| TOF-CS (mean ± SD) | .1 (.3) | .1 (.4) | .0 (.0) | .30 | .0 (.2) | .2 (.6) | .39 |
| CE-CS (mean ± SD) | 1.0 (.8) | 1.3 (.7) | .4 (.6) | <.01b | 1.1 (.8) | .6 (.8) | .01b |
| Atlas-based collateral index (range, 0–1) | |||||||
| TOF-CI (mean ± SD) | .39 (.09) | .42 (.07) | .35 (.09) | .01b | .42 (.07) | .32 (.07) | <.01b |
| CE-CI (mean ± SD) | .70 (.21) | .81 (.10) | .49 (.20) | <.01b | .77 (.12) | .49 (.26) | .01b |
Continuous and discrete imaging parameters compared with the unpaired t test and Mann-Whitney U rank sum test, respectively.
Significant.
Visual Collateral Scores
Visual CSTOF and CSCE-MRA were acquired with high interrater reliability (0.71 and 0.70, respectively). CSCE-MRA correlated with FIV (Spearman ρ = −0.48, P = .001) but not PPS (ρ = 0.26, P = .08). CSTOF did not correlate significantly with either tissue outcome parameter (ρ = −0.25, P = .1 and ρ = 0.16, P = .3, respectively). Accordingly, in multiple regression analysis, including both collateral scores, there was no independent predictive contribution of CSTOF to tissue outcome and only CSCE-MRA produced significant regression coefficients (FIV: β = −65.97, P = .004, R2 = 0.22; PPS: β = 0.21, P = .01, R2 = 0.11).
Atlas-Based Collateral Index
Atlas-based collateral signal significantly correlated with FIV and PPS. CICE-MRA was more strongly correlated with FIV (ρ = −0.70, P < .001) and PPS (ρ = 0.59, P < .001) than CITOF with FIV (ρ = −0.49, P < .001) and PPS (0.41, P < .006). Both modalities (CITOF and CICE-MRA) contributed independently in multiple regression to FIV (CICE-MRA: β = −430.04, P < .001; CITOF: β = −430.51, P < .001; R2 = 0.89) and PPS (CICE-MRA: β = 1.13, P < .001; CITOF: β = 1.16, P = .04; R2 = 0.54).
Visual CSCE-MRA and atlas-based CICE-MRA correlated significantly (Spearman ρ = 0.44, P = .003). Visual CSTOF and atlas-based CITOF did not correlate significantly (Spearman ρ = 0.07, P = .67).
CICE-MRA and DSA collateral scores correlated significantly with comparable discriminative power for good outcome (On-line Appendix). Volume of Tmax ischemia in admission imaging was negatively correlated with CICE-MRA (Pearson correlation coefficient = −0.33, P = .03).
ROC Curve Analysis
According to ROC curve analysis (Table 3), the discriminative power of visual CSCE-MRA for good infarct outcome (FIV < 90 mL) was high (AUC = 0.81; P < .01). Visual CSTOF performed poorly (AUC = 0.53, P = .15) without benefit using CScombined (AUC = 0.81, P < .01). The discriminative power of visual scoring for effective reperfusion (PPS > 50%) was overall low (CSCE-MRA: AUC = 0.67, P = .04; CSTOF: AUC = 0.53, P = .52). The discriminative power of atlas-based CI was higher for both tissue outcome parameters. For FIV < 90 mL, the overall best discriminator was CICE-MRA without significant benefit in combination with TOF (CICE-MRA: AUC = 0.94, P < .01; CIcombined: AUC = 0.95, P < .01). For effective reperfusion (PPS > 50%) both CICE-MRA and CITOF showed high AUC (AUC = 0.83, P < .001; AUC = 0.86, P < .001, respectively), and CIcombined performed best (AUC = 0.89, P < .001).
Table 3:
ROC curve analysis of visual and automated collateral measured for discriminating good tissue outcome (FIV < 90 mL and PPS > 50%)
| Collateral Measure | Final Infarct <90 mL |
Penumbra Saved >50% |
||||||||||
|---|---|---|---|---|---|---|---|---|---|---|---|---|
| AUC (± SE) | P | Optimal Criterion | Youden Index | Sens. (%) | Spec. (%) | AUC (± SE)a | P | Optimal Criterion | Youden Index | Sens. (%) | Spec. (%) | |
| Visual scoring (CS) | ||||||||||||
| CE-MRA | .81 (.07) | <.01b | ≥1 | .53 | 86.2 | 66.7 | .67 (.10) | .04b | >1 | .27 | 36.4 | 90.9 |
| TOF | .53 (.02) | .15 | ≥1 | – | – | – | .53 (.05) | .52 | – | – | – | – |
| TOF + CE-MRA | .81 (.07) | <.01b | ≥1 | .53 | 86.2 | 66.7 | .65 (.10) | .16 | – | – | – | – |
| Atlas-based collateral index (CI) | ||||||||||||
| CE-MRA | .94 (.04) | <.01b | >.68 | .76 | 89.7 | 86.7 | .83 (.10) | <.01b | >.64 | .70 | 87.9 | 81.8 |
| TOF | .74 (.08) | .01b | >.37 | .43 | 75.9 | 66.7 | .86 (.06) | <.01b | >.38 | .58 | 75.8 | 81.8 |
| TOF + CE-MRA | .95 (.03) | <.01b | >1.13 | .80 | 86.2 | 93.3 | .89 (.08) | <.01b | >1.05 | .76 | 84.9 | 9.9 |
Note:—Sens. indicates sensitivity; Spec., specificity.
AUC indicates area under the ROC curve with associated significance level P. Optimal criterion defines collateral parameter cutoff for maximized sensitivity and specificity by the Youden index.
Significant.
The best performing collateral measures by ROC curve analysis, CICE-MRA for infarct outcome (Fig 2A) and CIcombined for penumbral reperfusion (Fig 2B), were tested in multivariate logistic regression including admission NIHSS score, admission DWI volume, and age (Tables 4). For prediction of good infarct outcome, only CICE-MRA remained in the model, with significant independent predictive coefficients (Fig 2B). For prediction of good penumbral reperfusion, only CIcombined and age remained in the model with significant coefficients (Fig 2D).
Fig 2.

A and C, ROC curve analysis of best performing visual and atlas-based collateral measures (CSCE-MRA and CICE-MRA) for discriminating good tissue outcome (FIV < 90 mL) and reperfusion (PPS > 50%). B, Probability curve of FIV < 90 mL with increasing CICE-MRA calculated from the logit model by using the retained significant coefficients in Table 4. D, Probability curves of PPS > 50% with increasing CIcombined and age, calculated from the logit model by using the retained significant coefficients in Table 4.
Table 4:
Multivariate logistic regression of best collateral measure, admission NIHSS score, admission DWI volume, and age for prediction of good tissue outcome
| Final Infarct <90 mL |
Penumbra Saved >50% |
|||
|---|---|---|---|---|
| β-Coefficient | P | β-Coefficient | P | |
| CICE-MRA | 22.05 (7.33) | <.01a | ||
| CIcombined | 9.56 (3.09) | <.01a | ||
| Admission DWI infarct volume | −.27 (.24) | .26 | .01 (.02) | .73 |
| Admission NIHSS score | .46 (.49) | .34 | −.01 (.12) | .94 |
| Age (yr) | −.09 (.10) | .35 | .07 (.04) | .05a |
| Intercept β0 | 14.55 | 13.6 | ||
Significant.
Favorable odds for good outcome after recanalization was demonstrated in patients with good collaterals (defined by CICE-MRA cutoff of >0.68 in Table 3). The odds ratio for good outcome in recanalizers with good collateral status versus recanalizers with poor collateral status was 7.9 (P < .05). The odds ratio for good outcome in nonrecanalizers with good collateral status versus nonrecanalizers with poor collateral status was not significant (P = .11).
Discussion
In acute stroke triage, TOF-MRA and CE-MRA are frequently used sensitive methods for detecting large-vessel occlusion.11,12,14,28 Collateralized vessels distal to the proximal occlusion are visualized with higher intensity in CE-MRA than in flow-weighted TOF-MRA.11 However, a systematic collateral assessment in MRA, taking into account the differing vessel signal information contained in each MR imaging protocol for prediction of tissue outcome, has not been reported so far.13 The main purpose of this study was to prove the hypothesis that the MRA imaging-based surrogate marker of collateral supply is a predictor of tissue outcome. We measured the MRA collateral signal by a rater-independent and reproducible method to show how TOF- and CE-MRA signal differentially predict outcome. This may be particularly useful in future studies that rely on objective measures of collateral supply. In terms of clinical feasibility and immediate impact on care, rater-based scores are fast and easily applied; therefore, we included the evaluation of visual scoring.
Consistent with prior angiographic studies, our dataset confirms that in stroke patients with acute proximal anterior arterial occlusion, the existence of good collateral status assessed by MRA is associated with a high percentage of penumbra saved (ie, greater reperfusion at the tissue level) and lower final infarct lesion volume (Table 2).1,6,29,30 However, this association depends on the MRA technique and method of collateral quantification.
For visual assessment, CE-MRA collateral scoring was the best discriminator for classifying patients into good and poor tissue outcome (FIV < 90 mL, best cutoff ≥ 1; AUC = 0.81). The results suggest that no visible collaterals in CE-MRA (CSCE-MRA = 0) reliably identify patients with poor outcome and high probability of futile recanalization. CE-MRA scoring was only a moderate discriminator (best cutoff > 1, AUC = 0.67) for effective penumbral reperfusion (PPS > 50%). Collateral scoring by TOF-MRA alone performed poorly, and there was no multivariate additive benefit when using combined visual TOF- and CE-MRA collateral scores.
The reason for the overall poor discriminative power of visual TOF-MRA collateral assessment for prediction of FIV and PPS may be rooted within the inherent limitations of the TOF technique. The comparably long acquisition time more frequently leads to movement artifacts and degradation of image quality in comparison with CE-MRA.14 Among excluded screened cases due to poor image quality, 13 showed severe movement artifacts in TOF-MRA, but only 5 in CE-MRA. Further signal elimination in TOF-MRA may occur with a venous presaturation pulse saturating retrograde collateral arterial flow in the venous direction. Most important, TOF-MRA signal is highly susceptible to slow or in-plane blood flow due to saturation effects; therefore, slow collateral flow may not be displayed adequately, leading to an underestimation of collateral supply.7,10,11
In CE-MRA, the paramagnetic effect of the contrast agent provides a nearly flow-independent signal with real luminal filling allowing a better delineation of slow-moving blood in distal intracranial arteries, even though the spatial resolution of CE-MRA is lower compared with TOF.10 A disadvantage may be venous contamination of the CE-MRA signal. Large veins and sinus were excluded in visual scoring and were suppressed by low voxel probability in the atlas-based collateral index, but smaller draining veins may not be differentiated from arterial vasculature. However, this limitation may not be a disadvantage with respect to tissue outcome prediction. It is conceivable that signal from venous outflow could be indicative of collateralized tissue.
Computer-assisted image analysis was used to provide a continuous rater-independent imaging parameter for collateral status. In contrast to visual scoring, the overall discriminative power of atlas-based CI was higher for both tissue outcome parameters. The collateral index of CE-MRA was a reliable predictor of final infarct outcome (CICE-MRA: AUC = 0.94). Using the additional signal of TOF in combination with CE-MRA did not yield a significant predictive benefit (CIcombined: AUC = 0.95). However, the collateral index of TOF significantly contributed to prediction of penumbral reperfusion, which was best predicted by the combined TOF- and CE-MRA signal (CIcombined: AUC= 0.89). This observation may be linked to the physiologic concept of perfusion mismatch between low blood flow and blood volume for penumbral imaging.31 The apparent discrepancy of collateral signal when comparing TOF-MRA with CE-MRA may be a surrogate imaging feature for predicting tissue outcome. It is conceivable that a patient with adequate collateral signal in CE-MRA is likely to have better outcome if there is additional collateral signal in TOF-MRA (higher flow) compared with a patient who has a similarly adequate signal in CE-MRA but none in TOF-MRA (low flow). Thus, in analogy to “perfused tissue-at-risk,” a lower flow-weighted relative collateral signal in TOF concurrent with high blood volume–weighted collateral signal in CE-MRA could be an indicator for “collateralized tissue-at-risk.”
Only automated CITOF but not visual CSTOF showed significant resolving power for penumbral reperfusion, and CSTOF correlated poorly with CITOF. A reason may be that atlas-based analysis is not subject to rater variability and includes the signal intensity of all voxels with high vascular probability regardless of belonging to visual tubular structures. A further reason may due to the type of data scale. The collateral index, being a continuous imaging parameter, has a higher scale-based precision than discrete collateral scoring. The significance of visual TOF- and CE-MRA collateral mismatch for tissue outcome may be proved with a larger study population.
The best-performing collateral measures, CICE-MRA for good infarct outcome (FIV < 90 mL) and CIcombined for good penumbral reperfusion (PPS > 50%), were highly predictive against other known important prognostic factors (admission NIHSS score, age, admission DWI volume) by multivariate logistic regression. The curves from the logistic regression model (Fig 2B and 2D) show how the probability of good outcome increases with increasing favorable collateral measure independent of other variables included in the model. The results are important with respect to prior studies showing that collateral flow assessed by DSA or CTA is an independent predictor of outcome with respect to other known prognostic factors such as age, clinical stroke severity, baseline imaging characteristics, occlusion site, treatment, and recanalization.1,3,7,29,32
The treatment effect of recanalization on final infarct was dependent on collateral status (On-line Appendix). The odds for good tissue outcome were higher in recanalizers when good collaterals were present in CE-MRA compared with recanalizers with poor collaterals (odds ratio = 7.9, P < .05). Our results by odds ratios support the hypothesis that a favorable collateral status is required for good tissue outcome after recanalization. Thus, collateral assessment based on CE-MRA may augment patient selection in stroke triage and improve the benefit of treatment decisions.
Our study has limitations by design. For retrospective analysis, we defined a priori consecutively applied strict inclusion criteria. The inclusion criteria were chosen to focus on a homogeneous first-ever population of stroke patients with isolated proximal anterior circulation occlusions within definite imaging time windows. Consequently, the relatively small study size limited further multivariate analyses and stratification by recanalization status, stroke laterality, time to imaging, or treatment. Moreover, there may be selection bias inadvertently introduced by inclusion criteria of image technique and quality. Stratification by chosen imaging-based end points, even though specific for our study population, only indirectly relates to functional outcome.23,24 Further studies should include end points of long-term functional outcome. Rare cases with parenchymal hemorrhage and mass effect were a priori excluded to focus on prediction of ischemic tissue damage. Nonetheless, hemorrhagic infarction, if present, is a factor for poor clinical outcome in major strokes.
Results may not be translated to all types of TOF imaging protocols. For the 1.5T MR imaging scanner in this study, we used a standard TOF protocol for a fast clinical routine in stroke triage with sufficient visualization of major secondary and tertiary arterial branches. Collateral resolving power for outcome classification may improve considerably at higher field strengths with increased conspicuity of distal vessel segments combined with increased spatial imaging resolution.33 Furthermore, at the expense of limited acquisition time in stroke imaging, additional contrast could be achieved by using a superior saturation band and magnetization transfer contrast or by variation of saturation flip angles.
Conclusions
In ischemic stroke patients with proximal anterior circulation occlusion, visual collateral scoring of CE- but not TOF-MRA is a reliable predictor of infarct outcome. CE- and TOF-MRA both contain predictive signal information for penumbral reperfusion by quantitative atlas-based collateral assessment. Further research should target and differentiate flow- and blood volume–dependent signal of collateralized vasculature in stroke MR imaging for outcome prediction and patient stratification.
Supplementary Material
ABBREVIATIONS:
- AUC
area under the curve
- CE
contrast-enhanced
- CI
collateral index
- CS
collateral score
- CVA
collateral vessel abundance
- FIV
final infarct volume
- PPS
percentage of penumbra saved
- ROC
receiver operating characteristic
- Tmax
time-to-maximum
- VOL
volume
Footnotes
Disclosures: Jens Fiehler—UNRELATED: Consultancy: Codman, Stryker, MicroVention; Grants/Grants Pending: Codman, Stryker, MicroVention; Payment for Lectures (including service on Speakers Bureaus): Penumbra, Philips, Covidien; Travel/Accommodations/Meeting Expenses Unrelated to Activities Listed: Covidien.* *Money paid to the institution.
REFERENCES
- 1. Miteff F, Levi CR, Bateman GA, et al. The independent predictive utility of computed tomography angiographic collateral status in acute ischaemic stroke. Brain 2009;132:2231–38 [DOI] [PubMed] [Google Scholar]
- 2. Christoforidis GA, Mohammad Y, Kehagias D, et al. Angiographic assessment of pial collaterals as a prognostic indicator following intra-arterial thrombolysis for acute ischemic stroke. AJNR Am J Neuroradiol 2005;26:1789–97 [PMC free article] [PubMed] [Google Scholar]
- 3. Bang OY, Saver JL, Buck BH, et al. Impact of collateral flow on tissue fate in acute ischaemic stroke. J Neurol Neurosurg Psychiatry 2008;79:625–29 [DOI] [PMC free article] [PubMed] [Google Scholar]
- 4. Bang OY, Saver JL, Kim SJ, et al. Collateral flow predicts response to endovascular therapy for acute ischemic stroke. Stroke 2011;42:693–99 [DOI] [PMC free article] [PubMed] [Google Scholar]
- 5. Fiehler J, Remmele C, Kucinski T, et al. Reperfusion after severe local perfusion deficit precedes hemorrhagic transformation: an MRI study in acute stroke patients. Cerebrovasc Dis 2005;19:117–24 [DOI] [PubMed] [Google Scholar]
- 6. Kim JJ, Fischbein NJ, Lu Y, et al. Regional angiographic grading system for collateral flow: correlation with cerebral infarction in patients with middle cerebral artery occlusion. Stroke 2004;35:1340–44 [DOI] [PubMed] [Google Scholar]
- 7. Ishimaru H, Ochi M, Morikawa M, et al. Accuracy of pre- and postcontrast 3D time-of-flight MR angiography in patients with acute ischemic stroke: correlation with catheter angiography. AJNR Am J Neuroradiol 2007;28:923–26 [PMC free article] [PubMed] [Google Scholar]
- 8. Maas MB, Lev MH, Ay H, et al. Collateral vessels on CT angiography predict outcome in acute ischemic stroke. Stroke 2009;40:3001–05 [DOI] [PMC free article] [PubMed] [Google Scholar]
- 9. Souza LC, Yoo AJ, Chaudhry ZA, et al. Malignant CTA collateral profile is highly specific for large admission DWI infarct core and poor outcome in acute stroke. AJNR Am J Neuroradiol 2012;33:1331–36 [DOI] [PMC free article] [PubMed] [Google Scholar]
- 10. Yang JJ, Hill MD, Morrish WF, et al. Comparison of pre- and postcontrast 3D time-of-flight MR angiography for the evaluation of distal intracranial branch occlusions in acute ischemic stroke. AJNR Am J Neuroradiol 2002;23:557–67 [PMC free article] [PubMed] [Google Scholar]
- 11. Alfke K, Jensen U, Pool C, et al. Contrast-enhanced magnetic resonance angiography in stroke diagnostics: additional information compared with time-of-flight magnetic resonance angiography? Clin Neuroradiol 2011;21:5–10 [DOI] [PubMed] [Google Scholar]
- 12. Schellinger PD, Jansen O, Fiebach JB, et al. Feasibility and practicality of MR imaging of stroke in the management of hyperacute cerebral ischemia. AJNR Am J Neuroradiol 2000;21:1184–89 [PMC free article] [PubMed] [Google Scholar]
- 13. McVerry F, Liebeskind DS, Muir KW. Systematic review of methods for assessing leptomeningeal collateral flow. AJNR Am J Neuroradiol 2012;33:576–82 [DOI] [PMC free article] [PubMed] [Google Scholar]
- 14. Bash S, Villablanca JP, Jahan R, et al. Intracranial vascular stenosis and occlusive disease: evaluation with CT angiography, MR angiography, and digital subtraction. AJNR Am J Neuroradiol 2005;26:1012–21 [PMC free article] [PubMed] [Google Scholar]
- 15. Broderick JP, Palesch YY, Demchuk AM, et al. Endovascular therapy after intravenous t-PA versus t-PA alone for stroke. N Engl J Med 2013;368:893–903 [DOI] [PMC free article] [PubMed] [Google Scholar]
- 16. Forkert ND, Cheng B, Kemmling A, et al. ANTONIA perfusion and stroke: a software tool for the multi-purpose analysis of MR perfusion-weighted datasets and quantitative ischemic stroke assessment. Methods Inf Med 2014;53:469–81 [DOI] [PubMed] [Google Scholar]
- 17. Forkert ND, Fiehler J, Suniaga S, et al. A statistical cerebroarterial atlas derived from 700 MRA datasets. Methods Inf Med 2013;52:467–74 [DOI] [PubMed] [Google Scholar]
- 18. Davis SM, Donnan GA, Parsons MW, et al. Effects of alteplase beyond 3 h after stroke in the Echoplanar Imaging Thrombolytic Evaluation Trial (EPITHET): a placebo-controlled randomised trial. Lancet Neurol 2008;7:299–309 [DOI] [PubMed] [Google Scholar]
- 19. Albers GW, Thijs VN, Wechsler L, et al. Magnetic resonance imaging profiles predict clinical response to early reperfusion: the diffusion and perfusion imaging evaluation for understanding stroke evolution (DEFUSE) study. Ann Neurol 2006;60:508–17 [DOI] [PubMed] [Google Scholar]
- 20. Wheeler HM, Mlynash M, Inoue M, et al. Early diffusion-weighted imaging and perfusion-weighted imaging lesion volumes forecast final infarct size in DEFUSE 2. Stroke 2013;44:681–85 [DOI] [PMC free article] [PubMed] [Google Scholar]
- 21. Campbell BC, Christensen S, Levi CR, et al. Comparison of computed tomography perfusion and magnetic resonance imaging perfusion-diffusion mismatch in ischemic stroke. Stroke 2012;43:2648–53 [DOI] [PubMed] [Google Scholar]
- 22. Olivot JM, Mlynash M, Thijs VN, et al. Optimal Tmax threshold for predicting penumbral tissue in acute stroke. Stroke 2009;40:469–75 [DOI] [PMC free article] [PubMed] [Google Scholar]
- 23. Yoo AJ, Chaudhry ZA, Nogueira RG, et al. Infarct volume is a pivotal biomarker after intra-arterial stroke therapy. Stroke 2012;43:1323–30 [DOI] [PubMed] [Google Scholar]
- 24. Lansberg MG, Straka M, Kemp S, et al. MRI profile and response to endovascular reperfusion after stroke (DEFUSE 2): a prospective cohort study. Lancet Neurol 2012;11:860–67 [DOI] [PMC free article] [PubMed] [Google Scholar]
- 25. König IR, Ziegler A, Bluhmki E, et al. Predicting long-term outcome after acute ischemic stroke: a simple index works in patients from controlled clinical trials. Stroke 2008;39:1821–26 [DOI] [PubMed] [Google Scholar]
- 26. Yoo AJ, Barak ER, Copen WA, et al. Combining acute diffusion-weighted imaging and mean transmit time lesion volumes with National Institutes of Health Stroke Scale Score improves the prediction of acute stroke outcome. Stroke 2010;41:1728–35 [DOI] [PubMed] [Google Scholar]
- 27. Jung S, Gilgen M, Slotboom J, et al. Factors that determine penumbral tissue loss in acute ischaemic stroke. Brain 2013;136:3554–60 [DOI] [PubMed] [Google Scholar]
- 28. Jauch EC, Saver JL, Adams HP Jr, et al. Guidelines for the early management of patients with acute ischemic stroke: a guideline for healthcare professionals from the American Heart Association/American Stroke Association. Stroke 2013;44:870–947 [DOI] [PubMed] [Google Scholar]
- 29. Kucinski T, Koch C, Eckert B, et al. Collateral circulation is an independent radiological predictor of outcome after thrombolysis in acute ischaemic stroke. Neuroradiology 2003;45:11–18 [DOI] [PubMed] [Google Scholar]
- 30. Liebeskind DS, Tomsick T, Foster LD, et al. Collaterals at angiography and outcomes in the Interventional Management of Stroke (IMS) III trial. Stroke 2014;45:645–51 [DOI] [PMC free article] [PubMed] [Google Scholar]
- 31. Bivard A, Spratt N, Levi C, et al. Perfusion computer tomography: imaging and clinical validation in acute ischaemic stroke. Brain 2011;134:3408–16 [DOI] [PubMed] [Google Scholar]
- 32. Tan IY, Demchuk AM, Hopyan J, et al. CT angiography clot burden score and collateral score: correlation with clinical and radiologic outcomes in acute middle cerebral artery infarct. AJNR Am J Neuroradiol 2009;30:525–31 [DOI] [PMC free article] [PubMed] [Google Scholar]
- 33. Heverhagen JT, Bourekas E, Sammet S, et al. Time-of-flight magnetic resonance angiography at 7 Tesla. Invest Radiol 2008;43:568–73 [DOI] [PubMed] [Google Scholar]
Associated Data
This section collects any data citations, data availability statements, or supplementary materials included in this article.