Abstract
BACKGROUND AND PURPOSE:
Localization of the electrode after cochlear implantation seems to have an impact on auditory outcome, and conebeam CT has emerged as a reliable method for visualizing the electrode array position within the cochlea. The aim of this retrospective study was to evaluate the frequency and clinical impact of scalar dislocation of various electrodes and surgical approaches and to evaluate its influence on auditory outcome.
MATERIALS AND METHODS:
This retrospective single-center study analyzed a consecutive series of 63 cochlear implantations with various straight electrodes. The placement of the electrode array was evaluated by using multiplanar reconstructed conebeam CT images. For the auditory outcome, we compared the aided hearing thresholds and the charge units of maximum comfortable loudness level at weeks 6, 12, and 24 after implantation.
RESULTS:
In 7.9% of the cases, the electrode array showed scalar dislocation. In all cases, the electrode array penetrated the basal membrane within 45° of the electrode insertion. All 3 cases of cochleostomy were dislocated in the first 45° segment. No hearing differences were noted, but the charge units of maximum comfortable loudness level seemed to increase with time in patients with dislocations.
CONCLUSIONS:
The intracochlear dislocation rate of various straight electrodes detected by conebeam CT images is relatively low. Scalar dislocation may not negatively influence the hearing threshold but may require an increase of the necessary stimulus charge and should be reported by the radiologist.
The number of cochlear implantations is increasing rapidly, with improved hearing performance and speech recognition with time. Nevertheless, the auditory outcome varies among individuals, with the causes of this variability investigated in many studies with different results.1–6
The duration and cause of deafness are probably the most important factors contributing to the variability of outcomes.2,3,6 Additionally, motivation and cooperation of the patients have a strong influence on hearing performance.7 The electrode-modiolus distance and the preservation of inner ear structures are also important factors.8–10
In patients with adequate hearing in the low-frequency spectrum, the preservation of inner ear structures is important. Therefore, electrodes for atraumatic insertion were developed in recent years. Furthermore, different insertion techniques have been compared. Rajan et al9 showed that a slow electrode insertion speed can promote preservation of residual hearing. The favored operation technique is electrode access through the round window membrane. Alternatively, the electrode can be placed through a cochleostomy.
After surgery, the final placement of the electrode array within the cochlea can be documented with conebeam CT (CBCT). Due to the high resolution and low influence of metal artifacts, CBCT has emerged as a reliable technique in scalar localization of the electrode array, showing a sensitivity of 100% and specificity of 90%.11
According to Aschendorff et al,1 the intracochlear localization of the electrode has a significant impact on speech recognition. Insertion of the electrode array in the scala tympani is associated with a better outcome than insertion in the scala vestibuli. In addition, an intracochlear dislocation from the scala tympani to the scala vestibuli is related to decreased function. According to Shepherd et al,12 terminal sensorineural structures and spiral ganglia are more likely to be damaged when the electrode array is located in the scala vestibuli. In contrast to the 2 previous studies, Wanna et al13 could not find a correlation between the electrode location and auditory performance. More information on the frequency and clinical impact of the radiologic findings of a scalar dislocation of various electrodes and surgical approaches is needed.
The aim of this study was to analyze the intracochlear dislocation rate of various Med-EL electrodes (Innsbruck, Austria) and insertion depth by using CBCT and to correlate the relationship between electrode position in the cochlea and influence on aided hearing performance after implantation.
Materials and Methods
Basic Settings and Enrolled Patients
We analyzed cochlear implantations with various straight electrodes of different lengths and flexibility manufactured by Med-EL at the Department of Otorhinolaryngology, Medical University Innsbruck, in a retrospective manner. The electrode arrays used are listed in Table 1.
Table 1:
Summary the electrode arrays used
| Electrode Array Name | Length (mm) | Flexibility |
|---|---|---|
| FLEXsoft | 31 | Soft, single contact tip |
| FLEX 28 | 28 | Soft, single contact tip |
| FLEX 24 | 24 | Soft, single contact tip |
| Standard | 31 | Double contact tip |
Radiologic Evaluation
In all patients, the placement of the electrode array was evaluated the day after surgery, using CBCT, by a head and neck radiologist with 10 years' experience.
The system used was a CBCT scanner, KaVo 3D eXam (KaVo Dental, Biberach/Riß, Germany), by using the following protocol: 120 kVP; 37.07 mAs; voxel, 0.2 (0.2 × 0.2 × 0.2 mm); matrix, 768 × 768; FOV, 16 × 8 cm; rotation time, 26.9 seconds. The images were exported in DICOM format to a PACS and viewed by using Impax EE software (Agfa-Gevaert, Mortsel, Belgium) on a high-resolution diagnostic color LCD monitor CCL254i (Totoku Europe, Mönchengladbach, Germany). Multiplanar reconstructions were obtained by using the basal cochlear turn as a horizontal reference plane and a perpendicular vertical plane through the cochlear apex.
The location of the electrode array entry was evaluated as follows: 1) round window, 2) cochleostomy.
The position of the electrode array within the cochlea was described according to the intended positioning within the tympanic scala: 0 = tympanic scala, no dislocation, 1 = dislocation into the vestibular scala at 0°–45°, 2 = dislocation into the vestibular scala at 46°–90°, 3 = dislocation into the vestibular scala at 91°–135°, and so forth. Other dislocations, such as into the internal auditory canal or hypotympanic space, were morphologically described.
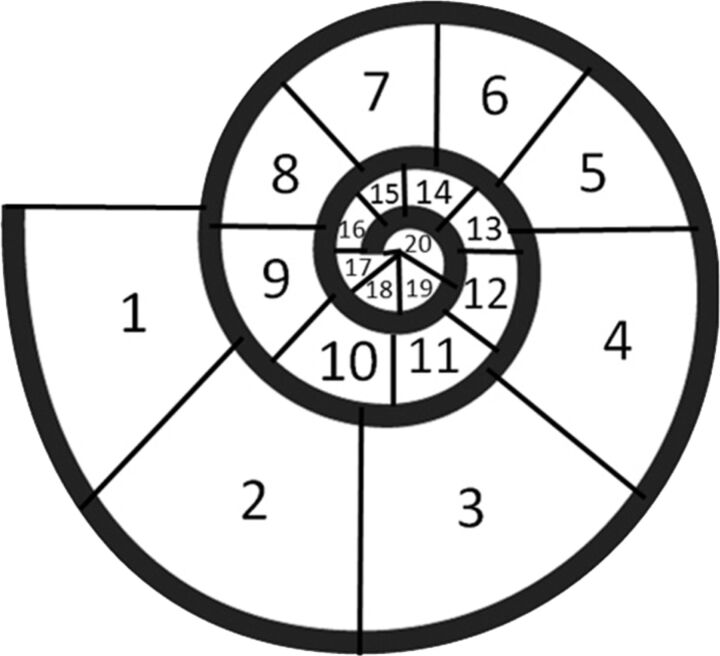
The insertion depth of the electrode array was evaluated in the horizontal reference plane by using maximum intensity projection reconstructions with a 5-mm section thickness. The insertion depth was defined according to the radial position of the tip. Therefore, the cochlea was divided into 20 segments of 45° each (Fig 1).
Fig 1.
Definition of the insertion depth of the CI according to the radial position of the tip: 1 = 0°–45°, 2 = 46°–90°, 3 = 91°–135°, 4 = 136°–180°, 5 = 181°–225°, 6 = 226°–270°, 7 = 271°–315°, 8 = 316°–360°, 9 = 361°–405°, 10 = 406°–450°, 11 = 451°–495°, 12 = 496°–540°, 13 = 541°–585°, 14 = 586°–630°, 15 = 631°–675°, 16 = 676°–720°, 17 = 721°–765°, 18 = 766°–810°, 19 = 811°–855°, 20 = 856°–900°.
Evaluation of Hearing Performance
The hearing thresholds of the cochlear implant (CI)-aided ear were assessed at frequencies 0.125/0.250/0.500/0.750/1/1.5/2/4/6/8 kHz under free field conditions. Patients were situated in a soundproof room with their CI in the tested ear activated and the device in the contralateral ear (if present) deactivated. Narrow band noises or warble tones with the above center frequencies were delivered from an audiometer via a loudspeaker located at a distance of 1 m in front of the patient. The level of the stimuli was calibrated according to European standards of EN 8253–3. The hearing thresholds were determined according to standard procedures used in audiometry.
For this study, we evaluated hearing threshold measurements obtained at 3 subsequent fitting sessions:
-
1)
Six weeks after implantation (ie, 2 weeks after first activation of the speech processor)
-
2)
Three months after implantation
-
3)
Six months after implantation.
In a second step, the charge units of maximum comfortable loudness level of the 2 groups were compared. The charge units after 6 weeks and 3 and 6 months were analyzed.
Furthermore, a retrospective evaluation was performed of the speech recognition tests used.
Statistical Analysis
In the group of patients with regular electrode insertions, statistics were calculated and used for comparison. Expecting a low number of dislocations, we planned an individual data evaluation.
Each frequency of the aided hearing threshold was analyzed separately. Frequency-specific thresholds of controls were averaged and depicted as a boxplot, indicating the median, the second and third quartiles (the box), and the range between the upper and lower extremes (the error bars).
Hearing thresholds of patients with electrode dislocation were individually compared with the findings from the control group. Their frequency-specific thresholds were added as points beside the boxplots to show their positions in relation to those of the group with regular inserted electrodes. Hearing thresholds were considered normal (ie, corresponding to those of the controls) if lying within the lower and upper extremes (ie, the error bars of the boxplot). Hearing thresholds beyond the extremes were considered abnormal.
Results
Sixty-three cochlear implantations of 59 adult patients were analyzed in this study. The patients were 7–85 years of age at implantation (mean, 51 ± 19.8 years). In the group with electrode dislocation, the mean age was 57 years; in the other group, it was 51 years; 52.5% were male and 47.5% female. The duration of deafness before implantation showed a large variability and ranged from >50 years to <1 year. In most cases, it was a progressive process, so the duration of deafness could not be determined exactly, but in both groups, the duration of deafness was similar. All patients had received the CI for the first time (no re-implantation) and were equipped with a CI system including an electrode: either the FLEX 28 (63.5%), FLEX 24 (3.2%), FLEXsoft (11.1%), or Standard (22.2%; Med-EL).
Radiologic Evaluation
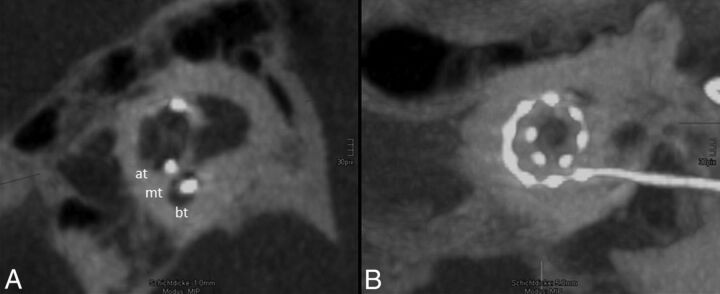
CBCT allowed clear visualization of the electrode array in the cochlea. The 12 electrodes on the array could be identified in all examinations (Fig 2B). On radiologic examination, in 5 of these implantations, an electrode dislocation was verified. The remaining 58 showed no signs of electrode misplacement and hence served as a control group for the assessment of the effects of a displaced electrode.
Fig 2.
Regular position of the electrode array. A, One-millimeter MIP reconstruction of the cochlea shows the basal turn (bt), medial turn (mt), and apical turn (at). The position of the electrode array is clearly identified in the scala tympani (the scala tympani is basal; the scala vestibuli is apical). B, The insertion depth by using 5-mm MIP reconstruction in the horizontal reference plane reaches position 11, which refers to 451°–495° (Fig 1). All 12 electrodes (dots) can be identified on the electrode array.
Electrode Dislocations
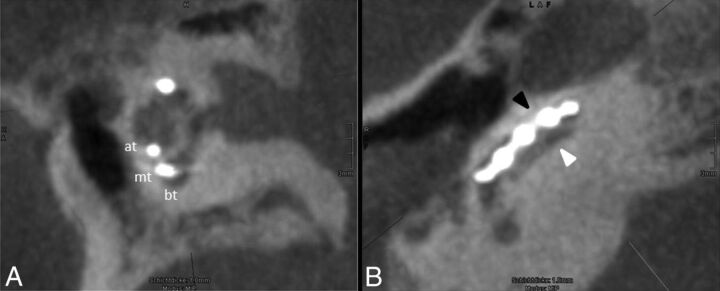
In 5 patients (7.9%), the electrode array was dislocated from the scala tympani to the scala vestibuli (Fig 3). The electrode array penetrated the basal membrane in the first 45° segment of the cochlea in all cases. The electrode was the FLEX 28 in all dislocated cases.
Fig 3.
Scalar dislocation. A, One-millimeter MIP reconstruction of the cochlea showing the basal turn (bt), medial turn (mt), and apical turn (at). The position of the electrode array is clearly identified in the scala tympani. B, A cut along the basal turn demonstrates the scalar dislocation from the scala tympani (basal, white arrowhead) into the scala vestibuli (apical, black arrowhead) within the first 45° of insertion.
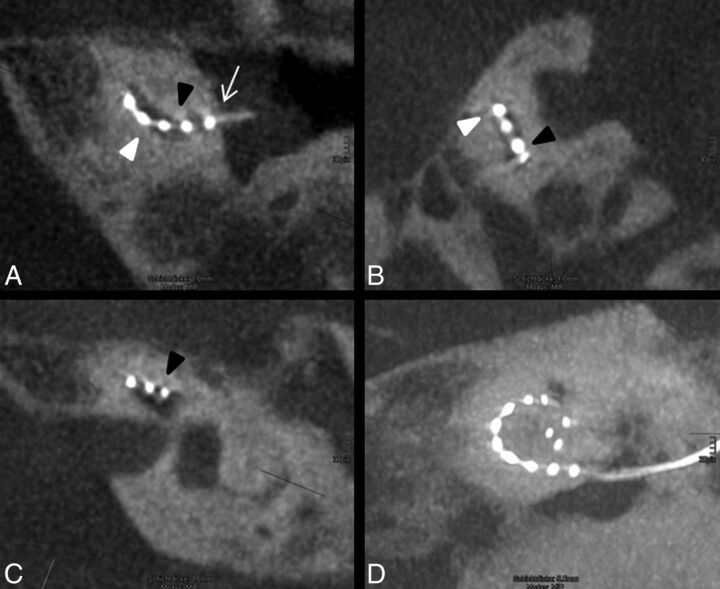
In the 3 included cochleostomy cases, the electrode dislocated from the scala tympani to the scala vestibuli (Fig 4).
Fig 4.
Atypical position of the electrode array. A, The electrode is inserted via cochleostomy (white arrow) and enters the basal cochlear turn from the scala vestibuli (apical, black arrowhead) into scala tympani (basal, white arrowhead). B, In the following course of the basal turn, the electrode array dislocates into the scala vestibuli. C, In the middle turn, the electrode array is clearly identified in the scala vestibuli. D, The insertion depth reaches position 8, which refers to 316°–360°, and the tip shows a kinking at the last electrode element.
Electrode Depth
In 95.2% (n = 60), the electrode was inserted through the round window, and in 4.8% (n = 3), a cochleostomy was performed. The shortest insertion depth was between 226° and 270°, and the deepest was nearly up to the helicotrema (855°). The mean insertion depth was between 451° and 495°, which refers to approximately 1 and one-half turns. Figure 2 shows the regular placement of the electrode.
Auditory Performance
In patients with a scalar dislocation of the electrode array, the mean hearing threshold 12 weeks after implantation at 1000 Hz was 38.8 ± 10.3 dB; in patients with a regularly positioned electrode array, the mean hearing threshold was 40.8 ± 10.0 dB.
After 24 weeks, the mean hearing threshold at 1000 Hz in patients with scalar dislocation was 34.0 ± 10.2 dB, and without dislocation, 38.2 ± 7.9 dB.
Table 2 shows the mean hearing thresholds at weeks 6, 12, and 24 after implantation in all patients.
Table 2:
Mean hearing thresholds at weeks 6, 12, and 24 after implantation
| 250 Hz | 1000 Hz | 4000 Hz | 8000 Hz | |
|---|---|---|---|---|
| After 6 weeks | 38.8 ± 10.3 dB | 43.6 ± 11.1 dB | 44.6 ± 44.6 dB | 47.0 ± 15.0 dB |
| After 12 weeks | 35.2 ± 9.9 dB | 41.0 ± 10.1 dB | 40.0 ± 10.1 dB | 44.5 ± 16.6 dB |
| After 24 weeks | 33.9 ± 8.8 dB | 37.8 ± 8.2 dB | 38.1 ± 9.8 dB | 38.6 ± 12.5 dB |
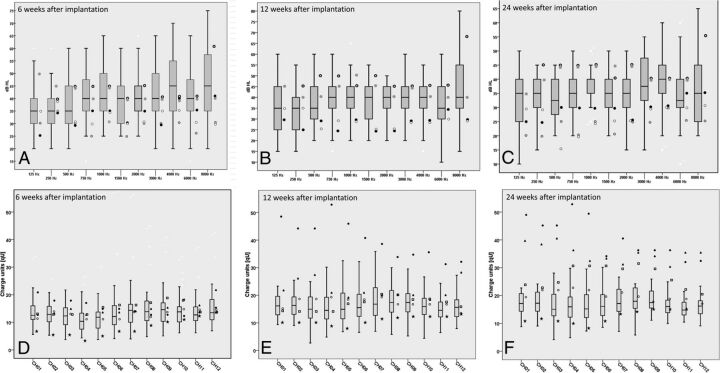
Frequency-specific hearing thresholds of controls at 6, 12, and 24 weeks are shown by the boxplots in Fig 5A–C. The hearing thresholds of the 5 patients with electrode dislocation are added as points. Fewer than 5 points (eg, Fig 5B) indicate missing data.
Fig 5.
A–C, The boxplots represent the hearing thresholds of the control group. The hearing thresholds of the 5 patients with electrode dislocation are added as points beside the boxplots. Frequency-specific hearing thresholds of controls at 6 weeks after implantation (A), at 3 months after implantation (B), and at 6 months after implantation (C). D–F, The boxplots show the charge units of maximum comfortable loudness levels. The symbols beside the boxplots show the 5 patients with electrode dislocation. The charge units after 6 weeks (D), 12 weeks (E), and 24 weeks (F).
The graphic visualizations show that the hearing thresholds of the 5 ears with dislocation are within the extremes of the control group. This means that the hearing thresholds in ears with electrode dislocation do not differ from those in the ears with correct electrode positions.
At week 6, the mean values of the charge units of maximum comfortable loudness were equal in both groups (13.6 ± 6.4 versus 13.5 ± 3.1). After 12 weeks, the charge units increased in patients without dislocation to 17.4 ± 7.1, and in patients with an electrode displacement, to 21.5 ± 11.2. At week 24, the differences between the 2 groups were even higher: 19.6 ± 10.3 without dislocation and 26.2 ± 11.7 in the other group (Fig 5D–F).
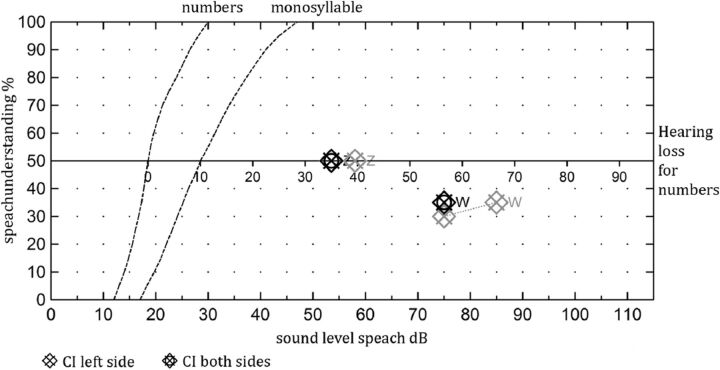
A reliable evaluation of the speech recognition tests was not possible in the selected test population because of the variety of patients. One of the included patients had bilateral implantation. One side was positioned adequately in the scala tympani, and the other side was dislocated in the scala vestibuli. The results are shown in Fig 6.
Fig 6.
The speech audiometry of a patient with a dislocated CI on the left side 9 months after surgery and a normally inserted electrode array on the right side 18 months after surgery. No differences in the speech performance could be noted in either ear for the understanding of numbers and monosyllables.
Discussion
This study investigated the electrode array location after cochlear implantation on multiplanar reconstructed CBCT images by using the basal cochlear turn as the horizontal reference plane and a perpendicular vertical plane through the cochlear apex. According to the histologic study of Marx et al,11 the electrode position within the cochlea can be reliably identified. When one knows that in multiplanar reconstructions, the tympanic scala is basal and the vestibular scala is apical, the liquid-filled space is seen above the electrode array when the electrode is located correctly in the scala tympani.
The electrodes investigated are known for the variety of soft, flexible arrays that were optimized for structure preservation. In 5 of 63 implantations (7.9%), however, the electrode array dislocated from the scala tympani to the scala vestibuli. In 3 of the 5 dislocated cases, the electrode array had been inserted through a cochleostomy; only 3.3% of all electrodes dislocated following round window insertion. This finding suggests that electrode insertion through a cochleostomy has a higher risk for electrode array dislocation.
These data support the results of Adunka et al,14 who showed, in 2004, that cochleostomy has a higher risk of destructive basal trauma (48%) compared with performing round window membrane insertions (15%).
In all cases, the electrode array penetrated the basal membrane in the first 45° segment of the cochlea. Choosing the wrong angle during insertion of the electrode array could be the underlying cause.
Trauma to inner ear structures ranges from displacement of the basilar membrane to fracture of the osseous spiral lamina, tearing of the basilar membrane or spiral ligament, and deviation of the electrode array into the scala media or scala vestibuli. Rebscher et al,15 who tested the insertion damage in correlation to the stiffness of 8 different models of electrode arrays, showed that electrode arrays with proportionately greater stiffness in the vertical plane were less likely to produce severe trauma during insertion. Severe damage, defined as an electrode array dislocation from the scala tympani into the scala media or scala vestibuli, varied in straight electrodes from 0% to 37.5% and in spiral types from 0% to 38.9%.
Compared with these dislocation rates, the electrode dislocation rate of the straight electrodes analyzed in this study was relatively low.
All 5 dislocations involved the FLEX 28 array, which was the most represented electrode in our cases (63.5%). Furthermore, the standard approach is a round window insertion. An electrode insertion via cochleostomy is the second choice only if an adequate exposure of the round window cannot be achieved. The predominance of the dislocations in cochleostomy cases can be explained by a more difficult surgical approach, resulting in a steeper insertion angle. The dislocation rate did not significantly correlate with the insertion depth.
The hearing threshold after cochlear implantation depends on the comprehensive postoperative fitting and tuning of the audio processor by experienced clinical personnel. The loudness has to be adapted in small steps, by the decreasing the thresholds with time. Some patients will not tolerate a hearing threshold <40 dB even after intensive training for years. The reason is mostly unknown. According to Aschendorff et al,1 the electrode dislocation, which is associated with a rupture of the basal membrane, has an impact on the postoperative hearing threshold. However, in our study, patients with a dislocation of the electrode array had approximately the same hearing threshold compared with patients without a dislocation (38.8 versus 40.8 dB after 12 weeks, 34.0 versus 38.2 dB after 24 weeks) (Fig 5A–C).
The efficiency of an intracochlear electrode is considered higher if the stimulating elements are positioned close to the site of neural activation. Electrode arrays designed to position stimulating contacts near the modiolus appear to operate with lower current thresholds than previous devices that were located closer to the lateral wall of the scala tympani.15–17 The charge units of maximum comfortable loudness level of the 2 groups were compared to determine whether an electrode dislocation was associated with higher stimulus charges.
The graphic visualizations (Fig 5D–F) show that charge units of maximum comfortable loudness levels of the 5 ears with dislocation at the first fitting are within the extremes of the control group. However, it seems that after 6 months, the required stimulus charge increased in patients with dislocation compared with the control group (Fig 5). The reason could be that the damage of the delicate inner ear structures creates a higher fibrosis.
These findings show that a postoperative control of the electrode position is also important for the fitting, because an increase of the necessary stimulus charge sometimes can be explained by the electrode array dislocation.
Of course, for the patient, the speech recognition is more important than the hearing threshold. However, previous research has shown that lower sound field thresholds with CIs correlate significantly with better speech recognition.18–20
A critical reflection on the study design reveals the lack of speech data. Because of the retrospective study design, speech recognition tests were not performed in all patients at the same time. A second reason was that some patients did not reach open-set speech recognition within the evaluated time. The preoperative speech recognition varied greatly within the study population. Because of the complex pathophysiologic interrelations of speech recognition, which are influenced by many factors such as duration and cause of deafness, the age of patients, and, in particular, nonobjectified factors such as motivation and cooperation and factors not yet fully known at the time, a larger study population is necessary to analyze the effects of the electrode dislocation on speech recognition. Therefore, it is very difficult to have 2 matched reference groups that have the same basic comparable conditions. This factor could be the reason for the variety of results published.2,3,6
An interesting finding is that in 1 patient who had bilateral implantation, CBCT showed that the electrode array inserted into the left cochlea was dislocated into the scala vestibuli and the tip showed a kinking at the last electrode element. On the right side, the electrode was located correctly in the scala tympani. No difference could be observed between the 2 ears. Neither the speech recognition test results nor the hearing thresholds varied. Most interesting, the charge units of the maximum comfortable loudness level at the first fitting in the dislocated ear were slightly higher and increased further after 6 months.
Wanna et al13 compared the audiologic outcomes of patients with bilateral implants. No differences of speech recognition between both ears could be found, even when the electrode array was dislocated on 1 side. A limiting factor of this study was the small number of included individuals. Nevertheless, this study supports our findings.
Precise localization of the electrode array may only be obtained in the basal turn of the cochlea and decreases along the medial and apical turns.21 Normal cochlear anatomy should not be obscured by the underlying disease process.22 Advantages of CBCT over multisection CT are lower radiation dose, less influence of metal artifacts, higher special resolution, and better visualization of the individual electrodes.23
Conclusions
CBCT multiplanar reconstruction imaging is an excellent tool for assessing cochlear implants and may show scalar dislocation of the CI electrode arrays within the first 45° segment. Various straight flexible electrodes have a low risk of dislocation into the scala vestibuli. However, patients requiring a cochleostomy for the electrode insertion may have a higher risk of experiencing a dislocation compared with patients with round window membrane insertions. Electrode array dislocation may have no negative effect on the hearing threshold but may require an increase of the necessary stimulus charge. The insertion and position of the electrode array in the cochlea should be reported by the neuroradiolgist.
ABBREVIATIONS:
- CI
cochlear implant
- CBCT
conebeam CT
REFERENCES
- 1. Aschendorff A, Kromeier J, Klenzner T, et al. Quality control after insertion of the nucleus contour and contour advance electrode in adults. Ear Hear 2007;28:75S–79S [DOI] [PubMed] [Google Scholar]
- 2. Blamey P, Arndt P, Bergeron F, et al. Factors affecting auditory performance of postlinguistically deaf adults using cochlear implants. Audiol Neurootol 1996;1:293–306 [DOI] [PubMed] [Google Scholar]
- 3. Blamey P, Artieres F, Baskent D, et al. Factors affecting auditory performance of postlinguistically deaf adults using cochlear implants: an update with 2251 patients. Audiol Neurootol 2013;18:36–47 [DOI] [PubMed] [Google Scholar]
- 4. Finley CC, Holden TA, Holden LK, et al. Role of electrode placement as a contributor to variability in cochlear implant outcomes. Otol Neurotol 2008;29:920–28 [DOI] [PMC free article] [PubMed] [Google Scholar]
- 5. van Wermeskerken GK, van Olphen AF, Graamans K. Imaging of electrode position in relation to electrode functioning after cochlear implantation. Eur Arch Otorhinolaryngol 2009;266:1527–31 [DOI] [PMC free article] [PubMed] [Google Scholar]
- 6. Wilson BS, Dorman MF. Cochlear implants: a remarkable past and a brilliant future. Hear Res 2008;242:3–21 [DOI] [PMC free article] [PubMed] [Google Scholar]
- 7. Fu QJ, Galvin JJ 3rd. Perceptual learning and auditory training in cochlear implant recipients. Trends Amplif 2007;11:193–205 [DOI] [PMC free article] [PubMed] [Google Scholar]
- 8. Esquia Medina GN, Borel S, Nguyen Y, et al. Is electrode-modiolus distance a prognostic factor for hearing performances after cochlear implant surgery? Audiol Neurootol 2013;18:406–13 [DOI] [PubMed] [Google Scholar]
- 9. Rajan GP, Kontorinis G, Kuthubutheen J. The effects of insertion speed on inner ear function during cochlear implantation: a comparison study. Audiol Neurootol 2013;18:17–22 [DOI] [PubMed] [Google Scholar]
- 10. Tamir S, Ferrary E, Borel S, et al. Hearing preservation after cochlear implantation using deeply inserted flex atraumatic electrode arrays. Audiol Neurootol 2012;17:331–37 [DOI] [PubMed] [Google Scholar]
- 11. Marx M, Risi F, Escude B, et al. Reliability of cone beam computed tomography in scalar localization of the electrode array: a radio histological study. Eur Arch Otorhinolaryngol 2014;271:673–79 [DOI] [PubMed] [Google Scholar]
- 12. Shepherd RK, Hatsushika S, Clark GM. Electrical stimulation of the auditory nerve: the effect of electrode position on neural excitation. Hear Res 1993;66:108–20 [DOI] [PubMed] [Google Scholar]
- 13. Wanna GB, Noble JH, McRackan TR, et al. Assessment of electrode placement and audiological outcomes in bilateral cochlear implantation. Otol Neurotol 2011;32:428–32 [DOI] [PMC free article] [PubMed] [Google Scholar]
- 14. Adunka O, Gstoettner W, Hambek M, et al. Preservation of basal inner ear structures in cochlear implantation. ORL J Otorhinolaryngol Relat Spec 2004;66:306–12 [DOI] [PubMed] [Google Scholar]
- 15. Rebscher SJ, Hetherington A, Bonham B, et al. Considerations for design of future cochlear implant electrode arrays: electrode array stiffness, size, and depth of insertion. J Rehabil Res Dev 2008;45:731–47 [DOI] [PMC free article] [PubMed] [Google Scholar]
- 16. Cords SM, Reuter G, Issing PR, et al. A silastic positioner for a modiolus-hugging position of intracochlear electrodes: electrophysiologic effects. Am J Otol 2000;21:212–17 [DOI] [PubMed] [Google Scholar]
- 17. Dorman MF, Spahr T, Gifford R, et al. An electric frequency-to-place map for a cochlear implant patient with hearing in the nonimplanted ear. J Assoc Res Otolaryngol 2007;8:234–40 [DOI] [PMC free article] [PubMed] [Google Scholar]
- 18. Davidson LS, Skinner MW, Holstad BA, et al. The effect of instantaneous input dynamic range setting on the speech perception of children with the nucleus 24 implant. Ear Hear 2009;30:340–49 [DOI] [PMC free article] [PubMed] [Google Scholar]
- 19. Firszt JB, Holden LK, Skinner MW, et al. Recognition of speech presented at soft to loud levels by adult cochlear implant recipients of three cochlear implant systems. Ear Hear 2004;25:375–87 [DOI] [PubMed] [Google Scholar]
- 20. Holden LK, Finley CC, Firszt JB, et al. Factors affecting open-set word recognition in adults with cochlear implants. Ear Hear 2013;34:342–60 [DOI] [PMC free article] [PubMed] [Google Scholar]
- 21. Güldner C, Wiegand S, Weiss R, et al. Artifacts of the electrode in cochlea implantation and limits in analysis of deep insertion in cone beam tomography (CBT). Eur Arch Otorhinolaryngol 2012;269:767–72 [DOI] [PubMed] [Google Scholar]
- 22. Lane JI, Witte RJ, Driscoll CL, et al. Scalar localization of the electrode array after cochlear implantation: clinical experience using 64-slice multidetector computed tomography. Otol Neurotol 2007;28:658–62 [DOI] [PubMed] [Google Scholar]
- 23. Ruivo J, Mermuys K, Bacher K, et al. Cone beam computed tomography, a low-dose imaging technique in the postoperative assessment of cochlear implantation. Otol Neurotol 2009;30:299–303 [DOI] [PubMed] [Google Scholar]


