

Abstract
Background:
Renal fibrosis is a common pathway in tubulointerstitial injury and a major determinant of renal insufficiency. Collagen deposition, a key feature of renal fibrosis, may serve as an imaging biomarker to differentiate scarred from healthy kidneys.
Purpose:
To test the feasibility of using quantitative magnetization transfer (qMT), which assesses tissue macromolecule content, to measure renal fibrosis.
Study Type:
Prospective.
Animal Model:
Fifteen 129S1 mice were studied four weeks after either sham (n=7) or unilateral renal artery stenosis (RAS, n=8) surgeries.
Field Strength/Sequence:
Magnetization transfer (MT)-weighted images were acquired at 16.4 T using an MT-prepared fast-low-angle-shot sequence. Renal B0, B1, and T1 maps were also acquired, using a dual-echo gradient echo, an actual flip angle, and inversion recovery method, respectively.
Assessment:
A two-pool model was used to estimate the bound water fraction (f), and other tissue imaging biomarkers. Masson’s trichrome staining was subsequently performed ex-vivo to evaluate renal fibrosis.
Statistical Tests:
Comparisons of renal parameters between sham and RAS were performed using independent samples t-test. Pearson’s correlation was conducted to investigate the relationship between renal fibrosis by histology and the qMT-derived bound pool fraction f.
Results:
The two-pool model provided accurate fittings of measured MT signal. The qMT-derived f of RAS kidneys was significantly increased compared to sham in all kidney zones (CO, 7.6±2.4% vs. 4.6±0.6%; OM, 8.2±4.2% vs. 4.2±0.9%; IM+P, 5.8±1.6% vs. 2.9±0.6%, all p<0.05). Measured f correlated well with histological fibrosis in all kidney zones (CO, Pearson’s correlation coefficient r=0.95; OM, r=0.93; IM+P, r=0.94, all p<0.05).
Data Conclusion:
The bound pool fraction f can be quantified using qMT at 16.4 T in murine kidneys, increases significantly in fibrotic RAS kidneys, and correlates well with fibrosis by histology. Therefore, qMT may constitute a valuable tool for measuring renal fibrosis in RAS.
Keywords: Quantitative magnetization transfer, Renal fibrosis, Histology, Renal artery stenosis
INTRODUCTION
Renal fibrosis is a common pathway in tubulointerstitial injury and a major determinant of renal insufficiency (1). It is characterized by excessive deposition of extracellular matrix components, including collagens (2). Progressive renal fibrosis often results in chronic kidney disease and even end-stage renal failure, requiring renal transplantation therapy. Its early diagnosis is useful for timely intervention to halt further renal damage (3). Currently, renal biopsy is the reference standard method to assess renal fibrosis, but is limited by its invasiveness, associated complications, and restricted tissue sampling (4).
Collagen deposition, a key feature of renal fibrosis, may serve as an imaging biomarker to differentiate scarred from healthy kidneys. The increase in macromolecular content can be delineated by magnetization transfer imaging (MTI), an magnetic resonance imaging (MRI) technique that evaluates magnetization exchange between protons in ‘free’ and ‘bound’ pools of biological tissues (5,6). In MTI, selective saturation of the water molecule pool that is bound to macromolecules induces a fall in the measured MR signal from the free water pool. Therefore, a simple measurement of the MT contrast, namely magnetization transfer ratio (MTR), reflects the macromolecular content in tissue, providing a powerful tool for assessment of renal fibrosis. Indeed, it has been previously demonstrated that MTI is insusceptible to a sudden drop in renal perfusion relative to other MRI techniques (7). Previous studies have demonstrated the feasibility of using MTR to detect microstructural disruptions in the brain (8), spinal cord injuries (9), and fibrosis (10). Recently, the utility of MTR in measuring renal fibrosis in mouse (11-13) and swine (14) models of kidney diseases has been demonstrated.
Nevertheless, the MTR is inherently semi-quantitative, and influenced by MRI pulse sequence parameters and intrinsic relaxation properties of tissues (15), which compromise its sensitivity, specificity, and reproducibility. However, quantitative MT (qMT) can be used to assess macromolecule content independent of these confounding factors. By model fitting of MR signals measured at a range of MT pulse amplitudes and offset frequencies along with B0/B1 corrections, qMT offers quantification of a composite tissue parameters, including the bound pool fraction (f; fraction of the tissue composed of bound pool) and tissue relaxation parameters (16,17). Notably, f is a direct measure of the macromolecule (e.g., collagen) content in tissue, and not subjected to scan or tissue-specific factors, such as perfusion pressure, elasticity, or oxygenation. Therefore, f may offer reliable assessment of renal fibrosis.
Recently, Wang et al. showed the utility of qMT in detecting renal fibrosis in mouse models of diabetic nephropathy (18) and progressive fibrosis (19) using 7.0 T MRI. Because only mild or localized fibrosis developed in these models, qMT-derived pool size ratio (PSR, the ratio between the bound and free pool magnetization) correlated with renal fibrosis by histology only in the renal cortex (CO) (18) or outer strip of outer medulla (OSOM) (19). The ability of qMT to measure fibrosis in other structurally and functionally distinctive kidney regions, including inner strip of outer medulla, inner medulla (IM), and papilla (P), remains to be tested. In this study, the feasibility of using qMT to measure renal fibrosis in a mouse model of unilateral RAS was investigated. This model is characterized by dramatically lower renal blood flow (12,20,21) and glomerular filtration rate (20,21), impaired renal cell viability (22), and extensive development of fibrosis in all kidney zones (12). Thus, it offers the chance to investigate the capability of qMT in measuring renal fibrosis in kidneys with greatly impaired renal hemodynamics and function. The hypothesis of this study was that qMT could reliably detect renal fibrosis in different kidney zones of RAS mice at 16.4 T.
MATERIALS AND METHODS
Animals.
This study was approved by the Institutional Animal Care and Use Committee at our institution. Fifteen 10 week-old male 129S1 mice underwent either sham (n=7) or RAS (n=8) surgeries on the right kidneys, as described previously (12,20-23). Briefly, animals were maintained under anesthesia with 1.75% isoflurane mixed with O2. In order to expose the kidney, a flank incision of approximately 1 cm was made. Following isolation of the renal artery, RAS was induced by placing a cuff (0.15mm inner diameter, 0.5mm long) made from a polytetrafluoroethylene tube (Braintree Scientific, Braintree, MA). Then the kidney was returned to position and the incision sutured. Sham surgeries involved the same procedure without cuff placement.
MRI.
All animals were scanned 4 weeks post-surgery on a vertical 16.4 T Bruker scanner equipped with a 38-mm inner diameter birdcage coil. Mice were anesthetized with 2% isoflurane mixed with oxygen in a mouse chamber, transferred to a mouse cradle, and kept in vertical position in the scanner. Anesthesia was maintained with 1-2% isoflurane during MRI, and warm air blown on the mice to keep their body temperature at ~36°C. Respiration and body temperature were monitored by a physiological monitoring system (SA Instruments, Stony Brook, NY).
The qMT protocol consisted of MT scans as well as B0, B1, and T1 mapping. Following a three-plane pilot scan, one 1.0-mm axial slice across the right kidney hilum was imaged with a field-of-view of 2.56×2.56cm2 and matrix size of 128×128. MT-weighted images were acquired using a MT-prepared fast-low-angle-shot sequence with the following parameters: repetition time (TR), 120ms; echo time (TE), 2.7ms; flip angle, 20°; number of averages, 4. Magnetization saturation was achieved using 9.3-ms Gaussian pulses. Sixteen images were acquired with 8 different offset frequencies (1, 2, 5, 8, 10, 20, 30, 50 kHz). As conventionally done (15,18,19), two flip angles at 450° and 900° were employed for the MT pulses, providing two different degrees of MT saturation over the offset frequency range used, allowing more reliable and robust fitting of qMT parameters.
B0 mapping was performed using a dual-echo gradient echo sequence (24) with the following parameters: TR, 120ms; TE1/TE2, 2.04/4.08ms; flip angle, 20°; number of averages, 4. B1 maps were acquired using an actual flip angle method (25) with two different repetition times at 40 and 200ms. Other parameters were: TE, 2.4ms; flip angle, 60°; number of averages, 8. T1 mapping was performed using an inversion recovery Rapid Acquisition with Relaxation Enhancement (RARE) method. A 10-ms long adiabatic pulse (sech80) was used for nonselective inversion of magnetization. To ensure high signal-to-noise ratio, a centric encoding scheme was implemented (22). Other imaging parameters were: TR, 18s; TE, 4.9ms; RARE factor, 16; recovery times, 0.023, 0.5, 1, 2, and 15s; number of averages, 1.
Image Analysis.
MRI images were analyzed using in-house developed modules in Matlab® (MathWorks, Natick, MA). To enhance the apparent image resolution, all MRI raw data were zero-padded to a matrix size of 256×256 prior to reconstruction, resulting in an in-plane resolution of 100×100 μm2. B0 maps were calculated using the phase difference between the two images at the two echo times (24), and subsequently applied to correct for B0 inhomogeneity during qMT model fitting. The actual flip angle θ was calculated as
where r and n are the ratios of two magnitude images and their TRs, respectively (25). Then, normalized B1 maps were calculated as the ratio between the actual and nominal flip angles, and used to correct for B1 inhomogeneity during qMT model fitting. T1 maps were generated using voxel-wise mono-exponential fitting with three unknown parameters including the inversion efficiency, T1, and full magnetization.
The qMT parameters were fitted voxel-wise using a two-pool model, in which the free water pool (a) is coupled to the bound pool (b) through magnetization exchange. According to the Henkelman-Ramani equation (17), the observed MR signal can be described by:
where g is a scan-specific scaling factor, the full magnetization of the free pool, R the magnetization exchange rate, f the bound pool fraction calculated as , Ra and Rb the longitudinal relaxation rates of the two pools, RRFb the bound pool RF absorption rate governed by a super-Lorentzian line shape, ωCWPE the continuous wave power equivalent frequency of the MT pulses, Δ the offset frequency, and the transverse relaxation time of the free pool. Rb was as set at 1 s−1 as conventionally done (15,18,19). The RRFb is determined by the transverse relaxation time of the bound pool (26). Therefore, five unknown parameters , , Ra(1 − f)/f, , and were fitted.
Then, the free pool longitudinal relaxation rate Ra was determined as (26):
where Raobs is the measured longitudinal relaxation rate from T1 mapping. The measured B0 and B1 maps were used to correct the offset frequency Δ and the continuous wave power equivalent frequency of the MT pulses ωCWPE, respectively. Given Ra, parameters of interest including f and were obtained. A single curve fitting included both datasets acquired with 450° and 900° MT saturation pulses to quantify the renal qMT parameters. In order to investigate the goodness-of-fit by this two-pool model, the square of the multiple correlation coefficient R2 was calculated for all kidney zones of sham and RAS mice.
Manual segmentation of kidney into CO, OM, and IM+P was empirically performed by two observers (K.J. and C.M.F. with 5 and 6 years of experience, respectively) on MT-weighted images, which showed an acceptable contrast among renal zones. Interobserver variability in the measured f was quantified as the percentage difference with respect to the mean for all kidney zones of sham and RAS mice. Because the sham kidney CO and OSOM typically showed modest contrast, arcuate vessels visible between these two zones were often used as landmarks to assist segmentation. RAS kidneys exhibited a good contrast between these regions, likely due to greater structural damage in the OSOM sensitive to hypoxia (12). The IM+P showed stronger signal in the MT-weighted images, aiding segmentation from the OM. The mean and standard deviation values of T1, , , , , and f were calculated for each zone of sham and RAS kidneys.
Additionally, the renal MTR was quantified by using the MT-weighed image (Mt) acquired at 1500 Hz with the MT pulse flip angle at 900°, with the MT-weighted image acquired at 50 kHz with the MT pulse flip angle at 450° as the M0 image. The MTR was calculated as (1-Mt/M0)×100%, using the same regions-of-interest used in the qMT analysis.
Histology.
All animals were euthanized after MRI and kidneys harvested. A 5-μm axial slice of the kidney was selected and cut carefully to match the MR imaging slice. Masson’s trichrome staining was performed to detect renal fibrosis, and the whole tissue section imaged using a Carl Zeiss microscope (Carl Zeiss SMT, Oberkochen, Germany). The extent of renal fibrosis was quantified as the fraction of fibrotic area over the entire cross-sectional area of the tissue using a thresholding-based method implemented in Matlab, as described previously (27). Briefly, the subtraction image of the red and blue channels, which offered the best contrast between normal and fibrotic tissues, was used for extraction of renal fibrosis. Appropriate thresholds were selected for CO, OM, and IM+P, based on the different color tones.
Statistical Analysis.
All statistical analysis was performed in the Statistical Package for the Social Sciences (SPSS Version 26; IBM Corporation; Chicago, IL). Normality of data was tested using Shapiro-Wilk test. Renal parameters were compared between sham and RAS using independent-samples t-test assuming unequal variance. For statistical comparison among different kidney zones within the same mice, one-way analysis of variance test followed by paired-samples t-test was used. Pearson’s correlation was conducted to investigate the relationship between renal fibrosis obtained from histology, the qMT-derived bound pool fraction f and , and MTR. Results were considered statistically significant with P<0.05.
RESULTS
Animal Characteristics.
At 4 weeks after surgery, the 14-week old sham (28.5±1.6 g) and RAS (29.2±2.1 g) mice showed similar body weight. Yet, unilateral RAS caused a sharp drop in the weight of the stenotic kidney compared to the right sham kidney (57.6±8.3 vs. 184.4±8.7 mg, P<0.001), confirming a hemodynamically significant stenosis. In contrast, the contralateral kidney of RAS mice had a mild hypertrophy compared to sham counterparts (229.6±41.2 vs. 179.8±17.8 mg, P=0.013).
Renal Parameters by qMT.
Fig. 1a shows representative MT-weighed images obtained with offset frequencies at 1, 8, and 50 kHz for sham and RAS kidneys, as well as tissue segmentation into CO, OM, and IM+P. Noticeably, a lower offset frequency induced more magnetization saturation, resulting in lower detected MR signal. Fig. 1c shows representative experimentally-acquired and model-fitted MT signal intensity curves as a function of offset frequency in CO (left), OM (middle), and IM+P (right) of sham and RAS kidneys. Importantly, the normalized signal intensity of the RAS kidney showed lower signal intensity in all three kidney zones, indicating a higher MT contrast and thereby potentially larger macromolecule content. For all kidneys and zones, the two-pool model provided accurate fittings of the MT signal changes with offset frequency at both MT flip angles (450° and 900°), with the multiple correlation coefficients R2 ranging from 0.97 to 0.99 in all kidney zones.
Figure 1. Fitting of the acquired MT signal using a two-pool model.

Representative MT-weighed images obtained with offset frequencies at 1, 8, and 50 kHz for sham (a) and RAS (b) kidneys, respectively. Manually traced contours for CO, OM, and IM+P are also illustrated. The experimentally-acquired and model-fitted MT signal intensity (SI) curves as a function of offset frequency in CO, OM, and IM+P of sham and RAS kidneys (c). For both kidney types and all kidney zones, the two-pool model provided faithful fittings of the MT signal changes with offset frequency at both MT flip angles (450° and 900°). MT=magnetization transfer; RAS=renal artery stenosis; CO=cortex; OM=outer medulla; IM+P=inner medulla plus papilla.
As shown in Fig. 2a and Table 1, while no difference was observed in the T1 of CO and OM between sham and RAS kidneys, the latter showed lower T1 in the IM+P (P<0.001). Representative qMT-derived , , and maps of sham and RAS kidneys are shown in Fig. 2b-d. Similar to T1, a decrease in the free pool T1 relaxation time occurred in IM+P of RAS kidneys, as compared to sham controls (Table 1, P<0.001). The free pool transverse relaxation time dropped in all three kidney zones (CO, P=0.011; OM, P=0.012; IM+P, P<0.001), while no change in the bound pool transverse relaxation time was observed. The unitless was comparable in different kidney zones of sham and RAS mice. Despite a higher macromolecule content, RAS mice had lower compared to sham controls (P<0.05 in all kidney zones), possibly caused by a lower magnetization exchange rate R between the free and bound pools in fibrotic kidneys.
Figure 2. Tissue relaxation parameters derived by qMT.
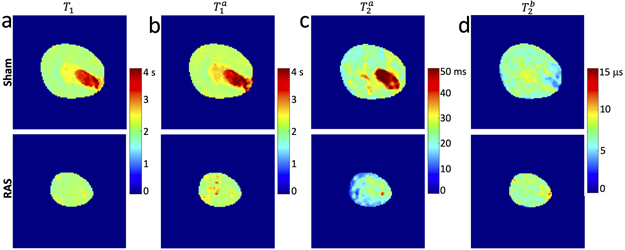
Representative T1 (a), , , and maps of sham (upper row) and RAS (lower row) kidneys. Both T1 and showed no change in the CO and OM, but a decrease in the IM+P of RAS kidneys, compared to sham controls. Notably, a great variation in medullary T1 and was observed across the RAS mice. This stenotic kidney had severe functional loss and no clear demarcation was present in different kidney zones. The free pool transverse relaxation time dropped in all three kidney zones, while no change in the bound pool transverse relaxation time was observed. qMT=quantitative magnetization transfer; RAS=renal artery stenosis. CO=cortex; OM=outer medulla; IM+P=inner medulla plus papilla.
Table 1.
Comparison of MRI-derived renal parameters in sham and RAS kidneys
| Kidney Zone |
Animal Group |
T1 (s) | (s) | (ms) | (μs) | |
|---|---|---|---|---|---|---|
| CO | Sham | 1.9±0.1 | 2.1±0.1 | 29.2±9.5 | 7.4±1.3 | 3.5±0.6 |
| RAS | 1.9±0.2 | 2.2±0.2 | 14.9±3.4* | 8.1±1.5 | 1.9±0.5* | |
| OM | Sham | 2.1±0.1† | 2.2±0.1† | 31.4±12.1† | 7.1±0.8 | 3.9±0.8 |
| RAS | 2.1±0.2† | 2.2±0.2 | 22.2±2.0*† | 7.7±1.7 | 1.7±0.6* | |
| IM+P | Sham | 2.9±0.2†‡ | 3.1±0.2†‡ | 70.4±4.3†‡ | 7.5±2.1 | 3.7±0.9 |
| RAS | 2.3±0.2* †‡ | 2.4±0.3* †‡ | 20.8±6.6* †‡ | 7.6±1.7 | 1.5±0.6* |
Data expressed as mean ± standard deviations. CO=cortex; OM=outer medulla; IM+P=inner medulla and papilla.
P<0.05 vs. Sham
P<0.05 vs. CO of the same group
P<0.05 vs. OM of the same group.
Fig. 3a shows representative MTR and f maps overlaid on MT images (at 50 kHz) of the same sham and RAS kidneys. Compared to sham, all RAS kidney zones increased (Fig. 3b) the measured MTR (CO:62.4±4.2% vs. 55.4±2.2%, P=0.001; OM:62.6±4.2% vs. 55.4±2.9%, P=0.001; IM+P:55.7±3.1% vs. 48.0±7.2%, P=0.029) and f (CO:7.6±2.4% vs. 4.6±0.6%, P=0.006; OM:8.2±4.2% vs. 4.2±0.9%, P=0.002; IM+P:5.8±1.6% vs. 2.9±0.6%, P=0.001). The f maps yielded more distinctive increases in RAS kidneys (1.6- to 2-fold) than MTR maps (12.6-16.2%).
Figure 3. The MTR and qMT-derived bound pool fraction.

a. Representative MTR (upper) and qMT-derived f maps (lower) overlaid on the MT-weighted images (50 kHz) of sham (left) and RAS (right) kidneys, b. Box plots show the measured MTR (upper) and f (lower) in the CO, OM, and IM+P of sham and RAS mice. Compared to sham controls, the measured MTR and f in the RAS kidneys rose significantly in all kidney zones. Notably, larger changes in f was observed than those in the MTR across all kidney zones. *P<0.05 vs. Sham; †P<0.05 vs. CO of the same group; ‡P<0.05 vs. OM of the same group. qMT=quantitative magnetization transfer; MTR=magnetization transfer ratio; RAS=renal artery stenosis. CO=cortex; OM=outer medulla; IM+P=inner medulla plus papilla.
Interobserver bias and variation in f showed small percentage difference in both sham (CO: 1.1±0.7%; OM: 1.6±1.2%; IM+P: 2.5±1.4%) and RAS (CO: 3.6±2.0%; OM: 3.9±2.2%; IM+P: 1.8±1.8%) kidneys, suggesting good reproducibility of kidney segmentation and f quantification.
Renal Fibrosis by Histology.
Fig. 4a shows representative Masson’s trichrome-stained kidney sections of sham and RAS kidneys, as well as a corresponding renal fibrosis map of the RAS kidney by the thresholding technique. The quantified fibrosis in RAS kidneys was significantly elevated in all renal zones compared to sham (Fig. 4b, CO: 7.6±2.2% vs. 0.6±0.5%, P<0.001; OM: 16.3±8.2% vs. 1.6±0.9%, P=0.001; IM+P: 19.1±6.7% vs. 0.9±0.5%, P=0.001). In RAS kidneys, both OM (P=0.011) and IM+P (P<0.001) showed greater fibrosis than the CO.
Figure 4. Renal fibrosis by Masson’s trichrome staining.

a. Representative Masson’s trichrome-stained kidney sections of sham (left) and RAS (middle) kidneys. Corresponding renal fibrosis map of the RAS kidney by the thresholding technique is also demonstrated (right), with renal fibrosis in the CO, OM, and IM+P is shown on a dark purple background as red, green, and blue colors, respectively, b. Box plots show the quantified fibrosis in sham and RAS kidneys. Excessive renal fibrosis is found in all three renal zones of the RAS kidneys compared to sham controls. *P<0.05 vs. Sham; †P<0.05 vs. CO of the same group. RAS=renal artery stenosis. CO=cortex; OM=outer medulla; IM+P=inner medulla plus papilla.
Association Between the Bound Pool Fraction and Renal Fibrosis.
A representative Masson’s trichrome-stained kidney section of a RAS kidney is shown in Fig. 5a. Extensive tubulointerstitial fibrosis developed in this kidney, illustrated in the thresholding-generated fibrosis map. Small foci of possible necrosis can also be observed. The corresponding MTR and qMT-derived f maps of the same kidney are also shown in Fig. 5a. Excessive renal fibrosis showed good spatial concordance with regions of high f values, while foci of renal necrosis matched spatially with voxels with low f values. In contrast, renal fibrosis showed a more modest spatial agreement with the MTR map. While MTR significantly correlated with the histological fibrosis in the CO (Fig. 5b, Pearson’s correlation coefficient r=0.70; P=0.004), OM (r=0.85; P<0.001), and IM+P (r=0.65, P=0.009), stronger correlations were found between the qMT-derived f and histological fibrosis (Fig. 5c, CO, r=0.95; OM, r=0.93; IM+P, r=0.94. P<0.001 for all). Similarly, the qMT-derived free-pool T2 () showed weaker correlations with renal fibrosis (Fig. 5d, CO, r=0.73, P=0.005; OM, r=0.58, P=0.038; IM+P, r=0.89, P<0.001).
Figure 5. Association between renal fibrosis and the MTR, bound pool fraction f, and feel pool T2.

a. Representative Masson’s trichrome-stained kidney section of a RAS kidney (fibrosis: blue and black arrowheads). For better visualization, the thresholding-generated renal fibrosis map shows fibrosis in red on an aqua background. The MTR map at 1500 Hz and the corresponding qMT-derived f map of the same kidney are also shown, b. Correlation between the measured MTR and renal fibrosis in the CO (left), OM (middle), and IM+P (right), c. Correlation between the qMT-derived f and renal fibrosis in the CO (left), OM (middle), and IM+P (right). d. Correlation between the qMT-derived free-pool T2 and renal fibrosis in the CO (left), OM (middle), and IM+P (right). qMT=quantitative magnetization transfer; MTR=magnetization transfer ratio; RAS=renal artery stenosis; CO=cortex; OM=outer medulla; IM+P=inner medulla plus papilla.
DISCUSSION
This study demonstrates the feasibility of qMT at ultrahigh magnetic field strength of 16.4 T in mouse kidneys with unilateral RAS, and its superiority to MTR. Increased macromolecular content in fibrotic kidneys is successfully captured by qMT, as evidenced by the increased bound pool fraction f. It also distinguishes relaxation properties of different kidney zones and animal groups, potentially revealing additional features of fibrotic kidneys. The utility of qMT-derived f as an index of renal fibrosis is further supported by the good spatial concordance between the f map and histology, as well as the significant correlations between the quantified f and fibrosis by histology in all kidney zones.
Renal fibrogenesis
Renal fibrosis is complex, involves a number of independent and overlapping cellular and molecular pathways, and results from a maladaptive wound healing process of the kidney that had gone awry (1). Upon insult, peritubular infiltration of inflammatory cells is initiated with an attempt to repair tissue damage (28,29). Nevertheless, sustained injury causes non-resolving inflammation, triggering activation and expansion of myofibroblasts and the onset of renal fibrogenesis (30). Development of renal fibrosis is often accompanied by other events, including hypoxia, inflammatory infiltration, edema, tubular atrophy, and tissue necrosis, which provide unique opportunities to explore useful imaging biomarkers of renal fibrosis (31).
MRI Techniques for Renal Fibrosis and Limitations
Several MRI techniques, including blood oxygenation level-dependent (BOLD) MRI (32-34), diffusion-weighted MRI (35,36), and MR elastography (MRE) (37,38) have shown promise for measuring renal fibrosis. Nevertheless, BOLD (31) and diffusion (8,11,14-16) MRI are limited by low specificity, and might be affected by fibrosis-independent changes in renal structure and function. Similarly, kidney stiffness by MRE varies with functional parameters such as renal perfusion pressure (37,38), and may therefore paradoxically fall with a decrease in renal blood flow (20,21,23). Therefore, a robust imaging biomarker that is less affected by confounding factors is needed for more reliable assessment of renal fibrosis. In contrast, MT-MRI evaluates the macromolecule content, which is less affected by co-existing hemodynamic factors (7). This supports the possible usefulness of MT-MRI, which directly quantifies the macromolecule content, in assessing the elevated collagen deposition in renal fibrosis.
Magnetization Transfer Imaging of Renal Fibrosis
MT-MRI can be acquired by either semi-quantitative MTR or qMT. The MTR measurement is straightforward, with only one image acquired at a single magnetization saturation offset frequency and the other without saturation. However, its usefulness in measuring renal fibrosis may be limited to severely fibrotic kidneys (12,14,33), because inherent factors other than macromolecule content may lower the sensitivity of MTI in detecting renal fibrosis (18,19). In comparison, qMT employs more sophisticated and accurate biophysical models, accounts for scanning-related factors, and correlate better with renal fibrosis compared to MTR (18,19). Additionally, to further enhance the sensitivity of qMT, a threshold PSR was also proposed (18,19), which may nonetheless under- or over-estimate the amount of renal fibrosis due to the partial volume effect in MR images. In this study, with extensive fibrosis in RAS kidneys, the averaged bound pool fraction f was used. Compared to MTR, f showed more prominent increases in fibrotic kidneys, supporting its greater dynamic range and sensitivity for renal fibrosis. Furthermore, its stronger relationship with histological fibrosis compared to MTR underscored higher reliability of qMT for measuring renal fibrosis.
In addition to f, other qMT-derived tissue relaxation properties may provide useful indices regarding fibrotic kidneys. The increase in T1 from CO and OM to IM+P is consistent with the topography and function of different kidney zones. Unlike trichrome staining, T1 showed a dramatic decrease in RAS IM+P, consistent with rising fluid content along the distal nephron towards the renal collecting system. Nevertheless, cortical and outer-medullary T1 were similar in sham and RAS kidneys, indicating its low sensitivity for renal fibrosis. The free-pool longitudinal relaxation time showed a comparable pattern. The qMT model-fitted free pool transverse relaxation time showed increasing values from renal CO to IM+P, again consistent with rising fluid content. Notably, closely matched T2 values established by T2 mapping in normal mouse kidneys at 16.4 T (22), suggesting that the two-pool model provided a good physical description of the system. Moreover, the value of , like tissue T2 measured by T2 mapping, is strongly dependent on macromolecular content (26). Hence, the increased macromolecular content in RAS kidneys may have contributed to the increased . The bound pool longitudinal relaxation time was indistinguishable among different kidney zones and animal groups, consistent with previous studies (18,19).
Challenges in Imaging Renal Fibrosis by qMT
One prohibitive obstacle in validating MT-MRI’s for measuring renal fibrosis against histological images is its limited in-plane spatial resolution and sizable tomographic slice thickness, which may incur a partial volume effect. Yet, the spatially dispersed tubulointerstitial fibrosis showed reasonably good spatial continuity in some fibrotic kidneys. As in a previous study using MTI in RAS mice (12), good spatial concordance between kidney regions with high MT parameters values and prominent fibrosis was reported. Yet, remaining inconsistencies between the f map and trichrome-stained tissue section may be largely accounted for by the lower resolution of the former. Other factors, such as preparation of histological slides, might have also deformed the tissue sample. Nevertheless, a strong linear correlation between the measured f values and histological fibrosis was observed in all kidney zones, emphasizing the validity of qMT for measuring renal fibrosis in RAS mice.
Limitations
This study has a relatively small sample size, however the uniformity of sham kidneys and pronounced fibrosis development in RAS facilitated detection of meaningful differences. A wide range of fibrosis among RAS kidneys also afforded comparison between renal fibrosis by histology and the qMT-derived bound pool fraction. Furthermore, only one time point post-surgery was studied, and the ability of qMT to monitor development of renal fibrosis longitudinally remains to be investigated. Moreover, factors other than renal fibrosis, such as inflammatory infiltration, tubular atrophy, and renal hypofiltration, may also contribute to the increased bound pool fraction in fibrotic kidneys, whereas tissue edema and necrosis may offset it. Further studies are needed to investigate their respective roles. Lastly, the contralateral kidney was not sampled in the axial slice selected to image the stenotic kidney and remains to be investigated.
Conclusions
The feasibility of qMT for detecting fibrosis in murine kidneys at 16.4 T was demonstrated. The qMT-derived bound pool fraction significantly elevated in different zones of fibrotic kidneys with RAS, and showed a good correlation with renal fibrosis by histology. Therefore, qMT may provide a valuable tool for measuring renal fibrosis in RAS. Additional studies are needed to establish its feasibility in lower magnet strengths and in human subjects.
Acknowledgments
Grant Support: This study was partly supported by National Institutes of Health Grants DK104273, DK122734, DK120292, and AG062104.
REFERENCES
- 1.Farris AB, Colvin RB. Renal interstitial fibrosis: mechanisms and evaluation. Curr. Opin. Nephrol. Hypertens 2012;21:289–300. [DOI] [PMC free article] [PubMed] [Google Scholar]
- 2.Conway B, Hughes J. Cellular orchestrators of renal fibrosis. QJM 2012;105:611–615. [DOI] [PubMed] [Google Scholar]
- 3.Romagnani P, Remuzzi G, Glassock R, et al. Chronic kidney disease. Nat. Rev. Dis. Prim 2017;3:17088. [DOI] [PubMed] [Google Scholar]
- 4.Hogan JJ, Mocanu M, Berns JS. The Native Kidney Biopsy: Update and Evidence for Best Practice. Clin. J. Am. Soc. Nephrol 2016;11:354–362. [DOI] [PMC free article] [PubMed] [Google Scholar]
- 5.Wolff SD, Balaban RS. Magnetization transfer imaging: practical aspects and clinical applications. Radiology 1994;192:593–599. [DOI] [PubMed] [Google Scholar]
- 6.Henkelman RM, Stanisz GJ, Graham SJ. Magnetization transfer in MRI: a review. NMR Biomed. 2001;14:57–64. [DOI] [PubMed] [Google Scholar]
- 7.Jiang K, Ferguson CM, Woollard JR, et al. Magnetization Transfer Imaging Is Unaffected by Decreases in Renal Perfusion in Swine. Invest. Radiol 2019;54:681–688. [DOI] [PMC free article] [PubMed] [Google Scholar]
- 8.Garcia M, Gloor M, Bieri O, et al. Imaging of Primary Brain Tumors and Metastases with Fast Quantitative 3-Dimensional Magnetization Transfer. J. Neuroimaging 2015;25:1007–1014. [DOI] [PubMed] [Google Scholar]
- 9.Wang F, Li K, Mishra A, Gochberg D, Min Chen L, Gore JC. Longitudinal assessment of spinal cord injuries in nonhuman primates with quantitative magnetization transfer. Magn. Reson. Med 2016;75:1685–1696. [DOI] [PMC free article] [PubMed] [Google Scholar]
- 10.Martens MH, Lambregts DMJ, Papanikolaou N, et al. Magnetization Transfer Ratio: A Potential Biomarker for the Assessment of Postradiation Fibrosis in Patients With Rectal Cancer. Invest. Radiol 2014;49:29–34. [DOI] [PubMed] [Google Scholar]
- 11.Ebrahimi B, Macura SI, Knudsen BE, Grande JP, Lerman LO. Fibrosis detection in renal artery stenosis mouse model using magnetization transfer MRI. In: Weaver JB, Molthen RC, editors. Proc. SPIE 8672, Medical Imaging 2013: Biomedical Applications in Molecular, Structural, and Functional Imaging. 2013;p. 867205. [Google Scholar]
- 12.Jiang K, Ferguson CM, Ebrahimi B, et al. Noninvasive Assessment of Renal Fibrosis with Magnetization Transfer MR Imaging: Validation and Evaluation in Murine Renal Artery Stenosis. Radiology 2017;283:77–86. [DOI] [PMC free article] [PubMed] [Google Scholar]
- 13.Kline TL, Irazabal MV., Ebrahimi B, et al. Utilizing magnetization transfer imaging to investigate tissue remodeling in a murine model of autosomal dominant polycystic kidney disease. Magn. Reson. Med 2016;75:1466–1473. [DOI] [PMC free article] [PubMed] [Google Scholar]
- 14.Jiang K, Ferguson CM, Woollard JR, Zhu X, Lerman LO. Magnetization Transfer Magnetic Resonance Imaging Noninvasively Detects Renal Fibrosis in Swine Atherosclerotic Renal Artery Stenosis at 3.0 T. Invest. Radiol 2017;52:686–692. [DOI] [PMC free article] [PubMed] [Google Scholar]
- 15.Sinclair CDJ, Samson RS, Thomas DL, et al. Quantitative magnetization transfer in in vivo healthy human skeletal muscle at 3 T. Magn. Reson. Med 2010;64:1739–1748. [DOI] [PMC free article] [PubMed] [Google Scholar]
- 16.Henkelman RM, Huang X, Xiang Q-S, Stanisz GJ, Swanson SD, Bronskill MJ. Quantitative interpretation of magnetization transfer. Magn. Reson. Med 1993;29:759–766. [DOI] [PubMed] [Google Scholar]
- 17.Ramani A, Dalton C, Miller DH, Tofts PS, Barker GJ. Precise estimate of fundamental in-vivo MT parameters in human brain in clinically feasible times. Magn. Reson. Imaging 2002;20:721–731. [DOI] [PubMed] [Google Scholar]
- 18.Wang F, Katagiri D, Li K, et al. Assessment of renal fibrosis in murine diabetic nephropathy using quantitative magnetization transfer MRI. Magn. Reson. Med 2018;80:2655–2669. [DOI] [PMC free article] [PubMed] [Google Scholar]
- 19.Wang F, Wang S, Zhang Y, et al. Noninvasive quantitative magnetization transfer MRI reveals tubulointerstitial fibrosis in murine kidney. NMR Biomed. 2019;32:e4128. [DOI] [PMC free article] [PubMed] [Google Scholar]
- 20.Jiang K, Tang H, Mishra PK, Macura SI, Lerman LO. Measurement of Murine Single-Kidney Glomerular Filtration Rate Using Dynamic Contrast-Enhanced MRI. Magn. Reson. Med 2018;79:2935–2943. [DOI] [PMC free article] [PubMed] [Google Scholar]
- 21.Jiang K, Tang H, Mishra PK, Macura SI, Lerman LO. Measurement of murine kidney functional biomarkers using DCE-MRI: A multi-slice TRICKS technique and semi-automated image processing algorithm. Magn. Reson. Imaging 2019;63:226–234. [DOI] [PMC free article] [PubMed] [Google Scholar]
- 22.Jiang K, Tang H, Mishra PK, Macura SI, Lerman LO. A rapid T1 mapping method for assessment of murine kidney viability using dynamic manganese-enhanced magnetic resonance imaging. Magn. Reson. Med 2018;80:190–199. [DOI] [PMC free article] [PubMed] [Google Scholar]
- 23.Jiang K, Ferguson CM, Abumoawad A, Saad A, Textor SC, Lerman LO. A modified two-compartment model for measurement of renal function using dynamic contrast-enhanced computed tomography Joles JA, editor. PLoS One 2019;14:e0219605. [DOI] [PMC free article] [PubMed] [Google Scholar]
- 24.Skinner TE, Glover GH. An extended two-point dixon algorithm for calculating separate water, fat, andB0 images. Magn. Reson. Med 1997;37:628–630. [DOI] [PubMed] [Google Scholar]
- 25.Yarnykh VL. Actual flip-angle imaging in the pulsed steady state: A method for rapid three-dimensional mapping of the transmitted radiofrequency field. Magn. Reson. Med 2007;57:192–200. [DOI] [PubMed] [Google Scholar]
- 26.Sled JG, Pike GB. Quantitative interpretation of magnetization transfer in spoiled gradient echo MRI sequences. J. Magn. Reson 2000;145:24–36. [DOI] [PubMed] [Google Scholar]
- 27.Li W, Liu W, Zhong J, Yu X. Early manifestation of alteration in cardiac function in dystrophin deficient mdx mouse using 3D CMR tagging. J. Cardiovasc. Magn. Reson 2009;11:40. [DOI] [PMC free article] [PubMed] [Google Scholar]
- 28.Liu Y Renal fibrosis: New insights into the pathogenesis and therapeutics. Kidney Int. 2006;69:213–217. [DOI] [PubMed] [Google Scholar]
- 29.Wynn T Cellular and molecular mechanisms of fibrosis. J. Pathol 2008;214:199–210. [DOI] [PMC free article] [PubMed] [Google Scholar]
- 30.Liu Y Cellular and molecular mechanisms of renal fibrosis. Nat. Rev. Nephrol 2011;7:684–696. [DOI] [PMC free article] [PubMed] [Google Scholar]
- 31.Jiang K, Ferguson CM, Lerman LO. Noninvasive assessment of renal fibrosis by magnetic resonance imaging and ultrasound techniques. Transl. Res 2019;209:105–120. [DOI] [PMC free article] [PubMed] [Google Scholar]
- 32.Woo S, Cho JY, Kim SY, Kim SH. Intravoxel incoherent motion MRI-derived parameters and T2* relaxation time for noninvasive assessment of renal fibrosis: An experimental study in a rabbit model of unilateral ureter obstruction. Magn. Reson. Imaging 2018;51:104–112. [DOI] [PubMed] [Google Scholar]
- 33.Jiang K, Ponzo TA, Tang H, Mishra PK, Macura SI, Lerman LO. Multiparametric MRI detects longitudinal evolution of folic acid-induced nephropathy in mice. Am. J. Physiol. Physiol 2018;315:F1252–F1260. [DOI] [PMC free article] [PubMed] [Google Scholar]
- 34.Zha T, Ren X, Xing Z, et al. Evaluating Renal Fibrosis with R2* Histogram Analysis of the Whole Cortex in a Unilateral Ureteral Obstruction Model. Acad. Radiol 2019;26:e202–e207. [DOI] [PubMed] [Google Scholar]
- 35.Ebrahimi B, Rihal N, Woollard JR, Krier JD, Eirin A, Lerman LO. Assessment of Renal Artery Stenosis Using Intravoxel Incoherent Motion Diffusion-Weighted Magnetic Resonance Imaging Analysis. Invest. Radiol 2014;49:640–646. [DOI] [PMC free article] [PubMed] [Google Scholar]
- 36.Ebrahimi B, Textor SC, Lerman LO. Renal Relevant Radiology: Renal Functional Magnetic Resonance Imaging. Clin. J. Am. Soc. Nephrol 2014;9:395–405. [DOI] [PMC free article] [PubMed] [Google Scholar]
- 37.Warner L, Yin M, Glaser KJ, et al. Noninvasive In Vivo Assessment of Renal Tissue Elasticity During Graded Renal Ischemia Using MR Elastography. Invest. Radiol 2011;46:509–514. [DOI] [PMC free article] [PubMed] [Google Scholar]
- 38.Korsmo MJ, Ebrahimi B, Eirin A, et al. Magnetic Resonance Elastography Noninvasively Detects In Vivo Renal Medullary Fibrosis Secondary to Swine Renal Artery Stenosis. Invest. Radiol 2013;48:61–68. [DOI] [PMC free article] [PubMed] [Google Scholar]
- 39.Zhang JL, Morrell G, Rusinek H, et al. New magnetic resonance imaging methods in nephrology. Kidney Int. 2014;85:768–778. [DOI] [PMC free article] [PubMed] [Google Scholar]
- 40.Ebrahimi B, Saad A, Jiang K, et al. Renal Adiposity Confounds Quantitative Assessment of Markers of Renal Diffusion With MRI. Invest. Radiol 2017;52:672–679. [DOI] [PMC free article] [PubMed] [Google Scholar]
- 41.Eisenberger U, Binser T, Thoeny HC, Boesch C, Frey FJ, Vermathen P. Living Renal Allograft Transplantation: Diffusion-weighted MR Imaging in Longitudinal Follow-up of the Donated and the Remaining Kidney. Radiology 2014;270:800–808. [DOI] [PubMed] [Google Scholar]