

Abstract
BACKGROUND AND PURPOSE:
Alström syndrome is a rare inherited ciliopathy in which early progressive cone-rod dystrophy leads to childhood blindness. We investigated functional and structural changes of the optic pathway in Alström syndrome by using MR imaging to provide insight into the underlying pathogenic mechanisms.
MATERIALS AND METHODS:
Eleven patients with genetically proved Alström syndrome (mean age, 23 years; range, 6–45 years; 5 females) and 19 age- and sex-matched controls underwent brain MR imaging. The study protocol included conventional sequences, resting-state functional MR imaging, and diffusion tensor imaging.
RESULTS:
In patients with Alström syndrome, the evaluation of the occipital regions showed the following: 1) diffuse white matter volume decrease while gray matter volume decrease spared the occipital poles (voxel-based morphometry), 2) diffuse fractional anisotropy decrease and radial diffusivity increase while mean and axial diffusivities were normal (tract-based spatial statistics), and 3) reduced connectivity in the medial visual network strikingly sparing the occipital poles (independent component analysis). After we placed seeds in both occipital poles, the seed-based analysis revealed significantly increased connectivity in patients with Alström syndrome toward the left frontal operculum, inferior and middle frontal gyri, and the medial portion of both thalami (left seed) and toward the anterior portion of the left insula (right and left seeds).
CONCLUSIONS:
The protean occipital brain changes in patients with Alström syndrome likely reflect the coexistence of diffuse primary myelin derangement, anterograde trans-synaptic degeneration, and complex cortical reorganization affecting the anterior and posterior visual cortex to different degrees.
Alström syndrome (AS) is a rare (<1:100,000) autosomal recessive monogenic ciliopathy with severe multisystem involvement. Besides childhood truncal obesity, type 2 diabetes, hypertriglyceridemia, cardiomyopathy, and progressive pulmonary, hepatic, and renal dysfunction, patients with AS have cone-rod dystrophy presenting early in infancy and leading to complete blindness in the second decade. Unlike other ciliopathies (eg, Bardet-Biedl syndrome), patients with AS do not present with cognitive impairment.1 However, a recent MR imaging study2 showed that most patients with AS older than 30 years have brain atrophy, periventricular white matter abnormalities, or lacune-like lesions. Additionally, voxel-based morphometry revealed white and gray matter volume decreases more evident in the posterior regions, while diffusion tensor imaging showed diffuse supratentorial myelin abnormalities also involving regions that appeared normal at conventional imaging. The pathogenesis of these changes is not clear and might be due to genetically determined primary myelin derangement, progressive neurodegenerative processes, early profound sensorineural deprivation, or a combination of all these mechanisms. The impact of these changes on brain function has not yet been investigated. Studies on early blindness in subjects without Alström syndrome have shown that the (visual) occipital cortex remodulates its function and undergoes structural changes likely related to abnormal selective pruning of exuberant connections and/or sensory deprivation–dependent effects on normal cortex maturation.3 Recently, resting-state fMRI has proved to be a powerful tool for investigating functional connectivity, even in situations in which the task execution is difficult (eg, visual tasks in blind subjects). Resting-state fMRI might provide functional data complementary to the information obtained from the structural MR imaging–based analyses developed for the evaluation of white matter integrity (tract-based spatial statistics) and cortical development (sulcation, curvature, cortical thickness analyses).
This multimodality MR imaging study on a cohort of patients with AS aims to provide an integrated account of functional and structural changes of the regions devoted to the visual function in this rare disease and new insights into the pathogenic mechanisms leading to brain changes in early blindness.
Materials and Methods
Participants
Eleven patients (mean age, 23 years; range, 6–45 years; 5 females) with Alström syndrome were recruited from our Department of Internal Medicine. All patients met the diagnostic criteria for AS based on genetic analysis and clinical observations1 and had a normal intelligence quotient.
Nineteen age- and sex-matched unrelated healthy subjects or patients referred to neuroimaging for headache with no history of prematurity, head trauma, neurologic or psychiatric disease, and neurosurgery represented our control group (mean age, 23 years; range, 6–43; 10 females).
Two patients with AS and 1 control were left-handed according to the Edinburgh Handedness Inventory.4 The exclusion criteria were the presence of contraindications to MR imaging and age younger than 6 years to avoid sedation. Our University Hospital Ethics Committee approved the study. Written informed consent was obtained from patients or their parents.
All subjects underwent a complete physical and neurologic examination including neurosensory analysis (retinopathy and hearing loss) and were investigated for cardiovascular risk factors (obesity, diabetes mellitus type 2, cardiomyopathy, and hyperlipidemia). Clinical findings are summarized in the Table.
Epidemiologic, genetic, and clinical findings of patients with AS in the present study
| No. | Genotype (Axon) | Vision Deficita | Hearing Deficitb | Overweightc | Hypertensiond | Heart Ejection Fractione | Dyslipidemia | DM2f | Psychiatric Disorders |
|---|---|---|---|---|---|---|---|---|---|
| 1 | Heterozygosis 8 and 16 | + | − | ++ | − | Normal | − | + | − |
| 2 | Heterozygosis 8 and 16 | + | + | ++ | − | Normal | − | + | − |
| 3 | Heterozygosis 8 and un | + | + | + | − | Normal | − | + | − |
| 4 | Heterozygosis 8 and 10 | + | + | + | − | Normal | − | + | − |
| 5 | Heterozygosis 8 and un | ++ | + | + | + | Normal | + | ++ | − |
| 6 | Heterozygosis 10 and 12 | + | + | − | − | Normal | − | + | − |
| 7 | Heterozygosis 8 and 16 | + | + | + | + | 25%g | + | ++ | − |
| 8 | Heterozygosis 8 and 8 | ++ | + | ++ | + | 47% | − | ++ | Depression |
| 9 | Heterozygosis 8 and 8 | ++ | + | + | − | Normal | + | + | Depression |
| 10 | Homozygosis 10 and 10 | ++ | + | + | + | Normal | + | − | Anxiety, depression, bulimiah |
| 11 | Homozygosis 16 and un | ++ | + | + | + | Normal | + | − | Paranoid personality disorderi |
| 12 | Homozygosis 10 | ++ | + | − | + | Normal | + | ++ | − |
Note:—un indicates unknown mutation; DM2, diabetes mellitus type 2.
Vision Deficit: + indicates severe vision deficit (<1/20); ++, blindness.
Hearing Deficit: − indicates normal hearing; +, hearing deficit >20 dB.
Overweight: − indicates normal weight (body mass index, 18.5–25); +, overweight (body mass index, 25–30); ++, obesity (body mass index, >30).
Hypertension: − indicates normotensive; +, under antihypertensive treatment.
Heart Ejection Fraction: normal value, >55%.
DM2: ++ indicates diabetes mellitus type 2; +, insulin resistance or hyperinsulinemia or impaired glucose tolerance; –, no disorders in glucidic metabolism.
Dilated cardiomyopathy.
Under therapy with valproic acid, bromazepam, and olanzapine.
Under therapy with valproic acid, quetiapine, risperidone, and paroxetine.
MR Imaging Acquisition
MR images were obtained at 1.5T (Achieva; Philips Medical Systems, Best, the Netherlands) with a standard quadrature head coil.
The MR imaging study protocol included the following:
-
1)
3D T1-weighted imaging (TR/TE, 20/3.8 ms; flip angle, 20°; section thickness, 1 mm; acquired voxel size, 1 × 1 mm; reconstructed voxel size, 0.66 × 0.66 mm; acquisition matrix, 212 × 210; reconstructed matrix, 320 × 320; acquisition time, approximately 7 minutes);
-
2)
Fluid-attenuated inversion-recovery (TR/TE/TI, 10,000/140/2800 ms; echo-train length, 53; flip-angle, 90°; section thickness, 5 mm; acquisition voxel, 0.90 × 1.15 mm; reconstructed voxel, 0.9 × 0.9 mm; acquisition time, 3 minutes 20 seconds);
-
3)
Diffusion tensor images acquired with single-shot echo-planar diffusion-weighted imaging (TR/TE, 11,114/80 ms; acquisition matrix, 112 × 110; echo-train length, 59; reconstructed matrix, 128 × 128; acquisition voxel, 2 × 2 mm; reconstructed voxel, 1.75 × 1.75 × 2 mm; sensitivity encoding p reduction, 2; section-thickness, 2 mm without gap; NEX, 2; acquisition time, 12 minutes 24 seconds). The axial sections covered the whole brain including the cerebellum. The diffusion-sensitizing gradients were applied along 32 noncollinear gradient-encoding directions with maximum b=800 s/mm2. One additional image without diffusion gradients (b=0 s/mm2) was also acquired.
-
4)
Resting-state fMRI data with 250 continuous functional volumes (TR/TE, 2216/50 ms; flip angle, 90°; 21 axial sections; acquisition matrix, 96 × 96; reconstructed matrix, 128 × 128; acquisition voxel, 2.4 × 2.4 mm; reconstructed voxel, 1.8 × 1.8 mm; section thickness, 5.5 mm; gap between sections, 0.5 mm; acquisition time; 8 minutes 27 seconds). For the core dataset, subjects were instructed to remain still, stay awake, and keep their eyes open.
Image Processing
Data Processing of Volumetric Images.
We used the optimized voxel-based morphometry protocol available in the statistical parametric mapping software (SPM8, www.fil.ion.ucl.ac.uk/spm/software/spm8).5 The protocol consisted of the following: A study-specific gray and white matter template was built from the 30 segmented native images affine-registered to the International Consortium for Brain Mapping-152 gray matter template. The native segmented images were then nonlinearly normalized onto this template, introducing a “modulation” for distortions due to the nonlinear component of the transformation by dividing each voxel of each registered gray matter volume image by the Jacobian of the warp field. The modulated normalized gray matter volume images were then smoothed with an isotropic Gaussian kernel with a σ of 3 mm.
For statistical analyses, we used a parametric t test as implemented by SPM8, by using age as a covariate of no interest. Results for gray matter were considered significant for P < .05, after correction for multiple comparisons by using an initial cluster-threshold at P < .001 uncorrected (minimum size = 20 voxels). Region-of-interest analyses for hippocampal regions were performed by using WFU-PickAtlas 3.0.3 (http://fmri.wfubmc.edu/software/PickAtlas), while contrasts were analyzed by using SPM8.6
Data Processing of DTI.
The whole-brain DTI analysis method is reported in a previous publication.2 We used probabilistic maps of the optic pathways in the Juelich histologic atlas (http://neuro.debian.net/pkgs/fsl-juelich-histological-atlas.html), thresholded at 50% to create masks to be applied to the study-specific skeleton restricted to optic radiations. The threshold-free cluster enhancement (TFCE) approach was used to obtain the significant differences between the 2 groups at P ≤ .05, after accounting for multiple comparisons by controlling for the family-wise error rate.
Data Processing of Functional Images.
Resting-state scans were preprocessed by using both Analysis of Functional NeuroImages (version AFNI_2010_10_19_1028; http://afni.nimh.nih.gov/afni) and fMRI of the Brain Software Library (FSL, Version 4.1.6; http://www.fmrib.ox.ac.uk/fsl). Preprocessing was performed as described in Biswal et al7 and Neuroimaging Informatics Tools and Resources Clearinghouse (www.nitrc.org/projects/fcon_1000). The first 5 volumes of every scan were discarded to remove possible stabilization effects. Preprocessing consisted of motion correction by using Fourier interpolation (volume registration by using least-squares alignment of 3 translational and 3 rotational parameters); spatial smoothing by using a 6-mm full width at half maximum Gaussian kernel; mean-based intensity normalization of all volumes; linear and quadratic detrending; and spatial normalization via estimation of a linear transformation from the individual functional space to Montreal Neurological Institute-152 (MNI152) standard brain space according to each individual's high-resolution anatomic image. A high-pass-filter setting of 200 seconds (<0.005 Hz) was used to reduce very low-frequency artifacts such as scanner draft. During scanning acquisition, 2 patients with Alström syndrome and 1 control subject displayed a single brief movement of head displacement of >3 mm or 3°. Given the type of networks in which we were interested, we decided to remove the interested volumes (20–30 volumes) before preprocessing (these subjects were then excluded from independent component analysis, [http://en.pudn.com/downloads226/sourcecode/math/detail1062122_e] but not from dual regression analyses). No major scanner artifacts were detected.
Temporal-concatenation group independent component analysis was used in the whole group of patients and controls to generate group-level components of the dataset by MELODIC (FSL).8 Before statistical inference, the networks of interest (medial, lateral, and ventral visual networks) were identified on visual inspection and by comparison with available maps in the literature.9 The dual-regression approach was used to obtain a connectivity map for each of the 3 components and for each subject. The standardized maps obtained by dual regression were used to perform group comparisons and correlations with age, education, and hand lateralization as nuisance variable covariates of interest.
Nonparametric permutation testing (5000 permutations) was used for statistical analysis of spatial maps, by the TFCE method for multiple comparisons and thresholding at P < .05. To control for the effects of brain atrophy on functional connectivity, we used the segmented anatomic images of all subjects to obtain voxelwise probability maps of gray matter, for use as a nuisance variable in statistical analyses.10,11Additionally, a seed-based analysis was performed. We selected 2 symmetric seeds in the occipital pole (MNI coordinates: MNI 9, −96, 9 and MNI −9, −96, 9). Regions of interest were drawn in the occipital pole (1 on the left and 1 on the right occipital pole) to unveil eventual connections with other regions of the brain.
To perform the seed-based analysis, we removed nuisance signals by multiple regression. Each individual's 4D time-series was regressed on 9 predictors, consisting of white matter, CSF, the global signal, and 6 motion parameters (3 cardinal directions and rotational movement around 3 axes). The time-series of the nuisance signals were extracted by the following methods:
-
•
Averaging all voxels in the brain (global signal) across the time-series
-
•
Segmenting each individual's high-resolution structural image, applying a threshold at 80% tissue type probability, and averaging all voxels within the thresholded mask (white matter and CSF) across each time-series and
-
•
Using the residuals obtained from motion correction by the FMRIB Linear Image Registration Tool (http://www.fmrib.ox.ac.uk/).
Each participant's residual 4D time-series was transformed into Montreal Neurological Institute space by a linear affine transformation implemented in FSL, and the time-series was extracted for each seed. Time-series were averaged across all voxels in the seed region of interest; then, for each participant, the correlations between the time-series of the seed region of interest and of each voxel in the brain were determined. Last, correlation maps were converted to Z-value maps. The resulting standardized maps were then used to perform group comparisons and correlations by using age and hand lateralization as nuisance variables.
Results
Conventional MR Imaging
Conventional MR imaging findings have been reported in a previous study on the same study group.2 In particular, mild enlargement of the atria and the posterior horns of the lateral ventricles was observed in 3 patients bilaterally and in 1 patient on the left side. Images of the 3 patients older than 30 years with AS showed periventricular white matter hyperintensity also involving the optic radiations. None of images of the patients with AS showed signal abnormalities at the level of the lateral geniculate bodies.
Voxel-Based Morphometry of the Occipital Regions
Patients with AS showed significantly lower gray and white matter volume compared with controls in the occipital region (Fig 1A and On-line Fig 1). The analysis revealed the symmetric decrease of gray matter, more evident in the anterior part of the calcarine cortex and the fusiform gyri, with relative sparing of the occipital poles.
Fig 1.
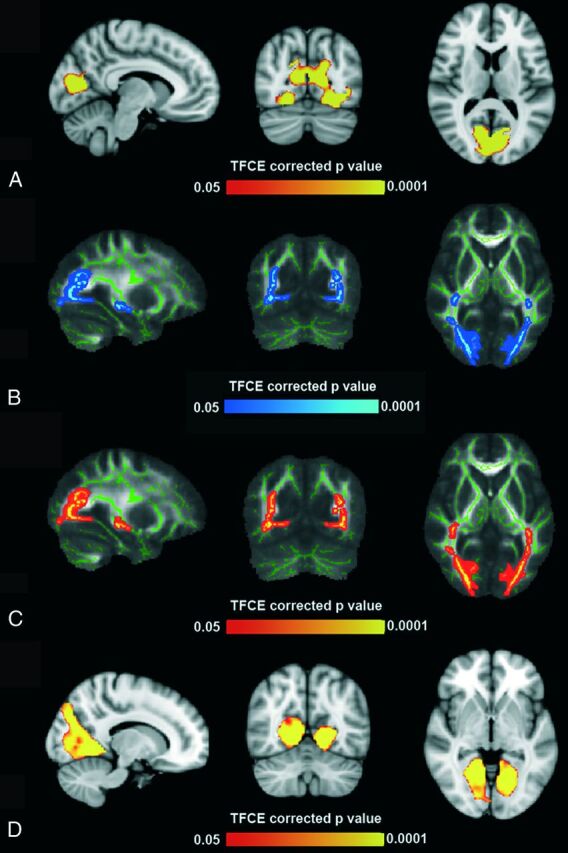
A, Gray matter voxel-based morphometry analysis: areas of significant difference (TFCE-corrected P < .05) between subjects with AS and healthy controls within the occipital pole (5386 voxels; peak, −16, −68, 6). Analysis was conducted with age as a covariate. B and C, Tract-based spatial statistics analysis: areas of significant difference (TFCE-corrected P < .05) between subjects with AS and healthy controls. Analyses were conducted with age as a covariate and showed diffuse decrease of fractional anisotropy (peaks, 33, −65, −2 and 28, −60, −1) and diffuse increase of radial diffusivity (peaks, 31, −65, 11 and −25, −68, 0). D, Resting-state fMRI analysis: areas of significant differences (TFCE-corrected P < .05) between subjects with AS and healthy controls within the medial visual networks (2189 voxels; peak, 21, −51, −3). Analysis was conducted with age as a covariate.
On the other hand, the decrease of white matter involved the optic radiation entirely, including the most posterior portion.
DTI Analysis of the Occipital Regions
Tract-based spatial statistics analysis showed significant reduction of fractional anisotropy and increased radial diffusivity in the optic radiations of patients with AS compared with controls (Fig 1B, -C). Axial diffusivity and mean diffusivity analysis did not reveal any differences between patients with AS and controls.
Resting-State fMRI: The Visual Networks
All the resting-state functional networks were detected in both patients and controls. After including gray matter probability maps as a nuisance variable to control for brain atrophy, among the visual networks (medial, lateral, and ventral), we found reduced connectivity in patients with AS in the medial visual network (2189 voxels; peak, 21; −54, −3) and in the lateral visual network (53 voxels; peak, 33, −87, 18). The large cluster of reduced connectivity in the medial visual network involved the anterior portion of the calcarine region with sparing of the occipital poles (Fig 1D). If we set a seed in each occipital pole (On-line Fig 2A), the seed-based analysis revealed significantly increased connectivity in patients with AS toward a small region in the anterior portion of the left insula (right seed, On-line Fig 2B) and toward large cortical regions of the left anterior insula, frontal operculum, inferior and middle frontal gyri, and with the medial portion of both thalami (left seed, On-line Fig 2C).
Discussion
This multimodality MR imaging study of patients with Alström syndrome disclosed a diffuse occipital ultrastructural white matter derangement and atrophy and an inhomogeneous visual cortex involvement that spared the occipital pole in terms of both atrophy and connectivity. These findings are relatively unexpected in a condition in which the main mechanism of blindness resides in a precocious cone-rod dystrophy,12 which should affect primarily the retinal neurons projecting to the occipital poles. Among the several pathogenic mechanisms that might affect the optic pathway in AS, the following may play a role in determining the observed parenchymal structural and functional changes: 1) anterograde trans-synaptic degeneration following cone-rod dystrophy, 2) primary myelin derangement, 3) neural occipital reorganization due to chronic visual deafferentation.
Anterograde Trans-Synaptic Degeneration
Neural injury might induce axonal degeneration in the direction of its terminal (anterograde degeneration) and toward the cell body (retrograde degeneration). In addition, neural injury might also lead to trans-synaptic degeneration of neurons that are downstream or upstream connected with the injured neuron.13
Trans-synaptic degeneration of the visual pathway has been well-documented in pathologic studies. Cellular death of the lateral geniculate bodies has been observed in patients with lesions occurring from the retina to the optic tract (eg, eye enucleation).14 Trans-synaptic degeneration may also occur in a retrograde fashion because lesions of the optic radiation or calcarine cortex might cause degeneration of retinal ganglion cells.15 Retinal thinning at the optical coherence tomograph16 and optic tract atrophy at MR imaging have been demonstrated following acquired unilateral occipital damage in humans.17 Lesions along the optic pathway can lead to lateral geniculate body T2 hyperintensity,17 and optic radiation abnormalities have been documented in patients affected with glaucoma by DTI.18 In these cases, a decreased fractional anisotropy concomitant to increased radial diffusivity and mean diffusivity was consistent with axonal loss due to retrograde trans-synaptic degeneration of the lateral geniculate bodies. In patients with AS, the lateral geniculate bodies did not present with signal abnormalities on conventional imaging. Furthermore, the pattern of DTI changes observed in the optic radiation of patients with AS was not consistent with axonal loss because the mean diffusivity and the first eigenvalue were not significantly increased.
Primary Myelin Derangement
Previously, whole-brain tract-based spatial statistics analysis showed that patients with AS present with diffuse myelin derangement characterized by decreased fractional anisotropy and increased radial diffusivity.2 The same pattern was detected in the occipital white matter including the optic radiation. This DTI pattern has been reported in other diseases characterized mostly by myelin derangement such as relapsing-remitting multiple sclerosis and in animal models of dysmyelination. Primary myelin issues have already been reported in both the central and peripheral nervous system of patients with AS. The primary cilia of Schwann cells seem to be the regulators of their hedgehog signaling–mediated myelination,19 while genetic studies have shown that sonic hedgehog signaling at the level of primary cilia is essential for patterning the embryonic stem cells into oligodendrocytes. Delamination of the myelin sheaths was detected by transmission electron microscopy at the level of the gingiva in AS.20 Notably, by voxel-based morphometry and functional analyses, only the anterior part of the calcarine cortex presented with significant volume and functional impairment. On the contrary, the occipital poles did not present with significant atrophy, suggesting that the diffuse myelin derangement does not lead to uniform structural and functional cortical changes.
Neural Occipital Reorganization due to Chronic Visual Deafferentation
The most striking finding in this study was the preserved connectivity and gray matter volume of the occipital pole despite its role in the foveal binocular vision, while the remaining calcarine cortex showed both atrophy and impaired connectivity.
Most intriguing, the functional connectivity between the posterior occipital poles and the inferior frontal triangular areas (part of Brodmann Areas 44, 45, 47) was increased in patients with AS compared with controls. The inferior frontal triangular area is classically considered as a motor speech-production area and is involved in action understanding and imitation.21 In blind individuals, the occipital visual and frontal language areas are simultaneously activated when performing a Braille-reading task.22 In patients with AS, the early degeneration of the retinal cones, projecting to the occipital poles, might reduce the visual input before the stage of synaptic revision (which occurs during the first 8 months of postnatal life and is critically dependent on the activity of visual afferent inputs),23 likely redirecting the process of connectivity maturation. The subsequent degeneration of the rods might occur at a stage of decreased cortical plasticity, leading to atrophy and reduction of connectivity. In patients with AS, the timing of retinal degeneration might therefore influence differently the stimuli-driven development of the tuning visual cortex.24
Conclusions
Several pathogenic mechanisms such as anterograde trans-synaptic degeneration, primary myelin derangement, and differential cortical reorganization seem to contribute to the optic pathway derangement in AS. Increased understanding of these mechanisms might help identify targeted therapies aimed at slowing or reversing the neurodegenerative phenomena that are part of Alström syndrome.
Supplementary Material
ABBREVIATIONS:
- AS
Alström syndrome
- MNI
Montreal Neurological Institute
- TFCE
threshold-free cluster enhancement
Footnotes
Disclosures: Renzo Manara—UNRELATED: Payment for Lectures (including service on Speakers Bureaus): BioMarin, Comments: symposium on mucopolysaccharidosis type 6 at a congress. Jan D. Marshall—RELATED: Grant: National Institutes of Health 036878,* Comments: supports all work on Alström Syndrome. Jürgen K. Naggert—RELATED: Grant: National Institutes of Health*; Consulting Fee or Honorarium: National Institutes of Health (grant review); Support for Travel to Meetings for the Study or Other Purposes: National Institutes of Health (grant review); UNRELATED: Grants/Grants Pending: National Institutes of Health,* Comments: DK085441. *Money paid to the institution.
This research was supported by National Institutes of Health research grant 036878.
References
- 1. Marshall JD, Beck S, Maffei P, et al. Alström syndrome. Eur J Hum Genet 2007;15:1193–202 [DOI] [PubMed] [Google Scholar]
- 2. Citton V, Favaro A, Bettini V, et al. Brain involvement in Alström syndrome. Orphanet J Rare Dis 2013;8:24. [DOI] [PMC free article] [PubMed] [Google Scholar]
- 3. Anurova I, Renier LA, De Volder AG, et al. Relationship between cortical thickness and functional activation in the early blind. Cereb Cortex 2014. February 10. [Epub ahead of print] [DOI] [PMC free article] [PubMed] [Google Scholar]
- 4. Oldfield RC. The assessment and analysis of handedness: the Edinburgh inventory. Neuropsychologia 1971;9:97–113 [DOI] [PubMed] [Google Scholar]
- 5. Ashburner J, Friston KJ. Voxel-based morphometry: the methods. Neuroimage 2000;11:805–21 [DOI] [PubMed] [Google Scholar]
- 6. Maldjian JA, Laurienti PJ, Kraft RA, et al. An automated method for neuroanatomic and cytoarchitectonic atlas-based interrogation of FMRI data sets. Neuroimage 2003;19:1233–39 [DOI] [PubMed] [Google Scholar]
- 7. Biswal BB, Mennes M, Zuo XN, et al. Toward discovery science of human brain function. Proc Natl Acad Sci U S A 2010;107:4734–39 [DOI] [PMC free article] [PubMed] [Google Scholar]
- 8. Zuo XN, Kelly C, Adelstein JS, et al. Reliable intrinsic connectivity networks: test-retest evaluation using ICA and dual regression approach. Neuroimage 2010;49:2163–77 [DOI] [PMC free article] [PubMed] [Google Scholar]
- 9. Oakes TR, Fox AS, Johnstone T, et al. Integrating VBM into the general linear model with voxelwise anatomical covariates. Neuroimage 2007;34:500–08 [DOI] [PMC free article] [PubMed] [Google Scholar]
- 10. Smith SM, Nichols TE. Threshold-free cluster enhancement: addressing problems of smoothing, threshold dependence and localisation in cluster inference. Neuroimage 2009;44:83–98 [DOI] [PubMed] [Google Scholar]
- 11. Filippini N, Nickerson LD, Beckmann CF, et al. Age-related adaptations of brain function during a memory task are also present at rest. Neuroimage 2012;59:3821–28 [DOI] [PMC free article] [PubMed] [Google Scholar]
- 12. Marshall JD, Maffei P, Collin GB, et al. Alstrom syndrome: genetics and clinical overview. Cur Genomics 2011;12:225–35 [DOI] [PMC free article] [PubMed] [Google Scholar]
- 13. Saxena S, Caroni P. Mechanisms of axon degeneration: from development to disease. Prog Neurobiol 2007;83:174–91 [DOI] [PubMed] [Google Scholar]
- 14. Beatty RM, Sadun AA, Smith L, et al. Direct demonstration of trans-synaptic degeneration in the human visual system: a comparison of retrograde and anterograde changes. J Neurol Neurosurg Psychiatry 1982;45:143–46 [DOI] [PMC free article] [PubMed] [Google Scholar]
- 15. Bridge H, Jindahra P, Barbur J, et al. Imaging reveals optic tract degeneration in hemianopia. Invest Ophthalmol Vis Sci 2011;52:382–88 [DOI] [PubMed] [Google Scholar]
- 16. Cowey A, Alexander I, Stoerig P. Transneuronal retrograde degeneration of retinal ganglion cells and optic tract in hemianopic monkeys and humans. Brain 2011;134:2149–57 [DOI] [PubMed] [Google Scholar]
- 17. Uggetti C, Egitto MG, Fazzi E, et al. Trans-synaptic degeneration of lateral geniculate bodies in blind children: in vivo MR demonstration. AJNR Am J Neuroradiol 1997;18:233–38 [PMC free article] [PubMed] [Google Scholar]
- 18. Song SK, Sun SW, Ramsbottom MJ, et al. Dysmyelination revealed through MRI as increased radial (but unchanged axial) diffusion of water. Neuroimage 2002;17:1429–36 [DOI] [PubMed] [Google Scholar]
- 19. Ruat M, Roudaut H, Ferent J, et al. Hedgehog trafficking, cilia and brain functions. Differentiation 2012;83:S97–104 [DOI] [PubMed] [Google Scholar]
- 20. Yoshimura K, Takeda S. Hedgehog signaling regulates myelination in the peripheral nervous system through primary cilia. Differentiation 2012;83:S78–85 [DOI] [PubMed] [Google Scholar]
- 21. Nishitani N, Schürmann M, Amunts K, et al. Broca's region: from action to language. Physiology (Bethesda) 2005;20:60–69 [DOI] [PubMed] [Google Scholar]
- 22. Burton H, Snyder AZ, Conturo TE, et al. Adaptive changes in early and late blind: a fMRI study of Braille reading. J Neurophysiol 2002;87:589–607 [DOI] [PMC free article] [PubMed] [Google Scholar]
- 23. Bienenstock EL, Cooper LN, Munro PW. Theory for the development of neuron selectivity: orientation specificity and binocular interaction in visual cortex. J Neurosci 1982;2:32–48 [DOI] [PMC free article] [PubMed] [Google Scholar]
- 24. Lewis TL, Maurer D. Multiple sensitive periods in human visual development: evidence from visually deprived children. Dev Psychobiol 2005:46:163–83 [DOI] [PubMed] [Google Scholar]
Associated Data
This section collects any data citations, data availability statements, or supplementary materials included in this article.