Abstract
BACKGROUND AND PURPOSE:
CSF fluid dynamics in healthy subjects and patients with Chiari I have been characterized during rest with phase-contrast MR imaging and CFD. CSF flow velocities and pressures in the nonresting state have not been adequately characterized. We used computer simulations to study CSF dynamics during increased heart rates in the normal and Chiari I subarachnoid space.
MATERIALS AND METHODS:
Cyclic CSF flow was simulated for multiple cycles in idealized 3D models of the subarachnoid space for normal and Chiari I malformation subarachnoid spaces, with flow cycles corresponding to 80 or 120 heart beats per minute. Flow velocities and pressures were computed by the Navier-Stokes equations. Synchronous bidirectional flow and flow patterns were displayed in Star-CD and inspected visually. Peak velocities and pressure differences in the 2 models were compared for the 2-cycle frequencies.
RESULTS:
Elevating the cycle rate from 80 to 120 cpm increased peak superior-inferior pressure gradients (top-bottom) by just 0.01% in the normal model and 2% in the Chiari model. Corresponding average pressure gradients increased by 92% and 100%, respectively. In addition, in both models, the range of synchronous bidirectional flow velocities increased. Systolic velocities had smaller increases with faster cycling. For each cycle rate, peak and average pressure gradients in the Chiari model were greater than in the normal model by 11%–16%.
CONCLUSIONS:
Raising the cycle rate from 80 to 120 cpm increased superior-inferior average pressure gradients and the range of synchronous bidirectional flow velocities in the normal and Chiari I models.
Studies with PCMR and CFD have characterized CSF flow in resting human volunteers and patients with Chiari I. CSF has an oscillatory motion in the foramen magnum, moving caudally during systole and cranially during diastole. The expansion and contraction of blood vessels in the brain with each heart beat drive the CSF flow. For given boundary conditions, the shape of the subarachnoid space determines the distribution of flow velocities and pressures. Simulation studies1 have effectively demonstrated differences in CSF flow between patients with Chiari and healthy volunteers due to specific anatomic features, such as tonsillar herniation.
CSF flow in patients during exertion has not been well characterized because PCMR is not well-suited to studying individuals who are not at rest. Changes in CSF flow secondary to exertion may have clinical relevance because patients with the Chiari I malformation may experience exertional headaches, which hypothetically result from changes in CSF flow. Increased CSF velocities and pressures during exertion may have a role in the pathogenesis of syringomyelia.2,3
Computer simulations circumvent the practical challenges faced with standard measurement devices, thereby facilitating studies of CSF flow during exertion. In this study, we used computer simulations to investigate the effect of increased heart rate on CSF flow in patients with Chiari and controls.
Materials and Methods
Models of 3D Flow Channel Geometries
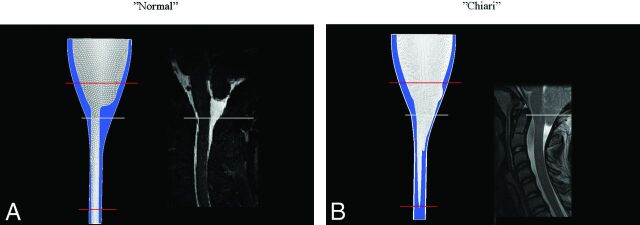
Normal and Chiari 3D models (Fig 1), designed and validated previously,1,4 were used for the simulations in this study. The normal model had dimensions and tapering typical of a normal adult human subarachnoid space. The Chiari model represented a severe malformation and had inverted cones inserted at the craniovertebral junction of the normal model to simulate ectopic tonsils. For the normal flow-channel computations, a tetrahedral mesh with 60,000 nodes was used, having a smallest distance between nodes in each cell from 0.1 to 5.0 mm. The obstructed flow channel in the Chiari model naturally gives more heterogeneous flow, motivating the use of >10 times as many nodes. In this case, a hexahedral mesh was used, with the smallest distance between nodes in any cell ranging from 0.15 to 1.25 mm. Spinal cord, tonsils, and outer boundaries of the subarachnoid space were assumed to be rigid and immobile. Because inflow/outflow boundary conditions are unknown, models were extended superiorly and inferiorly. This change allowed simpler plug-shaped velocity profiles to be specified at model inflow/outflow boundaries because more natural flow conditions will develop before flow enters the relevant region (between the red lines in Fig 1).
Fig 1.
The idealized model of a normal subarachnoid space (A) and a patient with a Chiari I malformation (B). Each model is shown with a comparable sagittal MR image. For the normal model, the sagittal plane is in the midline. For the tonsillar herniation case, it is paramedian and through the nearest tonsil (to show the extent of tonsillar herniation). Blue is used for the CSF in the model. The white reference line indicates comparable levels in the models and MR images, while red lines show the level of model extension cranially and caudally. Anterior is to the reader's left, and posterior is to the right.
Modeling Cyclic CSF Flow
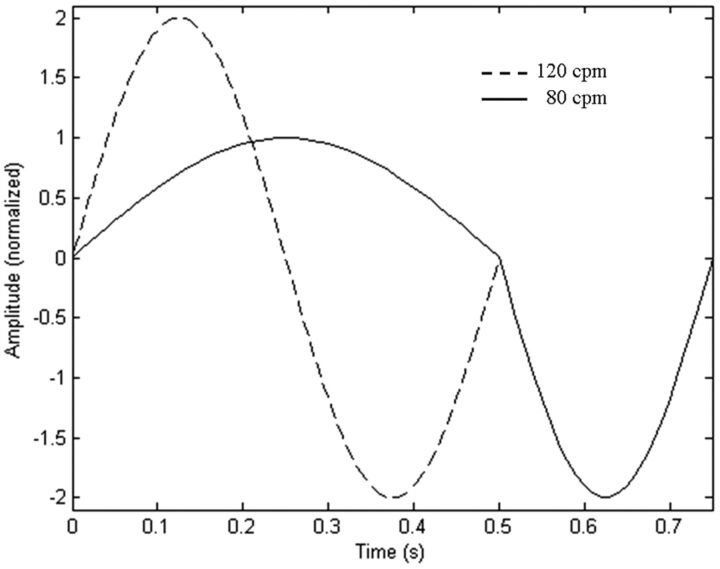
Boundary conditions were chosen for the models to simulate CSF flow at 80–120 bpm. The fluid was assumed to have the properties of water at 37°, with a kinematic viscosity of 0.700 × 10⁻⁶ m2/s. Flow was assumed laminar.5 For flow at 80 cycles per minute, an asymmetric waveform of flow was assumed with the diastole lasting twice as long as the systole.6 We modeled the change in heart rate as shortening diastole and doubling peak diastolic velocities (Fig 2), to achieve a cycle rate of 120 cpm.6 Velocities were scaled so that approximately 1 mL of fluid passed the foramen magnum during diastole/systole.7 No-slip boundary conditions were used at the spinal cord and dura boundaries.
Fig 2.
CSF flow at the inflow/outflow boundaries for the 2 models at 120 cpm. A positive sign is used for cephalad flow (diastole), and a negative sign is used for caudad flow (systole).
Simulations were started with the fluid at rest. To compensate for this unphysiologic starting condition, CSF flow cycles were simulated until computed properties from 2 consecutive cycles were similar (ie, maximum velocities at the foramen magnum differed by <1 mm/s and distributions were similar by visual inspection). Flow and pressure were calculated for each computational point at 0.001-second intervals. A fixed reference pressure of 20 cm H2O was chosen at the cranial end of the model. All simulations were run in Star-CD (CD-Adapco, Melville, New York). Spatial and temporal resolutions used with the present computational meshes were previously verified by Linge et al.1,4
Assessment of CSF Flow Characteristics
Spatial and temporal patterns of fluid velocities throughout the cycle were displayed in Star-CD. Pressure differences between the top and the bottom of the model were computed and plotted for each 0.01 second of the cycle. This gave a total of 75 or 50 pressure differences in total for the lower and higher cycling rates, respectively (which, divided by length, gives gradients). Using absolute values, we computed and compared maximum and average pressure differences.
Results
Stable flow cycles were achieved by the fourth (2000 iterations with 120 cpm) and seventh (3500 iterations with 120 cpm) cycles for the normal and Chiari models, respectively. With the 80-cpm cycling rate, stability was achieved somewhat earlier.
Velocity Changes with Increased Cycle (Heart) Rate
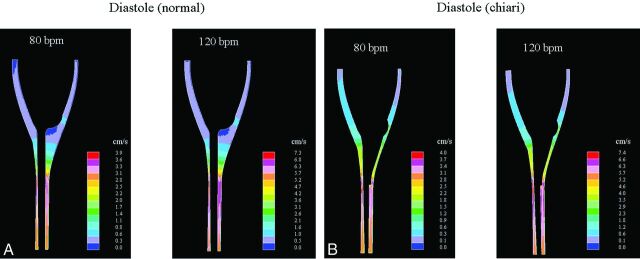
For both the normal and the Chiari models, velocities changed smoothly and regularly over the cycle at both cycle rates. In both models, synchronous bidirectional flow was found during those phases of the cycle when flow direction at the boundaries reversed. Stagnant flow was found in parts of the cisterna magna for both heart rates, and peak velocities occurred in the narrower parts of the flow channel below the craniovertebral junction, notably below levels reached by the herniated tonsils. The distribution of diastolic velocities throughout the subarachnoid space did not change as the cycle rate was increased from 80 to 120 cpm (Fig 3), but inner-model velocities nearly doubled in response to the doubling of peak diastolic velocities set at the boundaries. Systolic peak velocities did not change as the heart rate increased (Fig 4), but velocity distributions were affected in the normal model in particular, as witnessed, for example, by an increased tendency of jet pattern formations (Fig 4). A similar tendency was not observed for the diastolic phase, even if peak velocities were as high as those during the systolic phase. Synchronous bidirectional flow velocities along the cord increased markedly as the heart rate increased, in particular as flow changed direction from cranial to caudal (Fig 5). The velocity range then increased by 112% and 80% for the normal and Chiari models, respectively.
Fig 3.
CSF flow velocity in a midsagittal plane in the normal and the Chiari models at the time of peak diastolic flow (positive direction). Flow cycling at 80 cpm is shown to the left, and 120 cpm, to the right. Maximal velocities occur below the tonsils in the Chiari model and in a similar location in the normal model.
Fig 4.
CSF flow velocity in an axial plane at the level corresponding to the craniovertebral junction at the time of peak systolic flow (negative direction). Flow cycling at 80 cpm is shown to the left and 120 cpm to the right. Flow patterns differ at the 2 cycle rates. The faster cycling rate does not change the peak systolic velocities in either model. Anterior and posterior are to the reader's left and right, respectively.
Fig 5.
Synchronous bidirectional flow at the craniovertebral junction when flow direction changes from cranial to caudal. At the higher cycling rates, greater synchronous bidirectional flow velocities are seen.
Reverse flow was located in a narrow band near the boundary walls of the subarachnoid space, with 5- to 7-times higher velocities in the normal model. This effect was much reduced in the Chiari model. This increase was also accompanied by a change in velocity distribution (Fig 5, top). Only such insignificant changes were observed as flow changed direction from caudal to cranial (not shown). The ratios of anteroposterior and left-right velocity components to the superior-inferior velocity component changed negligibly and were small, as reported previously by Linge et al,1 and flow distributions of these components were not affected by an elevated heart rate.
Pressure Changes with Increased Cycle (Heart) Rate
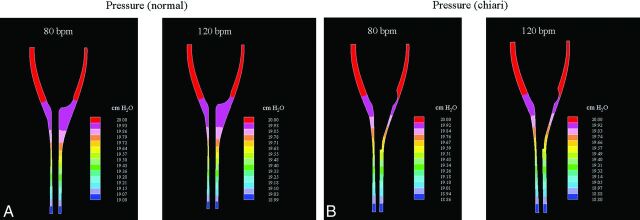
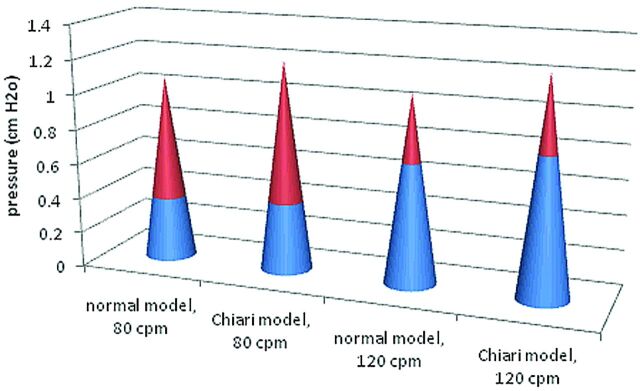
For both the normal and the Chiari models, pressure distribution generally changed in a smooth and gradual manner over the cycle at both heart rates. The largest pressure gradients were seen when flow changed direction. A characteristic pressure distribution is illustrated in Fig 6, when flow changed direction from cranial to caudal. As flow changed direction from caudal to cranial, pressure gradients were approximately equal in magnitude and distribution but opposite in direction (not shown). Peak values did not change as the heart rate increased. Average numbers, however, approximately doubled (Fig 7). When we compared Chiari to normal models (Table), it was clear that tonsillar herniation increased average and peak pressures by 11%–16% for both heart rates. Also evident from the Table (last 2 columns) is that if the cycle rate is increased from 80 to 120 cpm in the normal model, it elevates the superior-inferior average pressure difference more than herniated tonsils do at 80 cpm.
Fig 6.
Pressure distribution superiorly-inferiorly near the time of peak pressure gradients, as flow changes from cranial to caudal.
Fig 7.
Peak and average pressure differences (top-bottom) in the normal and Chiari I models at the 2 cycle rates. Average pressure difference is shown as the top of the blue region in the cone, and peak pressure difference, as the peak in the red portion of the cone.
Peak and average pressure differences (top-bottom) over the CSF flow cycle for the normal and Chiari models at cycle frequencies of 80 and 120 cpma
| Cycle Rate (cpm) | Peak Pressure Difference (cm H2O) |
Average Pressure Difference (cm H2O) |
||
|---|---|---|---|---|
| Normal | Chiari | Normal | Chiari | |
| 80 | 1.07 | 1.21 | 0.36 | 0.40 |
| 120 | 1.08 | 1.24 | 0.69 | 0.80 |
Absolute values were used.
Discussion
The study suggests that increasing the heart rate from 80 to 120 bpm in patients with Chiari or controls approximately doubles the average pressure gradients, whereas peak values remain unchanged. In addition, the range of synchronous bidirectional flow velocities is increased. Tonsillar herniation was found to elevate both peak and average pressure gradients equally during rest and exertion.
In our study, we assumed that the heart rate increased without changes in CSF flow volume per cycle during diastole and systole. To what extent CSF flow volume may change is not well-studied, though Ogoh and Ainslie8 discussed cerebral blood flow volume during exercise and Alperin et al7 addressed CSF flow in the supine position. The subarachnoid space boundaries were modeled as rigid, with immobile spinal cord and tonsils. Levy9 reported cord deflections of typically <1 mm, justifying this simplification. Our study did not include the effects of accelerated head and body movements or the effects of pulse pressure and respiration changes. These factors are also common during day-to-day activities, with an impact on CSF flow characteristics that requires further study.
The assumption of laminar flow is based on the low Reynolds numbers reported for CSF flow.5 Physiologically true turbulent flow cannot be ruled out, however, because there are structures (eg, nerves, dental ligaments, and so forth) within the subarachnoid space that might trigger such flow, even at low Reynolds numbers. The effect of any such flow characteristics is assumed small for the present work. The inflow/outflow CSF pulse characteristics (Fig 2) were based on blood flow measurement data presented by Chung et al.6 To what extent CSF flow characteristics are dictated by blood flow at different heart rates is not known in detail.
Our results would obviously be strengthened by a more extensive quantitative validation of the 2 models used. However, present day measurement data have limitations on resolution in space and time, making such a validation not yet realistic. Jet patterns are formed more easily with an elevated cycle rate. This seems reasonable because diastolic flow velocities increased at the same time as the CSF cycle period reduced from 0.75 to 0.5 seconds, causing larger fluid accelerations. As flow changed direction, the change first took place close to the walls. This is reasonable because there are no-slip conditions at the wall, making it easier to change direction there than in the inner parts of the subarachnoid space. No-slip conditions only exist on the boundary walls of the flow canal, creating the very narrow band of reverse flow close to the wall. The flow canal is wider in the normal model than in the Chiari model, causing lower bidirectional velocities to come close to zero. Ratios between such small velocities tend to “blow up” and become larger than what is seen in the Chiari model.
The elevation of average pressure with heart rate increase implies that the spinal cord becomes exposed to a higher pressure more often but that maximum pressures are unchanged. This altered pressure pattern will definitely affect the dynamic interplay between spinal cord and surrounding fluid and may play a part in syrinx formation. The observation that a cycle rate increase from 80 to 120 cpm in the normal model elevates the superior-inferior average pressure difference more than herniated tonsils at 80 cpm do was unexpected. It might suggest that for syringomyelia to develop, factors other than just higher superior-inferior pressure gradients are involved. Otherwise, healthy athletes would be prone to syrinx formation as well.
The effect of heart rate on CSF pressure and velocity may have relevance to the pathogenesis of syrinx or of neurologic symptoms in patients with Chiari. Clinical and computational studies show greater CSF velocities and pressures in patients with Chiari than in healthy subjects, though critical pressures and velocities have not been determined. Hypothetically, the alteration of pressures or velocities secondary to exertion may have a role in syrinx pathogenesis. Exertion often produces headaches in patients with Chiari, suggesting a possible combined effect of heart rate and tonsil position. Additional modeling may help explain syrinx pathogenesis, especially if critical peak or average pressures are identified. To this end, patient-specific models will be important, building the models directly from segmented MR imaging data. This is challenging, but we are making progress with such models10 and are currently working on patient-specific heart rate elevation.
Conclusions
Increasing the cycle rate from 80 to 120 cpm increased superior-inferior average pressure gradients and the range of synchronous bidirectional flow velocities in the normal and Chiari I models.
ABBREVIATIONS:
- bpm
beats per minute
- CFD
computational fluid dynamics
- cpm
cycles per minute
- PCMR
phase-contrast MR imaging
Footnotes
Disclosures: Victor Haughton—UNRELATED: Expert Testimony: I gave opinions to a lawyer on the issue of a Chiari malformation causing certain neurologic symptoms. I was paid for the time I spent in discussion. The discussion and the payment for my time in no way represent a conflict of interest for the study submitted by Linge et al. That legal case has been closed, as far as I know.* *Money paid to the institution.
This work was supported by a Center of Excellence grant from the Norwegian Research Council to Center for Biomedical Computing at Simula Research Laboratory.
References
- 1. Linge S, Haughton V, Løvgren AE, et al. Effect of tonsillar herniation on cyclic CSF flow studied with computational flow analysis. AJNR Am J Neuroradiol 2011;32:1474–81 [DOI] [PMC free article] [PubMed] [Google Scholar]
- 2. Greitz D. Unravelling the riddle of syringomyelia. Neurosurg Rev 2006;29:251–63, discussion 264 [DOI] [PubMed] [Google Scholar]
- 3. Heiss JD, Patronals N, DeVroom HL, et al. Elucidating the pathophysiology of syringomyelia. J Neurosurgery 1999;91:553–62 [DOI] [PubMed] [Google Scholar]
- 4. Linge S, Haughton V, Løvgren AE, et al. CSF flow dynamics at the cranio-vertebral junction studied with an idealized model of the subarachnoid space and computational flow analysis. AJNR Am J Neuroradiol 2010;31:185–92 [DOI] [PMC free article] [PubMed] [Google Scholar]
- 5. Loth F, Yardimci MA, Alperin N. Hydrodynamic modeling of cerebrospinal fluid motion within the spinal cavity. J Biomech Eng 2001;123:71–79 [DOI] [PubMed] [Google Scholar]
- 6. Chung CS, Karamanoglu M, Kovacs SJ. Duration of diastole and its phases as a function of heart rate during supine bicycle exercise. Am J Physiol Heart Circ Physiol 2004;287:H2003–08 [DOI] [PubMed] [Google Scholar]
- 7. Alperin N, Sivaramakrishnan A, Lichtor T. Magnetic resonance imaging-based measurements of cerebrospinal fluid and blood flow as indicators of intracranial compliance in patients with Chiari malformation. J Neurosurg 2005;103:46–52 [DOI] [PubMed] [Google Scholar]
- 8. Ogoh S, Ainslie PN. Cerebral blood flow during exercise: mechanisms of regulation. J Appl Physiol 2009;107:1370–80 [DOI] [PubMed] [Google Scholar]
- 9. Levy LM. Imaging of cerebrospinal fluid flow and spinal cord motion in neurologic disorders of the spine. Magn Reson Imaging Clin N Am 1999;7:573–87 [PubMed] [Google Scholar]
- 10. Rutkowska G, Haughton V, Linge S, et al. Patient-specific 3D simulation of cyclic CSF flow at the craniocervical region. AJNR Am J Neuroradiol 2012. April 26. [Epub ahead of print] [DOI] [PMC free article] [PubMed] [Google Scholar]


