Abstract
BACKGROUND AND PURPOSE:
Our aim was to compare the CT and PET/CT imaging features of osteoradionecrosis with those of recurrent disease after treatment of head and neck malignancy.
MATERIALS AND METHODS:
We retrospectively reviewed maxillofacial and neck CT scans obtained for suspected osteoradionecrosis or tumor recurrence for the presence of the following: 1) discrete solid mass, 2) cystic mass, 3) interruption of the bony cortex, 4) bony fragmentation, 5) bony trabecular loss, 6) intraosseous gas, and 7) bony sclerosis. Trabecular bone loss was further categorized as permeative (<75% loss of trabecula) or lucent (>75% loss). PET/CT studies performed for suspected osteoradionecrosis or tumor recurrence were evaluated for mean standard uptake value and maximum standard uptake value.
RESULTS:
Ten maxillofacial CT, 53 neck CT, and 23 PET/CT studies were performed in 63 patients. Osteoradionecrosis was diagnosed by pathology or imaging stability in 46 patients, and tumor recurrence, in 17 patients. Bony sclerosis was found to be significantly more prevalent in osteoradionecrosis and was never seen with tumor recurrence (P = .013). Patients with tumor recurrence were more likely to have a solid (P < .001) or cystic mass (P = .025), which was rare in osteoradionecrosis. While patients with tumor recurrence had significantly higher mean standard uptake values and maximum standard uptake values, there was significant overlap in mean standard uptake values and maximum standard uptake values between the 2 groups.
CONCLUSIONS:
There is significant overlap of standard uptake values in patients with osteoradionecrosis and tumor recurrence. CT findings provide more reliable diagnostic tools, with a solid or cystic mass strongly associated with tumor recurrence and bony sclerosis seen only with osteoradionecrosis.
Osteoradionecrosis (ORN), often with coexistent osteomyelitis, is a serious and often debilitating complication of radiation therapy for head and neck neoplasms. The mandible is the most common site of ORN due to its tenuous blood supply,1–3 though ORN can be seen in almost any bone within a radiated field. The primary factor implicated in the pathogenesis of ORN is the amount of radiation given to the affected bone, with both early (<2 years from radiation) and late onset ORN (>2 years from radiation) seen.4 There is a wide range of incidence of mandibular ORN reported, ranging from 5% to 22%, with more recent studies showing a decreased incidence, presumably attributable to increasing awareness and to improvements in preventive care and radiation techniques.5–9
Patients are often referred for imaging to evaluate the extent of clinically suspected ORN, and, at the same time, to assess potential tumor recurrence. Multiple previous reports have characterized the imaging findings of ORN,10–14 namely soft-tissue thickening and enhancement, cortical bone erosion, trabecular disorganization, and bone fragmentation. All these findings can be seen in tumor recurrence, however, making the imaging differentiation of these 2 entities quite challenging.
We compared the relative frequency of CT and PET/CT findings of ORN and tumor recurrence to find patterns that might allow reliable differentiation of one entity from the other.
Materials and Methods
Patient Selection and Image Acquisition
Our institutional review board approved this study, with a waiver of informed consent. All imaging examinations included in this study were performed as standard of care, and the results were retrospectively reviewed.
We searched our enterprise-wide electronic medical record encompassing 20 academic and community hospitals between January 1, 2008, and July 20, 2013, to identify patients in whom ORN was suspected on CT or PET/CT, or in whom a question of ORN versus recurrent tumor was raised. All neck and maxillofacial CT reports (including diagnostic neck CT studies performed as part of PET/CT) were searched by using the keywords “osteoradionecrosis,” “ORN,” “osteoradionecrosis versus tumor recurrence,” “osteoradionecrosis or tumor recurrence,” “osteoradionecrosis versus recurrent tumor,” and “osteoradionecrosis or recurrent tumor.” Patients were excluded if there was not pathologic confirmation of suspected tumor recurrence (1 patient) or if ORN could not be confirmed by either pathologic diagnosis or stability of >2 years on serial imaging (6 patients). A single patient was also excluded due to extensive artifacts from dental amalgam, which precluded accurate measurement of standard uptake value (SUV) values on PET/CT. The average time gap between imaging and pathologic confirmation of tumor recurrence or ORN was 14.3 days (range, 3–26 days) and 18.6 days (2–34 days), respectively. At our institution, all maxillofacial and neck CT examinations, as well as all PET/CT examinations performed for evaluation and/or follow-up of head and neck malignancy, are interpreted by fellowship-trained, Certificate of Added Qualification–certified neuroradiologists as part of a dedicated ear, nose, and throat imaging team. Demographic data collected included age and sex. Clinical data collected included location and type of primary neoplasm; initial imaging findings; follow-up imaging results, including any PET/CT results; time from completion of the last radiation therapy to the detection of the abnormality on imaging; and pathology results from either biopsy or operative intervention.
CT Examinations
CT examinations of the neck and maxillofacial bones were performed on 16- or 64-detector multidetector row CT scanners (LightSpeed VCT; GE Healthcare, Milwaukee, Wisconsin). CT acquisitions were obtained from the frontal sinuses to the thoracic inlet for the neck and from the top of the frontal sinuses through the mandible for the maxillofacial bones. Neck CT examinations were performed by using a pitch of 1.0, 2.5-mm collimation, 100 maximal mA, 120 kV(peak), 21.0-cm FOV, in bone and standard algorithms, with 2.0-mm sagittal and coronal reconstructions. Maxillofacial CT studies were performed by using pitch of 0.5, 1.25-mm collimation, 225 maximal mA, 125 kVp, 19.6-cm FOV, with bone and standard algorithms, with 1.0-mm sagittal and coronal reconstructions.
PET/CT Examinations
Patients fasted for at least 6 hours before the PET/CT examination with the exception of water intake. Intravenous access was established for both blood glucose measurement and radiopharmaceutical administration. If serum glucose was >200 mg/dL, the examination was cancelled and rescheduled. Patients received between 10 and 17 mCi of IV [18F] FDG. Following radiopharmaceutical administration, the patients rested quietly during a standard 60-minute uptake period, after which imaging was performed.
The studies were performed on 16- to 64-section PET/CT scanners (Discovery; GE Healthcare). The CT scan parameters were 120–130 kVP, variable/smart milliampere, and 3.75-mm collimation. CT scanning commenced following a 30-second delay after the administration of IV contrast (125-mL iopamidol, Isovue-370; Bracco Diagnostics, Princeton, New Jersey) and was performed from the top of the skull through the abdomen or pelvis (based on ordering clinician's preference). Following CT, PET data were acquired by using a 4-minute bed position. The PET acquisition included an on-line delayed coincidence subtraction to correct for random coincidences as well as a dead-time correction. Two different PET/CT scanners were used in this study; one had a bismuth germanium oxide scintillation crystal, and the other had a lutetium oxyorthosilicate crystal. All PET acquisitions were uniform, using a 2D technique. The helical CT scan was reconstructed by filtered back-projection into 512 × 512 pixel images with a section thickness of 2.4 mm to match the PET scan. Images were reconstructed by using ordered-subset-expectation maximization with 2 full iterations of 8 subsets. Rescaled CT images were used to produce attenuation-correction values for the PET emission reconstruction.
Image Analysis
CT Examinations.
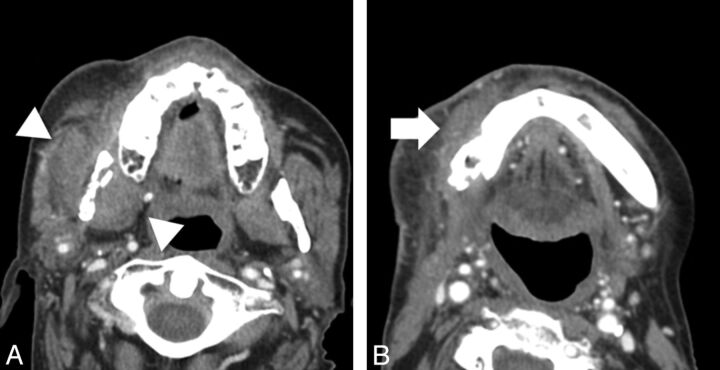
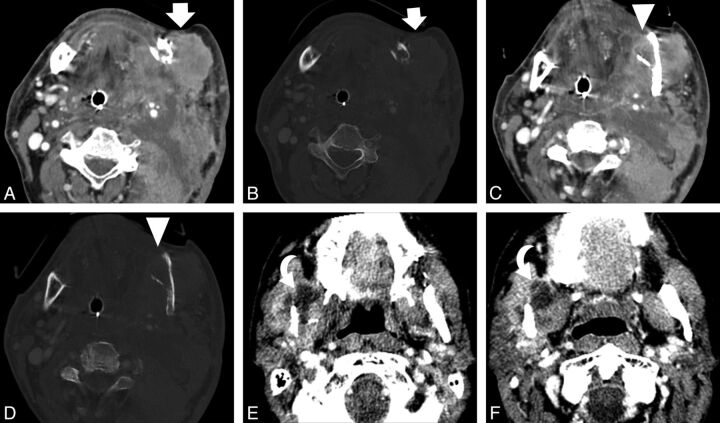
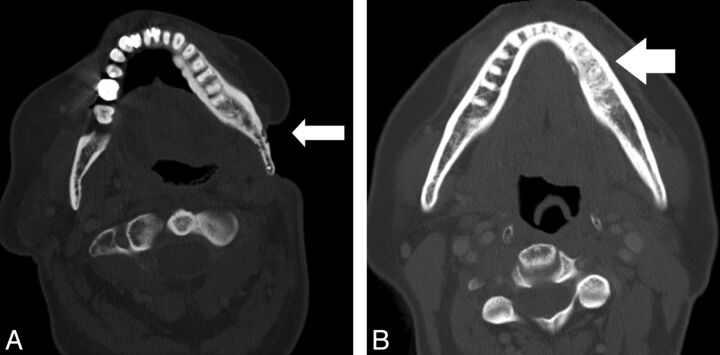
All CT examinations were reviewed retrospectively in random order, separately by 2 Certificate of Added Qualification–certified neuroradiologists (L.A., S.F.), blinded to the clinical findings, the original study interpretation, and the final pathologic diagnosis. Reviewers were asked to comment on the presence or absence of the following imaging findings: 1) a solid measurable mass, 2) a cystic mass, 3) interruption of the cortical margin of the affected bone, 4) fragmentation of the affected bone, 5) loss of trabecula of the affected bone, 6) intraosseous gas in the affected bone, and 7) sclerosis of the affected bone. They were instructed that surrounding inflammatory change (ie, amorphous soft-tissue stranding or infiltration) and muscle or tissue thickening (Fig 1A, -B) did not qualify as a solid mass and that a discrete measurable mass (Fig 2) must be present. They were further asked to measure the size of any solid or cystic mass (Fig 2E, -F), and in those cases in which trabecular loss existed, they were asked to classify the pattern of trabecular loss as either permeative or lucent. They were instructed that a permeative pattern indicated multiple, independent focal lucent lesions, which, in sum, did not account for >75% loss of total bone trabecula (Fig 3A). A lucent pattern was defined as >75% loss of total bone trabecula in the area of abnormality (Fig 2C, -D). Radiologists were also asked to record the area or areas of the mandible affected, with choices being either the right or left mandibular condyle, coronoid process, ramus, angle, or body.
Fig 1.
Images from 2 different patients with soft-tissue findings of osteoradionecrosis. A, Axial CT scan (soft-tissue window) shows enlargement and thickening of the musculature of the right masticator space (white arrowheads), without evidence of a distinct measurable mass, adjacent to an area of osteoradionecrosis. B, Axial CT scan (soft-tissue window) shows inflammatory thickening of soft tissues (white arrow) adjacent to an area of osteoradionecrosis involving the right mandibular body.
Fig 2.
Images depicting soft-tissue findings of recurrent tumor. Axial CT scan from a 62-year-old man with recurrent oral cancer shows a large mass (white arrows) adjacent to the left mandibular angle in soft-tissue (A) and bone (B) algorithms. Axial CT scan at a different level shows an area of lucent trabecular loss involving the left mandibular angle (white arrowheads) in soft-tissue (C) and bone (D) algorithms. Axial CT images in an 83-year-old patient with recurrent oral cancer show another finding seen in recurrent tumor, a cystic mass (curved arrows), at 2 different levels (E and F).
Fig 3.
Images from 2 different patients with osseous findings of osteoradionecrosis. A, Axial CT scan (bone algorithm) shows ORN involving the mandibular angle with an adjacent soft-tissue defect. Areas of permeative trabecular loss (white arrow) are evident. B, Axial CT scan (bone algorithm) shows ORN involving the left mandibular body with bony sclerotic changes (white arrow) evident.
PET Examinations.
In cases in which PET/CT was performed, the radiologists were asked to record both the mean (SUVmean) and maximum (SUVmax) SUV values. All PET studies were analyzed quantitatively with a software platform capable of deformable registration of multimodal images in the sagittal, coronal, and axial planes (Mirada XD3; Mirada Medical, Denver, Colorado). On PET scans, metabolic volumes were manually delineated at the most metabolically active site of suspected ORN or tumor recurrence.
The SUV was automatically calculated by using the following formula:
where d is the injected dose (in becquerels), w is the patient's body weight (in grams), and Cdc is the decay-corrected tracer tissue concentration (in becquerels per gram). SUV was measured as SUVmean and SUVmax. These parameters were obtained from a 2D region of interest placed onto the axial image containing the most metabolically active area of abnormality (based on visual inspection). The smallest possible region of interest was used that would capture the most metabolically active area of abnormality. SUVmean was defined as the average pixel value in the region of interest, while SUVmax was defined as the highest pixel value in the region of interest.
Statistical Analysis
Comparison of the demographic data between the 2 groups was performed by using a Fisher exact test for dichotomous variables and a 2-tailed, unpaired t test for continuous variables. The reproducibility of subjective imaging findings was tested between 2 fellowship-trained neuroradiologists on 50 randomly chosen cases from among patients with ORN and tumor, and a Cohen κ was calculated. Comparison of the prevalence of imaging findings between the 2 groups was performed with the Fisher exact test. Comparison of SUVmean and SUVmax was performed between cases of osteoradionecrosis and tumor recurrence by using a 2-tailed, unpaired t test. P < .05 was considered indicative of a statistically significant difference.
Results
Fifty-three neck CTs and 10 maxillofacial CTs were evaluated. Twenty-three patients had a PET/CT performed as well. Seventeen of these studies demonstrated findings of tumor recurrence, while 46 demonstrated findings of ORN. Of the subset of patients with a PET/CT, 14 demonstrated findings of ORN, while 9 demonstrated findings of tumor recurrence. No significant differences were found between the 2 groups with regard to age, sex, or the interval between the end of radiation therapy and the detection of an abnormality on imaging (P = .11, 1.00, and 0.19, respectively). Demographic and clinical data for the 2 groups are summarized in the Table.
Patient demographics and clinical characteristics
| Patients Diagnosed with Osteoradionecrosis | Patients Diagnosed with Tumor Recurrence | P Value | |
|---|---|---|---|
| No. of patients | 46 | 17 | NA |
| Average age (yr) | 62 | 69 | .11 |
| Age range (yr) | 33–93 | 53–85 | |
| % Men (No.) | 76.1 (35) | 77.5 (13) | 1.00 |
| Primary malignancy site | Oral Cavity (n = 27), oropharynx (n = 11), parotid (n = 5), NPC (n = 2) unknown (n = 1) | Oral cavity (n = 15), oropharynx (n = 1), sinonasal (n = 1) | |
| Primary malignancy histology | Squamous cell (n = 44), adenoid cystic (n = 2) | Squamous cell (n = 17) | |
| Mean interval (range) between last RT and detection of abnormality (mo) | 40.56 (6–110) | 48.82 (5–98) | .19 |
Note:—NA indicates not applicable; NPC, nasopharyngeal cancer; RT, radiation therapy.
Most cases of ORN primarily affected the mandible (43 patients, 93%), with 1 case involving the hard palate, and 2 cases involving the maxilla. Most cases of ORN involving the mandible affected either 1 or 2 subsites of the mandible ipsilateral to the site of primary tumor (31 patients, 72%), with the remaining cases affecting either 3 (6 patients, 14%) or >3 (6 patients, 14%) subsites of the mandible. The preponderance of ORN cases involving the mandible affected the lingual surface (20 patients, 47%), while the remainder affected either the buccal surface (13 patients, 30%) or involved both the lingual and buccal surfaces (10 patients, 23%). None of the patients received hyperbaric oxygen before detection of ORN.
Interpretation of the subjective imaging findings between observers was almost perfect, by using Cohen κ interpreted according to Landis and Koch,15 with κ values as follows: 0.865 (95% CI, 0.683–1.00) for cortical disruption, 0.868 (95% CI, 0.724–1.00) for a pattern of trabecular loss, 0.891 (95% CI, 0.743–1.00) for the presence of a cystic mass, 0.940 (95% CI, 0.823–1.00) for the presence of a solid mass, 0.929 (95% CI, 0.792–1.00) for the presence of bony sclerosis, and 1.000 (95% CI, 1.00–1.00) for the presence of intraosseous gas.
CT Examinations
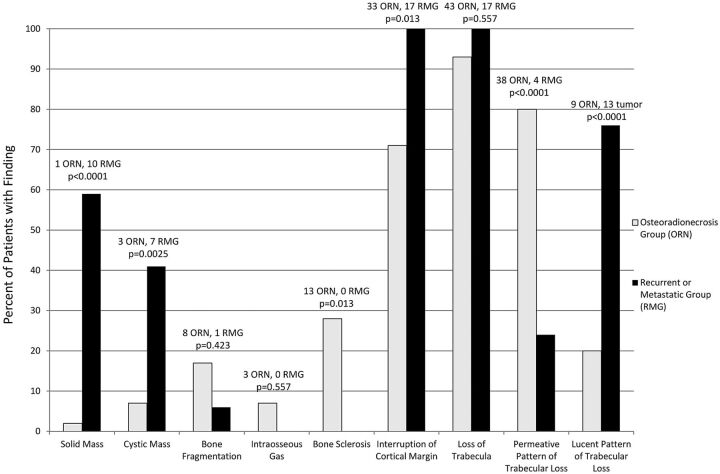
The CT imaging findings in both groups of patients are summarized in Fig 4. The presence of a measurable solid soft-tissue mass in the tumor-recurrence group was 59% (10 of 17 patients), which is significantly higher than that in the osteoradionecrosis group (1 of 46 patients, 2%, P < .001). Similarly, the presence of a cystic mass was also significantly higher in the recurrence group, 41% (7 of 17 patients), than in the osteoradionecrosis group (3 of 46 patients, 6.5%, P = .025).
Fig 4.
Prevalence of imaging findings of ORN and metastatic or recurrent lesions.
Several osseous changes showed a significant difference between the 2 groups as well. A permeative pattern of trabecular loss was significantly higher in the ORN group, 80% (37 of 46 patients), than the tumor-recurrence group (4 of 24 patients, 16.7%, P < .0001). Bone sclerosis was also seen significantly more often in the setting of ORN, 28% (13 of 33 patients), than in tumor recurrence (0 of 17 patients, 0%, P = .013). While interruption of the cortical margin was seen significantly more often in the tumor-recurrence group (17 of 17 patients, 100%) than in the ORN group (33 of 46 patients, 71.7%, P = .013), it was noted to have a rather high prevalence in both groups.
PET Examinations
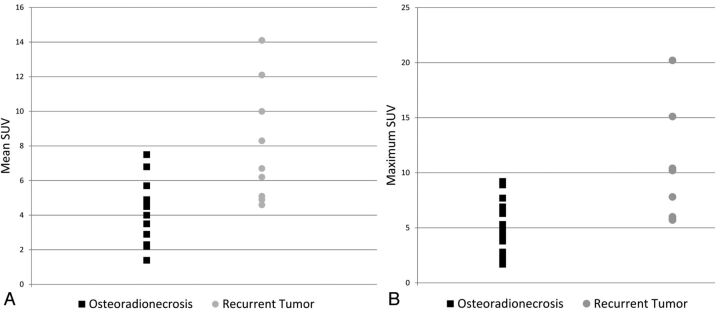
The SUVmean was significantly higher in cases of tumor recurrence (SUVmean range, 4.6–14.1; mean, 8.0) compared with ORN (SUVmean range, 2.2–7.5; mean, 4.3), with a P value of .0021. Likewise, the SUVmax was significantly higher in cases of tumor recurrence (SUVmax range, 5.7–20.2; mean, 11.3) compared with ORN (SUVmax range, 1.7–9.2; mean, 5.3), with a P value of .0023. There was, however, substantial overlap in both SUVmean and SUVmax values between the 2 entities (Fig 5A, -B).
Fig 5.
Scatterplots for SUV measurements for patients with ORN and those with tumor recurrence. A, Scatterplot for SUVmean in patients with ORN and tumor recurrence demonstrates significant overlap between SUV values, despite a significant difference between their means. B, Scatterplot for SUVmax in patients with ORN and tumor recurrence also demonstrates significant overlap between maximum SUV values in the 2 groups.
In the subset of patients with ORN who underwent histopathologic sampling, 20% (5 of 25 patients), had pathologic evidence of associated osteomyelitis. Unfortunately, only 1 of those patients also underwent a PET/CT examination; therefore, it is difficult to compare the relative SUV values of ORN with and without associated osteomyelitis.
Discussion
The findings of a cystic or solid mass on imaging were significantly more prevalent in patients with tumor recurrence, being relatively rare in patients with ORN. Conversely, the presence of bony sclerosis was not uncommon in patients with ORN but was never seen in tumor recurrence. Although the SUV values in tumor recurrence were significantly higher than in ORN, the substantial overlap in the SUV values for these 2 entities renders SUV measurements relatively impractical for differentiating ORN from tumor recurrence reliably in the clinical setting.
We attempted to evaluate the utility of various CT findings and PET/CT parameters in an effort to distinguish ORN from recurrent malignancy in the head and neck following irradiation for head and neck cancer. Multiple prior studies have also found the relative unreliability of an elevated SUV in differentiating recurrent tumor from ORN.11,12,16–18 While recurrent tumor does, in general, demonstrate higher SUVmean and SUVmax values compared with ORN, there is significant overlap, which makes differentiating the 2 entities on a case-by-case basis extremely unreliable. This overlap is presumably responsible for previous reports of false-positive results in PET scans attributed to osteoradionecrosis.16
Unlike SUV values, there were conventional imaging findings that were rather selective for differentiating ORN from tumor recurrence. In evaluating tumor recurrence, a discrete, associated mass provides a significant diagnostic indication for the presence of recurrent tumor. While ORN may be associated with inflammatory and edematous changes in the surrounding musculature and soft tissues,10,19–21 an asymmetric, discrete solid mass was seen in more than half of the patients with recurrent malignancy, but it was exceedingly rare in ORN, seen in only 2% of patients with ORN. Similarly, a cystic mass was seen in nearly half of patients with recurrent tumor, but in <10% of patients with ORN. This indicates that the presence of a cystic component in a patient with suspected ORN should not be assumed to be an abscess from associated osteomyelitis but should instead prompt concern for possible recurrent neoplasm.
Osseous findings on CT can also be extremely helpful in differentiating ORN from tumor recurrence. Multiple prior studies have delineated the classic bony CT findings associated with ORN, namely cortical disruption, trabecular loss, bone fragmentation, bony sclerosis, and the presence of intraosseous gas.1,10,11,13,21 However, we tested the value of these imaging findings for discriminating ORN and tumor recurrence. Traditionally, on the basis of known pathologic findings in ORN, it has been thought that a more permeative pattern of bone loss is seen in ORN as opposed to tumor recurrence. This was thought to be related to the fact that irradiation leads to a relatively hypoxic, hypocellular, and hypovascular substrate with an inconsistent ability to remodel tissue loss secondary to radiation-induced injury22; this, in turn, would lead to relatively less bony loss than would be seen when tissue is being actively destroyed and replaced by tumor. In our patients, the permeative pattern of bone loss, though significantly more common in ORN, was also seen in a significant minority of patients with tumor recurrence. This may be related to our patient population, which is actively surveyed both clinically and with imaging for tumor recurrence. This hypervigilance for tumor recurrence may lead to earlier detection of recurrent tumor, which may show less advanced bony replacement, mimicking the more restrained bone loss seen in ORN. Similarly, significant bone replacement producing a lucent pattern of trabecular loss, though common in tumor recurrence, was also seen in one-fifth of patients with ORN, presumably reflecting more advanced radiation injury or aggressive infection in this subset of patients.
Perhaps the most useful imaging feature in distinguishing ORN from tumor recurrence was the presence of bony sclerosis (Fig 3B). Seen in nearly one-third of patients with ORN, it was not seen in any of our patients with recurrent tumor. This finding may reflect the tendency of squamous cell carcinoma to induce bony destruction rather than sclerosis in contradistinction to the often chronic nature of ORN that may be associated with bony sclerosis.13,23 Thus, while most patients with ORN may not have bony sclerosis, the presence of this finding on imaging should prompt a relatively confident diagnosis of ORN rather than tumor recurrence. Similarly, intraosseous gas, which has been suggested to be pathognomonic of superimposed osteomyelitis,24 was not seen in any of our patients with tumor recurrence. This finding did not reach significance in our study, however, in part due to its overall rarity on imaging for either entity.
These imaging findings are readily incorporated into clinical practice and were highly reproducible among observers in our study. The near-perfect agreement indicated by the very high κ values for each of the imaging findings evaluated in this study suggests that interpretation of these imaging findings will be consistent when implemented clinically.
There were several limitations to our study. We purposefully geared our initial search to evaluate only lesions that were either thought to be ORN on imaging or for which the interpreting radiologist entertained the diagnosis of ORN versus tumor recurrence. While this search results in a selection bias toward cases in which the 2 entities look similar and results in a greater number of patients with ORN, we would argue that these “problem cases” are most relevant to everyday practice and the situation in which specific imaging findings may be the most useful. Additionally, not all patients in our study with ORN had pathologic correlation; in many cases, the clinician and patient preferred a noninvasive method of follow-up. As such, it is possible that undetected tumor recurrence occurred in the bed of ORN, confounding evaluation of imaging findings. However, we believe the chances of recurrent tumor remaining stable on imaging studies during a 2-year period are relatively low. Finally, clinical variables such as radiation dose and time from radiation were not considered in our analysis because we, instead, chose to focus on the imaging picture as it was presented to an interpreting radiologist.
Conclusions
The presence of a discrete solid or cystic mass is associated with tumor recurrence, while bony sclerosis, though not common, was seen exclusively in the setting of ORN in our study. Permeative rather than lucent trabecular loss was most often seen in the setting of ORN, but it may also be seen in a minority of patients with recurrent tumor. Finally, while an elevated SUV does suggest a diagnosis of tumor recurrence, the significant overlap of SUV values in patients with tumor recurrence and ORN renders SUV values relatively impractical for use on an individual clinical basis.
ABBREVIATIONS:
- ORN
osteoradionecrosis
- SUV
standard uptake value
- SUVmean
mean standard uptake value
- SUVmax
maximum standard uptake value
References
- 1. Rabin BM, Meyer JR, Berlin JW, et al. Radiation-induced changes in the central nervous system and head and neck. Radiographics 1996;16:1055–72 [DOI] [PubMed] [Google Scholar]
- 2. Rayatt SS, Mureau MA, Hoffer SO. Osteoradionecrosis of the mandible: etiology, prevention, diagnosis and treatment. Indian J Plast Surg 2007;40:65–71 [Google Scholar]
- 3. Bras J, de Jonge HK, van Merkesteyn JP. Osteoradionecrosis of the mandible: pathogenesis. Am J Otolaryngol 1990;11:244–50 [DOI] [PubMed] [Google Scholar]
- 4. Chopra S, Kamdar D, Ugur O, et al. Factors predictive of the severity of osteoradionecrosis of the mandible. Head Neck 2011;33:1600–05 [DOI] [PubMed] [Google Scholar]
- 5. Epstein JB, Wong FL, Stevenson-Moore P. Osteoradionecrosis: clinical experience and a proposal for classification. J Oral Maxillofac Surg 1987;45:104–10 [DOI] [PubMed] [Google Scholar]
- 6. Støre G, Boysen M. Mandibular osteonecrosis: clinical behavior and diagnostic aspects. Clin Otolaryngol Allied Sci 2000;25:378–84 [DOI] [PubMed] [Google Scholar]
- 7. Reuther T, Schuster T, Mende U, et al. Osteoradionecrosis of the jaw as a side effect of radiotherapy of head and neck tumour patients: a report of a thirty year retrospective review. Int J Oral Maxillofac Surg 2003;32:289–95 [DOI] [PubMed] [Google Scholar]
- 8. Jereczek-Fossa BA, Orrechia R. Radiotherapy-induced mandibular bone complications. Cancer Treat Rev 2002;28:65–74 [DOI] [PubMed] [Google Scholar]
- 9. Studer G, Grätz KW, Glanzmann C. Osteoradionecrosis of the mandibula in patients treated with different fractionations. Stranhlenther Onkol 2004;180:233–40 [DOI] [PubMed] [Google Scholar]
- 10. Chong J, Hinckley L, Ginsberg L. Masticator space abnormalities associated with mandibular osteoradionecrosis: MR and CT findings in five patients. AJNR Am J Neuroradiol 2000;21:175–78 [PMC free article] [PubMed] [Google Scholar]
- 11. Hamilton JD, Lai SY, Ginsberg LE. Superimposed infection in mandibular osteoradionecrosis: diagnosis and outcome. J Comput Assist Tomogr 2012;36:725–31 [DOI] [PMC free article] [PubMed] [Google Scholar]
- 12. Yoo JS, Rosenthal DI, Mitchell K, et al. Osteoradionecrosis of the hyoid bone: imaging findings. AJNR Am J Neuroradiol 2010;31:761–66 [DOI] [PMC free article] [PubMed] [Google Scholar]
- 13. Glastonbury CM, Parker EE, Hoang JK. The postradiation neck: evaluating response to treatment and recognizing complications. AJR Am J Roentgenol 2010;195:W164–71 [DOI] [PubMed] [Google Scholar]
- 14. Wu L, Liu J, Wang C, et al. Osteoradionecrosis of the upper cervical spine after radiation therapy for head and neck cancer: differentiation from recurrent of metastatic disease with MR imaging. Radiology 2012;264:136–45 [DOI] [PubMed] [Google Scholar]
- 15. Landis JR, Koch GG. The measurement of observer agreement for categorical data. Biometrics 1977;33:159–74 [PubMed] [Google Scholar]
- 16. Liu S-H, Chang J, Ng SH, et al. False positive fluorine-18 fluorodeoxy-D-glucose positron emission tomography finding caused by osteoradionecrosis in a nasopharyngeal carcinoma patient. Br J Radiol 2004;77:257–60 [DOI] [PubMed] [Google Scholar]
- 17. Krabbe C, Pruim J, Dijkstra P, et al. 18F-FDG PET as a routine post-treatment surveillance tool in oral and oropharyngeal squamous cell carcinoma: a prospective study. J Nucl Med 2009;50:1940–47 [DOI] [PubMed] [Google Scholar]
- 18. Abgral R, Querellou S, Potrad G, et al. Does 18F-FDG PET/CT improve the detection of posttreatment recurrence of head and neck squamous cell carcinoma in patients negative for disease on clinical follow up? J Nucl Med 2009;50:24–29 [DOI] [PubMed] [Google Scholar]
- 19. Ng SH, Liu MH, Ko SF, et al. Post treatement imaging of the nasopharynx. Eur J Radiol 2002;44:82–95 [DOI] [PubMed] [Google Scholar]
- 20. King AD, Griffith JF, Abrigo JM, et al. Osteoradionecrosis of the upper cervical spine: MR imaging following radiotherapy for nasopharyngeal carcinoma. Eur J Radiol 2010;73:629–35 [DOI] [PubMed] [Google Scholar]
- 21. Hermans R, Fossion E, Ioannides C, et al. CT findings in osteoradionecrosis of the mandible. Skeletal Radiol 1996;25:31–36 [DOI] [PubMed] [Google Scholar]
- 22. Marx RE. Osteoradionecrosis: a new concept of its pathophysiology. J Oral Maxillofac Surg 1983;41:283–88 [DOI] [PubMed] [Google Scholar]
- 23. Store G, Larheim TA. Mandibular osteoradionecrosis: a comparison of computed tomography with panoramic radiography. Dentomaxillofac Radiol 1999;28:295–300 [DOI] [PubMed] [Google Scholar]
- 24. Merine D, Fishman EK, Magid D. CT detection of sacral osteomyelitis associated with pelvic abscesses. J Comput Assist Tomogr 1988;12:118–21 [DOI] [PubMed] [Google Scholar]


