

Abstract
BACKGROUND AND PURPOSE:
The multiparametric imaging can show us different aspects of tumor behavior and may help differentiation of tumor recurrence from treatment related change. Our aim was to differentiate tumor progression from pseudoprogression in patients with glioblastoma by using multiparametric histogram analysis of 2 consecutive MR imaging studies with relative cerebral blood volume and ADC values.
MATERIALS AND METHODS:
Thirty-five consecutive patients with glioblastoma with new or increased size of enhancing lesions after concomitant chemoradiation therapy following surgical resection were included. Combined histograms were made by using the relative cerebral blood volume and ADC values of enhancing areas for initial and follow-up MR imaging, and subtracted histograms were also prepared. The histogram parameters between groups were compared. The diagnostic accuracy of tumor progression based on the histogram parameters of initial and follow-up MR imaging and subtracted histograms was compared and correlated with overall survival.
RESULTS:
Twenty-four pseudoprogressions and 11 tumor progressions were determined. Diagnosis based on the subtracted histogram mode with a multiparametric approach was more accurate than the diagnosis based on the uniparametric approach (area under the receiver operating characteristic curve of 0.877 versus 0.801), with 81.8% sensitivity and 100% specificity. A high mode of relative cerebral blood volume on the subtracted histogram by using a multiparametric approach (relative cerebral blood volume ×ADC) was the best predictor of true tumor progression (P < .001) and worse survival (P = .003).
CONCLUSIONS:
Multiparametric histogram analysis of posttreatment glioblastoma was useful to predict true tumor progression and worse survival.
The current standard treatment protocol for glioblastomas is surgical resection followed by 6 weeks of radiation therapy plus concomitant temozolomide chemotherapy (CCRT) and 6 cycles of adjuvant temozolomide chemotherapy. This protocol increases median survival from 12 to 15 months.1
However, during the treatment, subacute treatment-related reactions called pseudoprogression frequently occur as edema and contrast enhancement on MR imaging.2–5 Pseudoprogression is most commonly seen on the first MR imaging performed within 2 months after CCRT. Tumors with hypermethylation of the O6-methylguanine-DNA methyltransferase promoter gene show pseudoprogression more frequently.6
As shown in previous studies, enlarged enhancing lesions on conventional MR images may actually represent pseudoprogression in up to 46.8%–64% of cases.7,8 The Response Assessment in Neuro-Oncology (RANO) Working Group9 proposed that within the first 12 weeks of completion of radiation therapy, when pseudoprogression is most prevalent, tumor progression can only be determined if most of the new enhancement is outside the radiation field or if there is pathologic confirmation of progressive disease.
There has been much effort to differentiate progression from pseudoprogression by using advanced MR imaging techniques such as DWI and dynamic susceptibility contrast PWI. On DWI, ADC values are higher in necrotic tissue than in recurrent tumor tissue because of the high cellularity of tumor tissue.10 However, the use of DWI is limited due to the heterogeneity of tumor content. Reduced diffusion represents not only highly cellular tumor areas but also inflammatory processes.11
On PWI, high relative cerebral blood volume (rCBV) is considered active neovascularization and viable tumor.11,12 Kong et al6 reported that rCBV > 1.47 had 81.5% sensitivity and 77.8% specificity for differentiating pseudoprogression from tumor progression. Kim et al13 reported a histogram analysis of rCBV, in which a peak height position of >1.7 showed 90.2% sensitivity and 91.1% specificity for differentiating tumor recurrence from mixed and treatment change groups. However, rCBV analysis has limitations because most lesions have variable tumor fractions; therefore, mean rCBV and histogram-based metrics may be influenced by the rCBV from both tumoral and nontumoral components.14
To overcome these limitations, Mangla et al12 evaluated 2 consecutive MR imaging studies after treatment and showed that in patients with pseudoprogression, there was a 41% mean decrease in rCBV, while in tumor progression, there was a 12% increase in rCBV from pretreatment to posttreatment. Baek et al8 performed histogram analysis on 2 consecutive MR imaging studies of posttreatment glioblastomas and revealed that the percentage change of skewness and kurtosis of normalized CBV can differentiate pseudoprogression from true tumor progression with a sensitivity of 85.7% and a specificity of 89.2%.
In this study, in addition to the evaluation of 2 consecutive MR imaging studies, we tried a multiparametric approach—that is, the combined use of DWI and PWI. We hypothesized that a multiparametric approach may overcome the limitations of each imaging technique. DWI and PWI have characteristic functional or physiologic parameters such as ADC/cellularity and CBV/tumor angiogenesis. If we use these multiple parameters simultaneously, these multiparametric analyses can reveal different aspects of tumor behavior and may have added value for differentiating tumor progression from pseudoprogression.
The aims of this study were to compare the change of combined rCBV × ADC histograms in 2 consecutive MR imaging studies between true tumor progression and pseudoprogression and to compare the diagnostic efficacy of a uniparametric-versus-multiparametric approach.
Materials and Methods
Study Population
Between April 2008 and July 2010, one hundred sixty consecutive patients underwent surgical treatment for glioblastoma in our institution. Of the 160 patients, 35 met the following criteria: 1) standard treatment for glioblastoma; 2) new or increased size of a measurable enhancing lesion (>1 cm) within the radiation field within 180 days after CCRT; 3) 2 consecutive MRIs with dynamic susceptibility contrast perfusion and DWI at the time of increased lesion size and within 3 months after the initial MR imaging; 4) >2 follow-up MRIs or pathologic diagnosis; and 5) MRIs without significant artifacts that prevented dynamic susceptibility contrast perfusion analysis. This retrospective study was approved by the institutional review board in the hospital, and the requirement for informed consent was waived.
There were 18 men and 17 women (age range, 24–70 years; mean, 49 years). The interval between the operation and initial MR imaging (at the time of increased lesion size) was 123.5 ± 34.7 days (range, 79∼204 days), the interval between initial MR imaging and first follow-up MR imaging was 53.7 ± 36.0 days (range, 19∼142 days), and the interval between the first and second follow-up MR imaging was 59.3 ± 17.5 days (range, 29∼95 days). In 3 patients, craniotomy and tumor removal were performed for pathologic diagnosis.
True tumor progression and pseudoprogression were confirmed after adjuvant temozolomide according to the RANO criteria.9 More specifically, pseudoprogression was defined as stable or decreased size of an enhancing lesion at ≥2 consecutive follow-up MR imaging studies compared with the initial MR imaging. Tumor progression was defined as increased size of the enhancing lesion at ≥2 consecutive follow-up MR imaging studies compared with the initial MR imaging or pathologically revealed recurrent tumor. Group categorization was performed with a qualitative method by consensus of 2 neuroradiologists (J.C., S.T.K.).
MR Imaging Protocol
MR imaging was performed at 3T (Achieva; Philips Healthcare, Best, the Netherlands) with an 8-channel sensitivity encoding head coil.
Contrast-enhanced axial spin-echo T1-weighted imaging was acquired after intravenous injection of contrast material (gadoterate meglumine, Dotarem; Guerbet, Aulnay-sous-Bois, France), 0.1 mmol/kg of body weight by power injector, with the following parameters: TR/TE = 500/10 ms, section thickness = 5 mm, acquisition matrix = 256 × 226.
Spin-echo EPI DWI (TR/TE = 3000/76 ms, section thickness = 5 mm, acquisition matrix = 128 × 128, b-value = 0, 1000 s/mm2) and dynamic susceptibility contrast PWI (TR/TE = 1720/35 ms, flip angle = 40°, section thickness = 5 mm, acquisition matrix = 128 × 128, fifty volumes, acquisition time = 1 minute 30 seconds) were performed. All MR images were acquired with the same FOV (240 × 240 mm).
rCBV Map Analysis
Dynamic susceptibility contrast perfusion images were processed by using a dedicated software package (nordicICE; NordicNeuroLab, Bergen, Norway). An rCBV map was generated by using an established tracer kinetic model applied to the first-pass data.15 Gamma variate fitting was applied to avoid a recirculation effect. As described previously, the dynamic curves were corrected mathematically to reduce contrast agent leakage effects.16,17 The rCBV maps were normalized by dividing the rCBV value in the region of interest by the rCBV value of normal-appearing white matter defined by a neuroradiologist (J.C.).
Histogram Analysis
For each tumor, a region of interest was drawn on the contrast-enhanced T1-weighted images, including whole enhancing lesions, on each section by using MRIcro software (http://www.mccauslandcenter.sc.edu/mricro/mricro.html) from the initial (MR imaging obtained at the time of increased lesion size) and follow-up MR imaging (first follow-up MR imaging obtained within 3 months after the initial MR imaging) by a neuroradiologist (J.C.). The cerebral cortex was avoided when drawing the region of interest. Before data analysis, rCBV and ADC maps were coregistered to the contrast-enhanced T1-weighted images by using affine transformation with normalized mutual information18 as a cost function.
For histogram analysis, rCBV and ADC values within the region of interest were extracted by using Matlab software (MathWorks, Natick, Massachusetts). Only ADC values of 5∼3000 and rCBV of 0.3∼12 were considered meaningful, because beyond these ranges, the values may be from noise, cystic or necrotic areas, or CSF. Combined 3D histograms were made by using acquired rCBV and ADC values of each voxel (ADC range, 0∼3000; interval, 100; rCBV range, 0∼12, interval, 0.4; total, 900 bins). From the histogram, mean, SD, maximum frequency, mode, kurtosis, and skewness of ADC values and rCBV on the initial and follow-up MR imaging were calculated (Fig 1).
Fig 1.

Histogram parameters. Mode is the value with the maximum frequency on the histogram. Median is the middle value. Kurtosis is a measure of whether the data are peaked (high kurtosis) or flat (low kurtosis) relative to a normal distribution. Skewness is a measure of asymmetry. Negative skew means that the left tail is longer; positive skew means that the right tail is longer.
To evaluate the change in the histogram between initial and follow-up MR imaging, we subtracted the histograms of initial MR imaging from the histograms of follow-up MR imaging. The histogram subtraction was performed with a uniparametric approach (subtraction of ADC and rCBV histograms independently) and multiparametric approach (the combined ADC × rCBV 3D histogram of the initial MR imaging was subtracted from the combined 3D histogram of the follow-up MR imaging). Then, the mode of the ADC value and rCBV of the subtracted histogram were calculated.
Statistical Analysis
Statistical analyses were performed by using the IBM SPSS Statistics, Version 20 (IBM, Armonk, New York). The mean, SD, maximum frequency, mode, kurtosis, and skewness of ADC values and rCBV between the progression group and the pseudoprogression group were compared by using the Mann-Whitney test for initial and follow-up MR imaging. The mode of the ADC values and the rCBV of the subtracted histogram with uniparametric and multiparametric approaches were compared between the 2 groups by using the Mann-Whitney test. The diagnostic performance (sensitivity, specificity, accuracy) of tumor progression based on the increased size of the enhancing lesion, histogram parameters of the initial and follow-up MR imaging, and the subtracted histogram were compared by using a receiver operating characteristic curve analysis. Subsequently, multivariable stepwise logistic regression analysis was used to determine the significant predictors for the differential diagnosis between true progression and pseudoprogression.
We used the date of surgical resection to determine overall survival, and survival curves were calculated by using the Kaplan-Meier method. We compared overall survival between tumor progression and pseudoprogression using the log-rank test, and we correlated the parameters of histogram and mode of the subtracted histogram with overall survival.
Results
Histogram Analysis
Twenty-four cases of pseudoprogression (Fig 2) and 11 cases of tumor progression (Fig 3) were determined on the basis of stable or decreased size of the enhancing lesion on the consecutive follow-up study (n = 32) or pathologic diagnosis (n = 3).
Fig 2.

A 54-year-old man with glioblastoma who underwent tumor removal followed by CCRT. Sixty-eight days after CCRT, the enhancing lesion developed around the surgical cavity (A). On follow-up MR imaging performed 52 days after CCRT (B), the size of enhancing lesion was increased, suggestive of tumor progression. However, a subtracted 3D histogram shows a decreased population (blue) of high rCBV voxels (C), and an increased population (red) of low rCBV/high ADC components. Craniotomy and tumor removal were performed, and pathologic findings showed radiation necrosis, suggestive of pseudoprogression.
Fig 3.
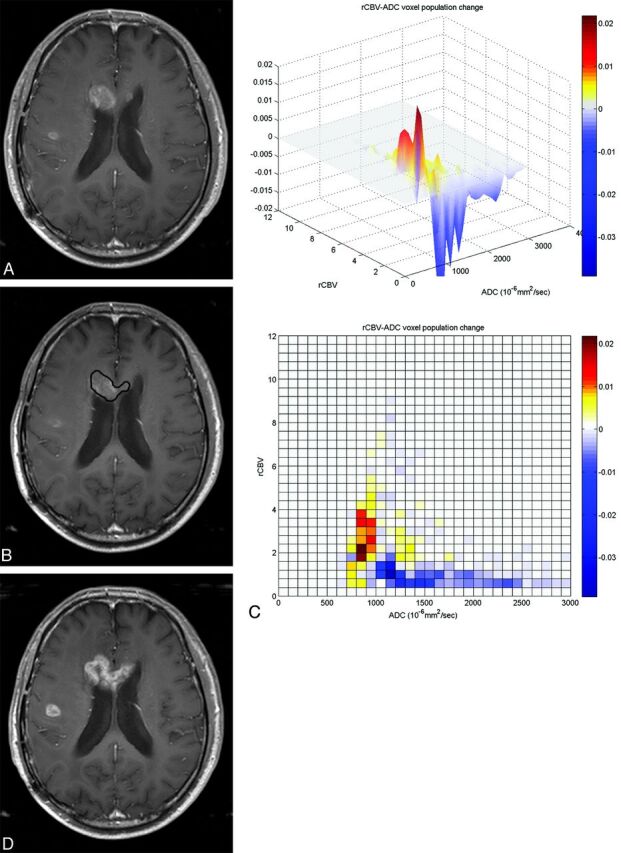
A 70-year-old man with glioblastoma who underwent tumor removal followed by CCRT. One hundred forty-two days after CCRT, the enhancing lesion developed in the genu of corpus callosum (A). On follow-up MR imaging performed 54 days after CCRT (B), the enhancing lesion was stable or somewhat decreased in size, suggestive of pseudoprogression. However, the 3D histogram shows a markedly increased population (coded as red) of high rCBV voxels with relatively low ADC values (C). Eventually, the enhancing lesion increased in size on follow-up MR imaging (D) performed after 67 days from first follow-up MR imaging (B), and tumor progression was diagnosed.
On the histogram analysis (Tables 1 and 2), at initial MR imaging, all parameters of ADC values and rCBV did not show any significant difference between the 2 groups. At follow-up MR imaging, the mean (P < .001) and SD (P = .001) of the rCBV were larger in the progression group than in the pseudoprogression group. Maximum frequency (P < .001), kurtosis (P = .030), and skewness (P = .039) of rCBV were smaller in the progression group than in the pseudoprogression group. The parameters of ADC values did not differ significantly between the groups on follow-up MR imaging.
Table 1:
Histogram parameters of the initial MRIa
| Pseudoprogression (n = 24) | Progression (n = 11) | P Value | |
|---|---|---|---|
| ADCb | |||
| Mean | 1404.9 ± 195.4 | 1376.0 ± 145.0 | .570 |
| SD | 468.0 ± 118.9 | 368.5 ± 117.3 | .055 |
| Max freq | 0.15 ± 0.05 | 0.16 ± 0.05 | .356 |
| Mode | 1154.2 ± 196.7 | 1240.9 ± 186.8 | .320 |
| Kurtosis | 4.89 ± 3.27 | 4.54 ± 2.29 | .972 |
| Skewness | 1.14 ± 0.65 | 0.91 ± 0.64 | .434 |
| rCBV | |||
| Mean | 1.72 ± 0.59 | 1.72 ± 0.55 | .804 |
| SD | 1.25 ± 0.45 | 1.18 ± 0.52 | .722 |
| Max freq | 0.24 ± 0.09 | 0.24 ± 0.09 | .972 |
| Mode | 0.93 ± 0.48 | 0.93 ± 0.30 | .562 |
| Kurtosis | 8.74 ± 4.84 | 8.71 ± 7.52 | .434 |
| Skewness | 1.89 ± 0.69 | 1.72 ± 0.99 | .570 |
Note:—Max freq indicates maximum relative frequency.
Numbers represent means.
Unit of ADC value = 10−6mm2/s.
Table 2:
Histogram parameters of the follow-up MRIa
| Pseudoprogression (n = 24) | Progression (n = 11) | P Value | |
|---|---|---|---|
| ADCb | |||
| Mean | 1402.4 ± 187.7 | 1345.5 ± 204.5 | .546 |
| SD | 404.0 ± 85.3 | 402.1 ± 110.1 | .804 |
| Max freq | 0.14 ± 0.05 | 0.16 ± 0.05 | .241 |
| Mode | 1245.8 ± 178.1 | 1222.7 ± 331.9 | .430 |
| Kurtosis | 4.96 ± 2.31 | 4.64 ± 2.00 | .776 |
| Skewness | 1.09 ± 0.62 | 1.05 ± 0.69 | .915 |
| rCBV | |||
| Mean | 1.40 ± 0.42 | 2.15 ± 0.51 | <.001 |
| SD | 1.01 ± 0.40 | 1.50 ± 0.38 | .001 |
| Max freq | 0.30 ± 0.10 | 0.17 ± 0.05 | <.001 |
| Mode | 0.80 ± 0.26 | 0.96 ± 0.52 | .522 |
| Kurtosis | 9.68 ± 4.11 | 6.49 ± 3.02 | .030 |
| Skewness | 2.05 ± 0.65 | 1.54 ± 0.63 | .039 |
Note:—Max freq indicates maximum relative frequency.
Numbers represent means.
Unit of ADC value = 10−6mm2/s.
On the subtracted histogram (Fig 4, Table 3), the mode of rCBV was higher (P = .003) and the mode of ADC (P = .008) was lower in the progression group with a uniparametric approach. However, with a multiparametric approach, only the mode of rCBV was higher (P < .001) in the progression group than in the pseudoprogression group. On multivariable logistic regression analysis, the multiparametric mode of rCBV was the only independently differentiating parameter (P = .005).
Fig 4.

The subtracted 3D histogram of each group by using a multiparametric approach. A, The tumor progression group shows an increased voxel population with high rCBV and relatively low ADC values (800∼1200 × 10−6mm2/s) and a decreased population with low rCBV with a wide range of ADC values. B, The pseudoprogression group shows a decreased voxel population with high rCBV and relatively low ADC, which shows increased population in the tumor progression group. In contrast, voxels with low rCBV with a wide range of ADCs (1000∼2000 × 10−6mm2/s) show an increased population in the pseudoprogression group.
Table 3:
The mode of rCBV and ADC values of the subtracted histogram using uniparametric and multiparametric approachesa
| Pseudoprogression (n = 24) | Progression (n = 11) | P Value | |
|---|---|---|---|
| Uniparametric | |||
| ADC modeb | 1404.2 ± 407.5 | 1004.6 ± 317.4 | .008 |
| rCBV mode | 1.0 ± 0.7 | 2.3 ± 1.2 | .003 |
| Multiparametric | |||
| ADC modeb | 1412.5 ± 365.7 | 1259.1 ± 320.8 | .238 |
| rCBV mode | 1.0 ± 0.3 | 2.3 ± 1.1 | <.001 |
Numbers represent means.
Unit of ADC value = 10−6mm2/s.
Diagnostic Performance of Histogram Parameters
On the histogram analysis of the initial and follow-up MR imaging studies, the most significant parameter was the mean rCBV of the follow-up MR imaging. For the subtracted histogram, receiver operating characteristic curve analysis (Fig 5) showed that the mode of rCBV by using a multiparametric approach had a larger area under the curve (0.877 versus 0.801) than when using the uniparametric approach for differentiating pseudoprogression from tumor progression. Therefore, we used the mean rCBV of the follow-up MR imaging and the mode of rCBV with the multiparametric approach as representative parameters to compare diagnostic performance.
Fig 5.

Receiver operating characteristic curve analysis for the mode of rCBV on the subtracted histogram by using uniparamteric and multiparametric approaches for differentiating tumor progression from pseudoprogression. Diagonal line = 50% of the area under the receiver operating characteristic curve analysis.
The sensitivity, specificity, and accuracy of diagnosing tumor progression based on the size change of enhancing lesions were 72.7%, 83.3%, and 80.0%, respectively. The sensitivity, specificity, and accuracy of the diagnosis based on the mean rCBV > 1.8 of follow-up MR imaging were 81.8%, 83.3%, and 82.9%, respectively. The diagnosis based on the mode of rCBV > 1.6 on the subtracted histogram was most accurate, with 81.8% sensitivity, 100% specificity, and 94.3% accuracy.
Survival Analysis
Twenty-six (74%) of the 35 patients had died by the time of data analysis. The mean follow-up period was 556 ± 288 days. The overall median survival from the operation to death or last follow-up was 513 days. The median survival (Fig 6A) of the progression group (394 days) was significantly shorter than that of the pseudoprogression group (565 days) (P = .037). The median survival rate was not significantly different in terms of the mean rCBV of follow-up MR imaging with any threshold (rCBV > 1.5∼ 2.2). The median survival (Fig 6B) was significantly different in terms of the mode of rCBV on the subtracted histogram with threshold rCBV > 1.8 (394 versus 561 days, P = .003), and it was statistically more significant than the survival difference of the progression and pseudoprogression groups.
Fig 6.

Graph data indicate that overall cumulative (Cum) survival is significantly better for patients with pseudoprogression (A) and mode of rCBV < 1.8 on the subtracted histogram with a multiparametric approach (B) after CCRT.
Discussion
In this study, we evaluated subtracted combined ADC × rCBV 3D histograms of 2 consecutive MR imaging studies; therefore, we could observe the changing trend of the histogram pattern between the 2 studies. The diagnostic performance of the subtracted histogram was better than that of a single MR imaging study; especially, the mode of the subtracted histogram, which was the best predictor. In addition, the mode acquired from the multiparametric approach showed better diagnostic performance than that of the uniparametric approach.
A major limitation of rCBV for posttreatment evaluation is that the treatment-related inflammation also causes increased rCBV. In cases of radiation necrosis of the brain19 around the liquefied center, there are areas of active inflammatory responses with lymphocytes and macrophages, resulting in some degree of increased rCBV. On DWI, radiation necrosis may show diffusion restriction, probably due to intracellular edema and viscous puslike material with abundant polymorphonuclear leukocytes in the transition zone.10,20,21 Therefore, increased rCBV does not always mean viable tumor angiogenesis, and decreased ADC values do not always mean high cellularity. Using multiparametric analysis with rCBV and ADC values, we may exclude the effects of radiation necrosis when evaluating ADC values because radiation necrosis shows low rCBV on its diffusion-restriction area. In addition, we may exclude the effect of inflammation when evaluating rCBV because inflammation with edema shows increased ADC values. In this study, with a uniparametric approach, both rCBV and ADC were significantly different between the progression and pseudoprogression groups, but with the multiparametric approach, only rCBV was significantly different between the groups—that is, in terms of rCBV, the statistical significance was increased when the rCBV was stratified by ADC values; however, in terms of the ADC value, the statistical significance was decreased with stratification.
Another limitation of rCBV analysis is related to contrast material leakage. Because the rCBV calculation of dynamic susceptibility contrast perfusion MR imaging is based on the absence of contrast material leakage to the extravascular space, leakage of contrast material can cause underestimation of rCBV.16 Contrast preload and mathematic correction can be used to overcome these effects. We used mathematic correction, which is known to be equivalent to preload for the correction of contrast material leakage effect.17
Emblem et al22 suggested that tumor malignancy was related to CBV heterogeneity, and Law et al23 also suggested that the histogram parameter that had the highest correlation with glioma grade was SD. This was because an increase of the SD and a decrease of the maximum frequency for high-grade gliomas could reflect heterogeneous tumor angiogenesis. High-grade gliomas that initially had heterogeneous vascularity may have reduced heterogeneity after radiation therapy. Tumor progression/recurrence may increase in heterogeneity due to heterogeneous angiogenesis of the viable tumor component. In this study, the tumor progression group showed increased voxel population with high rCBV and low ADC values (Fig 4A). In contrast, in the pseudoprogression group, the voxel population with high rCBV was decreased and the ADC was more elevated and dispersed (Fig 4B). In the tumor progression group, the SD of rCBV was increased, and the maximum frequency and kurtosis were decreased on follow-up MR imaging. These results suggest increased heterogeneity of the tumor.
Hu et al14 proposed the perfusion MR imaging–fractional tumor burden method for evaluation of post-treatment glioblastoma. The perfusion MR imaging (pMRI)–fractional tumor burden describes the population of the risk voxels with values of more than threshold rCBV (rCBV = 1). The perfusion MR imaging (pMRI)–fractional tumor burden metric reliably estimated the histologic tumor fraction and correlated with overall survival. However, the mean rCBV and histogram mode of rCBV less strongly correlated with the histologic tumor fraction and did not correlate with overall survival. This result is probably because most lesions are histologically admixed and broadly variable in tumor fractions; therefore, the mean rCBV (similar to other histogram-based metrics) is influenced by the rCBV from both tumoral and nontumoral components.14 In our study, rCBV histogram parameters of initial MR imaging did not show any significant difference. Because of the heterogeneity of the lesion, posttreatment tumor evaluation by using the mean values of the overall lesion on a single MR imaging study is an intrinsically limited effort.
In this study, the proportion of pseudoprogression in patients with new or enlarged enhancing lesions was 69%. In previous studies, enlarged lesions on conventional MR images may actually have represented pseudoprogression in up to 46.8%–64% of cases, compatible with our results.8,24 Because pseudoprogression is so common, the RANO Working Group recommended a second MR imaging at 4 weeks to confirm the presence of response or stable disease.9 However, pseudoprogression can be sustained or aggravated for >4 weeks; therefore, it can mimic tumor progression.25 Therefore, the diagnosis of tumor progression based on the size of the enhancing lesion may cause false-positive (Fig 2) or false-negative results (Fig 3). Mangla et al12 showed that increased rCBV after treatment was a stronger predictor of poor survival (area under the receiver operating characteristic curve = 0.806). However, change in tumor size did not correlate with overall survival (area under the receiver operating characteristic curve = 0.566). If increased rCBV on follow-up MR imaging was used to differentiate true disease progression and pseudoprogression, the sensitivity was 76.9% and the specificity was 85.7%. In our study, if one considered the mode of rCBV on the subtracted histogram, the diagnostic accuracy was increased from 80% to 94.3%, compared with the diagnosis based on the tumor size change.
Another problem is the ambiguous nature of the reference standard of pseudoprogression. The criterion standard for diagnosing pseudoprogression is histopathology; however, biopsy may have sampling errors, and even a specimen obtained with second-look surgery may have residual infiltrated tumor cells, which can be erroneously interpreted by the pathologist.26,27 Therefore, there is an innate limitation in differentiating pseudoprogression from tumor progression. In this study, we also correlated imaging biomarkers with overall survival. The high mode of rCBV on the subtracted histogram by using a multiparametric approach (rCBV × ADC) was a good predictor of worse survival as well as tumor progression.
Our study has several limitations. First is the retrospective nature of the study. Second, due to the small number of cases, especially progression relative to pseudoprogression, generalizability and statistical power are limited. Third, tumor progression and pseudoprogression were determined mainly by follow-up MR imaging, and pathologic confirmation was performed in only a few patients. Finally, the region of interest was drawn only on the enhancing portion of the lesion; therefore, the effect of the nonenhancing infiltrative portion was not evaluated. However, this study focused on the particular clinical situation—that is, a newly developed or increased size of the enhancing lesion mimicking tumor progression; therefore, only the nature or change of the enhancing lesion was considered.
Conclusions
Multiparametric 3D histogram analysis with ADC values and rCBV was useful to evaluate posttreatment glioblastomas. Tumor progression showed increased rCBV and increased heterogeneity on follow-up studies; however, pseudoprogression did not. A high mode of rCBV on the subtracted histogram by using a multiparametric approach (rCBV × ADC) was the best predictor of true tumor progression and worse survival.
ABBREVIATIONS:
- CCRT
concurrent chemoradiotherapy
- RANO
Response Assessment in Neuro-Oncology
- rCBV
relative cerebral blood volume
References
- 1. Stupp R, Mason WP, van den Bent MJ, et al. Radiotherapy plus concomitant and adjuvant temozolomide for glioblastoma. N Engl J Med 2005;352:987–96 [DOI] [PubMed] [Google Scholar]
- 2. Caroline I, Rosenthal MA. Imaging modalities in high-grade gliomas: pseudoprogression, recurrence, or necrosis? J Clin Neurosci 2012;19:633–37 [DOI] [PubMed] [Google Scholar]
- 3. Yang I, Aghi MK. New advances that enable identification of glioblastoma recurrence. Nat Rev Clin Oncol 2009;6:648–57 [DOI] [PubMed] [Google Scholar]
- 4. Brandsma D, Stalpers L, Taal W, et al. Clinical features, mechanisms, and management of pseudoprogression in malignant gliomas. Lancet Oncol 2008;9:453–61 [DOI] [PubMed] [Google Scholar]
- 5. Chaskis C, Neyns B, Michotte A, et al. Pseudoprogression after radiotherapy with concurrent temozolomide for high-grade glioma: clinical observations and working recommendations. Surg Neurol 2009;72:423–28 [DOI] [PubMed] [Google Scholar]
- 6. Kong DS, Kim ST, Kim EH, et al. Diagnostic dilemma of pseudoprogression in the treatment of newly diagnosed glioblastomas: the role of assessing relative cerebral blood flow volume and oxygen-6-methylguanine-DNA methyltransferase promoter methylation status. AJNR Am J Neuroradiol 2011;32:382–87 [DOI] [PMC free article] [PubMed] [Google Scholar]
- 7. Husby JA, Espeland A, Kalyanpur A, et al. Double reading of radiological examinations in Norway. Acta Radiol 2011;52:516–21 [DOI] [PubMed] [Google Scholar]
- 8. Baek HJ, Kim HS, Kim N, et al. Percent change of perfusion skewness and kurtosis: a potential imaging biomarker for early treatment response in patients with newly diagnosed glioblastomas. Radiology 2012;264:834–43 [DOI] [PubMed] [Google Scholar]
- 9. Wen PY, Macdonald DR, Reardon DA, et al. Updated response assessment criteria for high-grade gliomas: Response Assessment in Neuro-Oncology Working Group. J Clin Oncol 2010;28:1963–72 [DOI] [PubMed] [Google Scholar]
- 10. Asao C, Korogi Y, Kitajima M, et al. Diffusion-weighted imaging of radiation-induced brain injury for differentiation from tumor recurrence. AJNR Am J Neuroradiol 2005;26:1455–60 [PMC free article] [PubMed] [Google Scholar]
- 11. Hygino da Cruz LC, Jr, Rodriguez I, Domingues RC, et al. Pseudoprogression and pseudoresponse: imaging challenges in the assessment of posttreatment glioma. AJNR Am J Neuroradiol 2011;32:1978–85 [DOI] [PMC free article] [PubMed] [Google Scholar]
- 12. Mangla R, Singh G, Ziegelitz D, et al. Changes in relative cerebral blood volume 1 month after radiation-temozolomide therapy can help predict overall survival in patients with glioblastoma. Radiology 2010;256:575–84 [DOI] [PubMed] [Google Scholar]
- 13. Kim HS, Kim JH, Kim SH, et al. Posttreatment high-grade glioma: usefulness of peak height position with semiquantitative MR perfusion histogram analysis in an entire contrast-enhanced lesion for predicting volume fraction of recurrence. Radiology 2010;256:906–15 [DOI] [PubMed] [Google Scholar]
- 14. Hu LS, Eschbacher JM, Heiserman JE, et al. Reevaluating the imaging definition of tumor progression: perfusion MRI quantifies recurrent glioblastoma tumor fraction, pseudoprogression, and radiation necrosis to predict survival. Neuro Oncol 2012;14:919–30 [DOI] [PMC free article] [PubMed] [Google Scholar]
- 15. Ostergaard L, Weisskoff RM, Chesler DA, et al. High resolution measurement of cerebral blood flow using intravascular tracer bolus passages. Part I. Mathematical approach and statistical analysis. Magn Reson Med 1996;36:715–25 [DOI] [PubMed] [Google Scholar]
- 16. Boxerman JL, Schmainda KM, Weisskoff RM. Relative cerebral blood volume maps corrected for contrast agent extravasation significantly correlate with glioma tumor grade, whereas uncorrected maps do not. AJNR Am J Neuroradiol 2006;27:859–67 [PMC free article] [PubMed] [Google Scholar]
- 17. Boxerman JL, Prah DE, Paulson ES, et al. The role of preload and leakage correction in gadolinium-based cerebral blood volume estimation determined by comparison with MION as a criterion standard. AJNR Am J Neuroradiol 2012;33:1081–87 [DOI] [PMC free article] [PubMed] [Google Scholar]
- 18. Maes F, Collignon A, Vandermeulen D, et al. Multimodality image registration by maximization of mutual information. IEEE Trans Med Imaging 1997;16:187–98 [DOI] [PubMed] [Google Scholar]
- 19. Yoshii Y. Pathological review of late cerebral radionecrosis. Brain Tumor Pathol 2008;25:51–58 [DOI] [PubMed] [Google Scholar]
- 20. Tung GA, Evangelista P, Rogg JM, et al. Diffusion-weighted MR imaging of rim-enhancing brain masses: is markedly decreased water diffusion specific for brain abscess? AJR Am J Roentgenol 2001;177:709–12 [DOI] [PubMed] [Google Scholar]
- 21. Cha J, Kim ST, Kim HJ, et al. Analysis of the layering pattern of the apparent diffusion coefficient (ADC) for differentiation of radiation necrosis from tumour progression. Eur Radiol 2013;23:879–86 [DOI] [PubMed] [Google Scholar]
- 22. Emblem KE, Nedregaard B, Nome T, et al. Glioma grading by using histogram analysis of blood volume heterogeneity from MR-derived cerebral blood volume maps. Radiology 2008;247:808–17 [DOI] [PubMed] [Google Scholar]
- 23. Law M, Young R, Babb J, et al. Histogram analysis versus region of interest analysis of dynamic susceptibility contrast perfusion MR imaging data in the grading of cerebral gliomas. AJNR Am J Neuroradiol 2007;28:761–66 [PMC free article] [PubMed] [Google Scholar]
- 24. Brandes AA, Franceschi E, Tosoni A, et al. MGMT promoter methylation status can predict the incidence and outcome of pseudoprogression after concomitant radiochemotherapy in newly diagnosed glioblastoma patients. J Clin Oncol 2008;26:2192–97 [DOI] [PubMed] [Google Scholar]
- 25. Taal W, Brandsma D, de Bruin HG, et al. Incidence of early pseudo-progression in a cohort of malignant glioma patients treated with chemoirradiation with temozolomide. Cancer 2008;113:405–10 [DOI] [PubMed] [Google Scholar]
- 26. Chamberlain MC. Pseudoprogression in glioblastoma. J Clin Oncol 2008;26:4359, author reply 4359–60 [DOI] [PubMed] [Google Scholar]
- 27. Chamberlain MC, Glantz MJ, Chalmers L, et al. Early necrosis following concurrent Temodar and radiotherapy in patients with glioblastoma. J Neurooncol 2007;82:81–83 [DOI] [PubMed] [Google Scholar]