Abstract
Although top-down proteomics has emerged as a powerful strategy to characterize proteins in biological systems, the analysis of endogenous membrane proteins remains challenging due to their low solubility, low abundance, and the complexity of the membrane sub-proteome. Here, we report a simple but effective enrichment and separation strategy for top-down proteomics of endogenous membrane proteins enabled by cloud point extraction and multidimensional liquid chromatography coupled to high-resolution mass spectrometry (MS). The cloud point extraction efficiently enriched membrane proteins using a single extraction, eliminating the need for time-consuming ultracentrifugation steps. Subsequently, size-exclusion chromatography (SEC) with an MS-compatible mobile phase (59% water, 40% isopropanol, 1% formic acid) was used to remove the residual surfactant and fractionate intact proteins (6–115 kDa). The fractions were separated further by reversed-phase liquid chromatography (RPLC) coupled with MS for protein characterization. This method was applied to human embryonic kidney cells and cardiac tissue lysates, to enable the identification of 188 and 124 endogenous integral membrane proteins respectively, some with as many as 19 transmembrane domains.
Graphical Abstract

Introduction
Membrane proteins play critical roles in cellular functions and represent the largest class of therapeutic targets.1–4 Despite accounting for one-third of protein-encoding genes, membrane proteins are generally under-characterized compared to other protein classes (e.g., <1% of structures in the Protein Database),4 because of the tremendous challenges in studying them. The proteomic analysis of these biomolecules is particularly difficult due to their high hydrophobicity (thus low solubility), low abundance in the proteome, and the complexity of the membrane sub-proteome.5,6 Characterization of biological systems at the level of proteoforms7–9 with top-down mass spectrometry (MS) has allowed the analysis of combinatorial post-translational modifications (PTMs) together with amino acid sequence variations and provided important insights into biology.10–13 Given the combined technical challenges associated with membrane proteins and top-down proteomics,10 robust strategies targeting the membrane proteome remain underdeveloped.
Among the few top-down MS studies of membrane proteins, Whitelegge and colleagues first characterized purified membrane proteins to provide primary structural information, including PTMs.14–16 Later, Kelleher and co-workers introduced large-scale top-down analysis of membrane proteins from mitochondria using many lysis and ultracentrifugation steps followed by gel-eluted liquid fraction entrapment electrophoresis (GELFrEE),17,18 and reversed-phase liquid chromatography (RPLC)-MS/MS with an additional prefractionation step of solution isoelectric focusing for deeper proteome coverage.19 These important advances enabled the top-down MS analysis of membrane proteins, but the multi-step preparations are time-consuming and labor-intensive and generally, these studies have targeted the mitochondria membrane sub-proteome.17,19–21 Recently, we established a simpler, high-throughput membrane proteomics approach enabled by a novel photocleavable surfactant, 4-hexylphenylazosulfonate (referred to as Azo) for both top-down and bottom-up MS.22,23 Because Azo is a strong ionic surfactant that can solubilize all categories of proteins, many structural, nuclear, and extracellular proteins were also extracted in addition to the targeted membrane proteins, the overall fraction of membrane proteins among the enriched proteins was lower than desired (28% of identified proteins were integral membrane proteins). On the other hand, mild nonionic surfactants show little hydrophobic interaction with water-soluble proteins; therefore, they selectively interact with hydrophobic membrane proteins.24 Thus, a method that utilizes a mild surfactant to target the membrane proteome with selectivity for integral membrane proteins25 would complement the Azo-enabled comprehensive proteomics strategy.
Herein, we aimed to develop a streamlined strategy for top-down membrane proteomics with a simple yet effective enrichment and separation of endogenous membrane proteins using cloud point extraction24,26 from complex cell and tissue lysates (Scheme 1). The cloud point extraction with nonionic surfactants, such as Triton X-11424,26 or Tergitol NP-7,27 provided a phase separation with hydrophilic proteins found exclusively in the aqueous phase and integral membrane proteins recovered in the surfactant phase. However, because surfactants significantly suppress the MS signals,28 the direct analysis of the enriched membrane proteins by RPLC-MS after cloud point extraction was not feasible. Therefore, to effectively remove the residual surfactant29–31 and simultaneously fractionate proteins based on size, we further developed a fast (<20 min) membrane protein-compatible SEC fractionation strategy (Scheme 1). RPLC-MS/MS analysis was used for protein identification and characterization (Scheme 1). Significantly, the integrated strategy enabled the enrichment and top-down proteomics analysis of large membrane proteins.
Scheme 1.
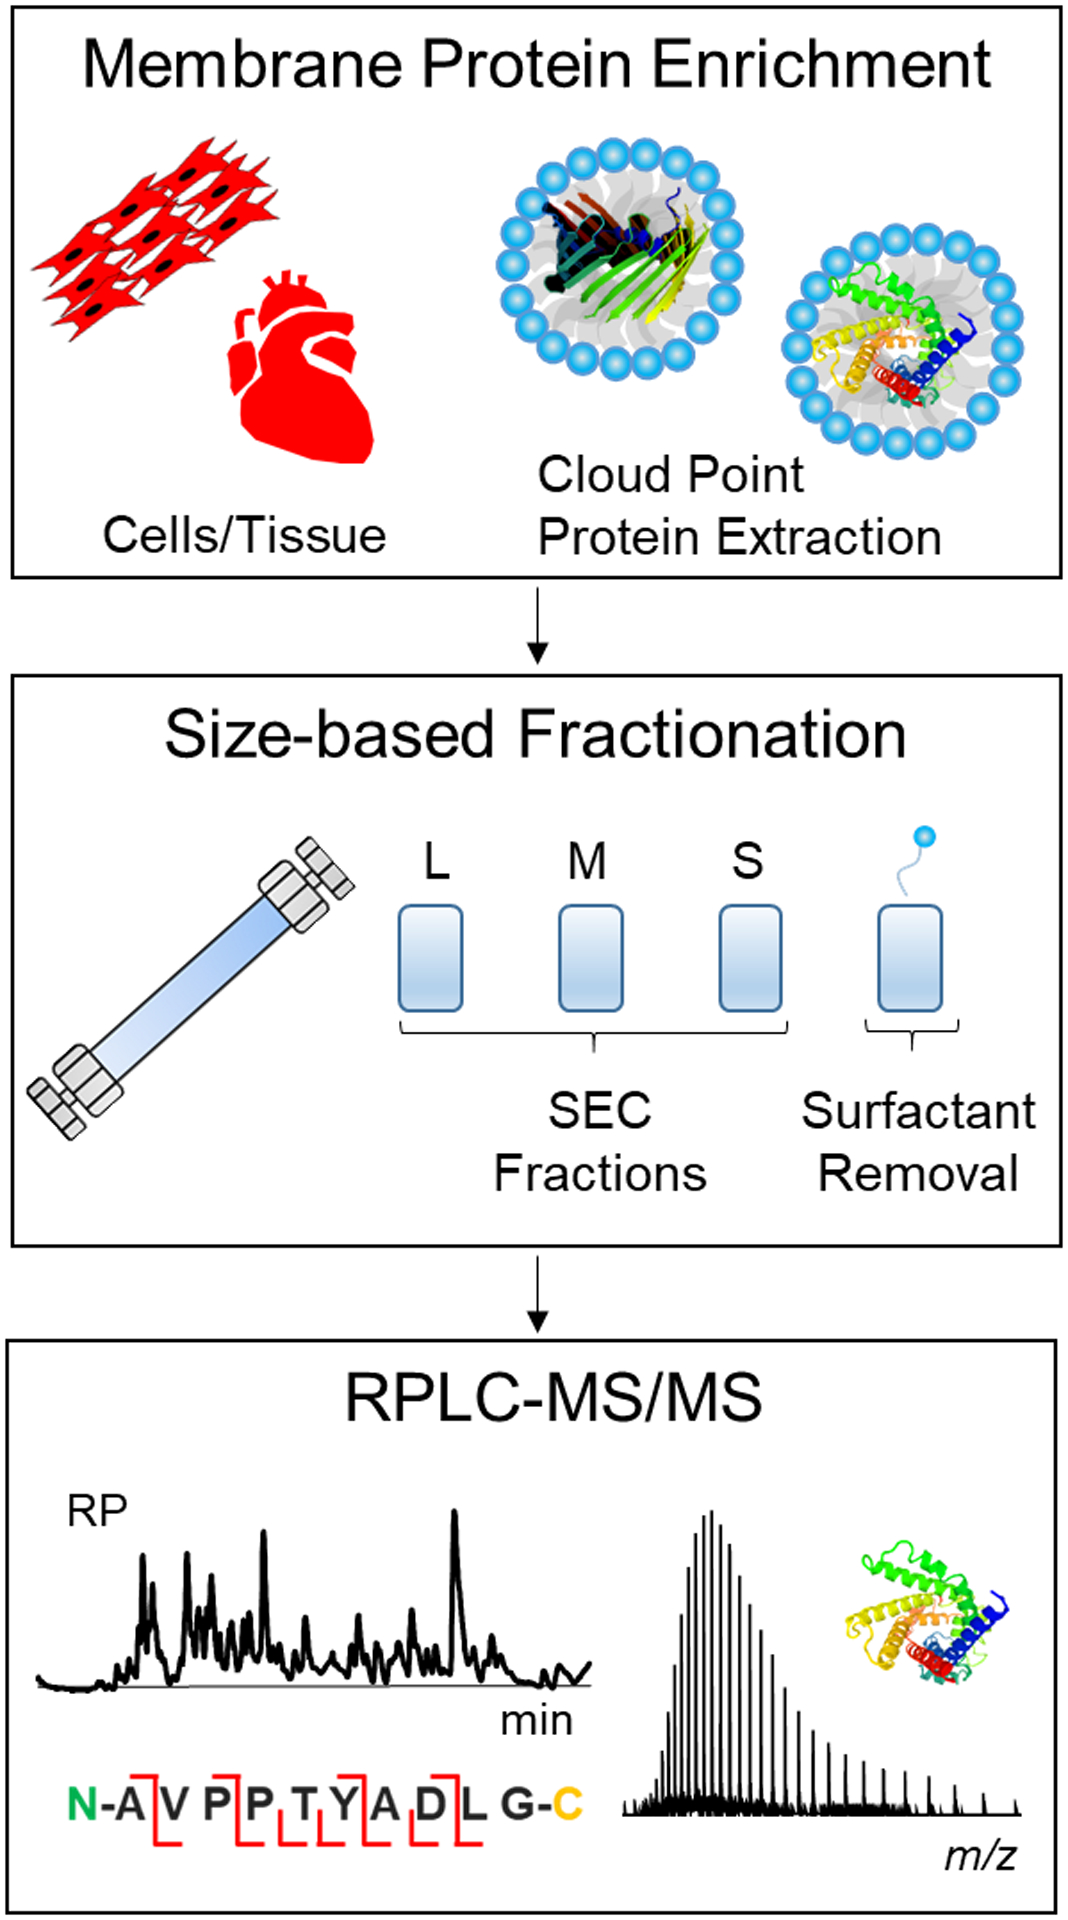
An integrated approach for top-down MS characterization of endogenous membrane proteins. A cloud point extraction procedure is performed using Triton X-114 or Tergitol NP-7 to extract and enrich endogenous membrane proteins from cells or tissues. Next, an SEC separation is performed for removal of detergent and protein fractionation. Finally, reversed-phase liquid chromatography-tandem mass spectrometry (RPLC-MS/MS) is used to obtain sequence information for protein identification.
Experimental Section
Chemicals and Materials.
All chemicals and reagents were purchased from MilliporeSigma Inc. (St Louis, MO, USA) unless noted otherwise. HPLC grade water, isopropanol, formic acid, and acetonitrile (ACN) were obtained from Fisher Scientific (Fair Lawn, NJ, USA). Acrylamide gels were made in-house using acylamide/bis-acylamide (37:5:1) solution from Hoefer (Holliston, MA, USA). Halt protease/phosphatase inhibitor cocktail, tris(2-carboxyethyl)phosphine (TCEP), bicinchoninic acid (BCA) reagent, RIPA buffer, Fetal Bovine Serum (FBS), Dulbecco’s Modified Eagle’s Medium (DMEM), phosphate-buffered saline (PBS), and Penicillin/Streptomycin were obtained from ThermoFisher Scientific (Waltham, MA, USA). Tergitol NP-7 was purchased from Spectrum Chemical (New Brunswick, NJ, USA). All solutions were prepared using HPLC grade water. PolyHYDROXYETHYL A columns were provided by PolyLC (Columbia, MD, USA). PLRP material was purchased from Agilent (Santa Clara, CA, USA) and was packed into capillaries of PEEK tubing from VICI (Houston, TX).
Cloud Point Protein Extraction.
Human embryonic kidney cells (HEK) 293T cells (ATCC, Manassas, VA) were cultured on 10 cm plates (~90% confluent) using 10 % FBS and 1x Penicillin-Streptomycin at 37 °C with 5% CO2. Plates were washed and harvested with PBS, pelleted using centrifugation at 500 × g, flash-frozen, and stored at −80 °C.
Myocardium (left and right ventricle) was obtained from non-failing hearts from brain-dead donors with no history of heart diseases but unsuitable for a heart transplant in the University of Wisconsin Hospital and Clinics and maintained in cardioplegic solution before dissection. The tissue was immediately snap-frozen in liquid nitrogen and stored at −80 °C as described previously.32,33 All procedures were approved by the University of Wisconsin-Madison Institutional Review Board. Swine hearts were collected from the University of Wisconsin-Madison meat science laboratory and flash-frozen immediately in liquid nitrogen and stored at −80 °C.
One 10-cm plate of HEK293T cells was lysed in 0.8 mL of buffer (25 mM ammonium bicarbonate, 0.5 M NaF, 10 mM methionine, 2 mM TCEP, 1 mM PMSF, and 1x Halt protease/phosphatase cocktail) using a 27 gauge needle (10x). 0.2 mL of either Triton X-114 (Protein Grade) or Tergitol NP-7 was added and the solution was gently shaken at 4 °C for 20–60 min. After briefly clearing the sample using centrifugation (15,000 × g, 4 °C), the supernatant was removed and incubated at 37 °C for 3 min, resulting in a cloudy bottom layer and a clear top layer. The sample was centrifuged (3,000 × g, RT) for 2 min and the top layer was discarded. Similarly, ~50 mg of cardiac tissue was homogenized with a Polytron electric homogenizer, model PRO200 (Pro Scientific, Oxford, CT, USA) in 0.8 mL of buffer. Triton X-114 was added and the cloud point procedure was performed. 0.8 mL of fresh buffer was added to the bottom layer and the cloud point procedure performed again to further deplete hydrophilic proteins. Alternatively, cells were lysed with RIPA buffer supplemented with 1x Halt protease/phosphatase cocktail to generate a whole cell lysate. The cloud point and RIPA buffer samples were then processed identically.
The proteins were precipitated using the chloroform:methanol:water method34 to remove the surfactant. The protein pellet was dissolved in 50 μL cold formic acid (80%)35 supplemented with methionine (20 mM). The sample was briefly sonicated in a water bath to solubilize the pellet and diluted with 50 μL of isopropanol and 25 μL of water on ice. The protein concentration (~2–3 μg/μL) was determined using BCA protein assay with bovine serum albumin (BSA) as a standard. Recovery of protein after precipitation was determined to be 98% ± 3%, which corresponds well with previous studies.35
Size-exclusion Chromatography.
SEC separation was performed using a 200 × 4.6 mm, 3 μm, 1000 Å PolyHYDROXYETHYL A column on a Waters (Milford, MA, USA) ACYUITY H-Class HPLC with a mobile phase of 40% isopropanol and 1% formic acid. The flow rate was set to 0.15 mL/min (pressure ~1500 psi) and the column was conditioned with two to four blank injections. 5 μg of BSA and ubiquitin (Ubi) from bovine erythrocytes were used as standards to ensure reproducibility. The elution was monitored by absorption at 280 nm. Next, 50 μL (~150 μg) of the sample was injected and four fractions were collected (8.5–11 min, 11–12 min, 12–13 min, and 13–15 min). Two collections were pooled and samples were concentrated using an Amicon 10 kDa molecular weight cutoff filter (EMD Millipore, Danvers, MA, USA). One volume of water was added and the fractions were concentrated to a final volume of ~60 μL (the final solvent consisted of approximately 79.5% water, 20% isopropanol, and 0.5% formic acid). Alternatively, SEC separation was performed using a 200 × 9.4 mm, 3 μm, 1000 Å PolyHYDROXYETHYL A column using a flow rate of 0.500 mL/min (~3,000 psi). 120 μL (~360 μg) of the sample was injected and eight fractions were collected using 1-minute intervals.
For SDS-PAGE analysis, 16 μL of the sample was dried via speed-vac and dissolved in 1x SDS loading buffer. The sample was loaded onto a 10% polyacrylamide gel (1 mm) and separated at 150 V for ~ 80 min. The gel was stained with Coomassie blue for visualization.
Reverse-phase Chromatography and Top-down Analysis.
10 μL of each fraction was injected on a home-packed PLRP capillary (250 × 0.250 mm, 5 μm, 1000 Å) heated to 50 °C. The separation was performed with a mobile phase of water + 0.2% formic acid (A) and acetonitrile: isopropanol (1:1) + 0.2% formic acid (B) using a flow rate of 5 μL/min on a Waters nanoAcquity HPLC (M-Class). The gradient was varied to optimize separation and identify new proteoforms. The following conditions provided effective separation as demonstrated by Figure 3 and Figure S6: 0–5 min 20% B, 5–65 min 20–95% B, 65–70 min 95% B, 70–71 min 95%−20% B. Proteins eluting were infused into a maXis II ETD Q-TOF (Bruker Daltonics) via electrospray ionization with a capillary voltage of 4500 V and an endplate offset of 500 V. MS1 scans were collected at 1 Hz and the top 3 most intense ions were selected for collision-induced dissociation (CID) at 2–4 Hz (intensity 2000–20000) scan rate, and a collisional energy scaled by the m/z and charge (Table S1). Ions were excluded after 4 scans.
Figure 3.
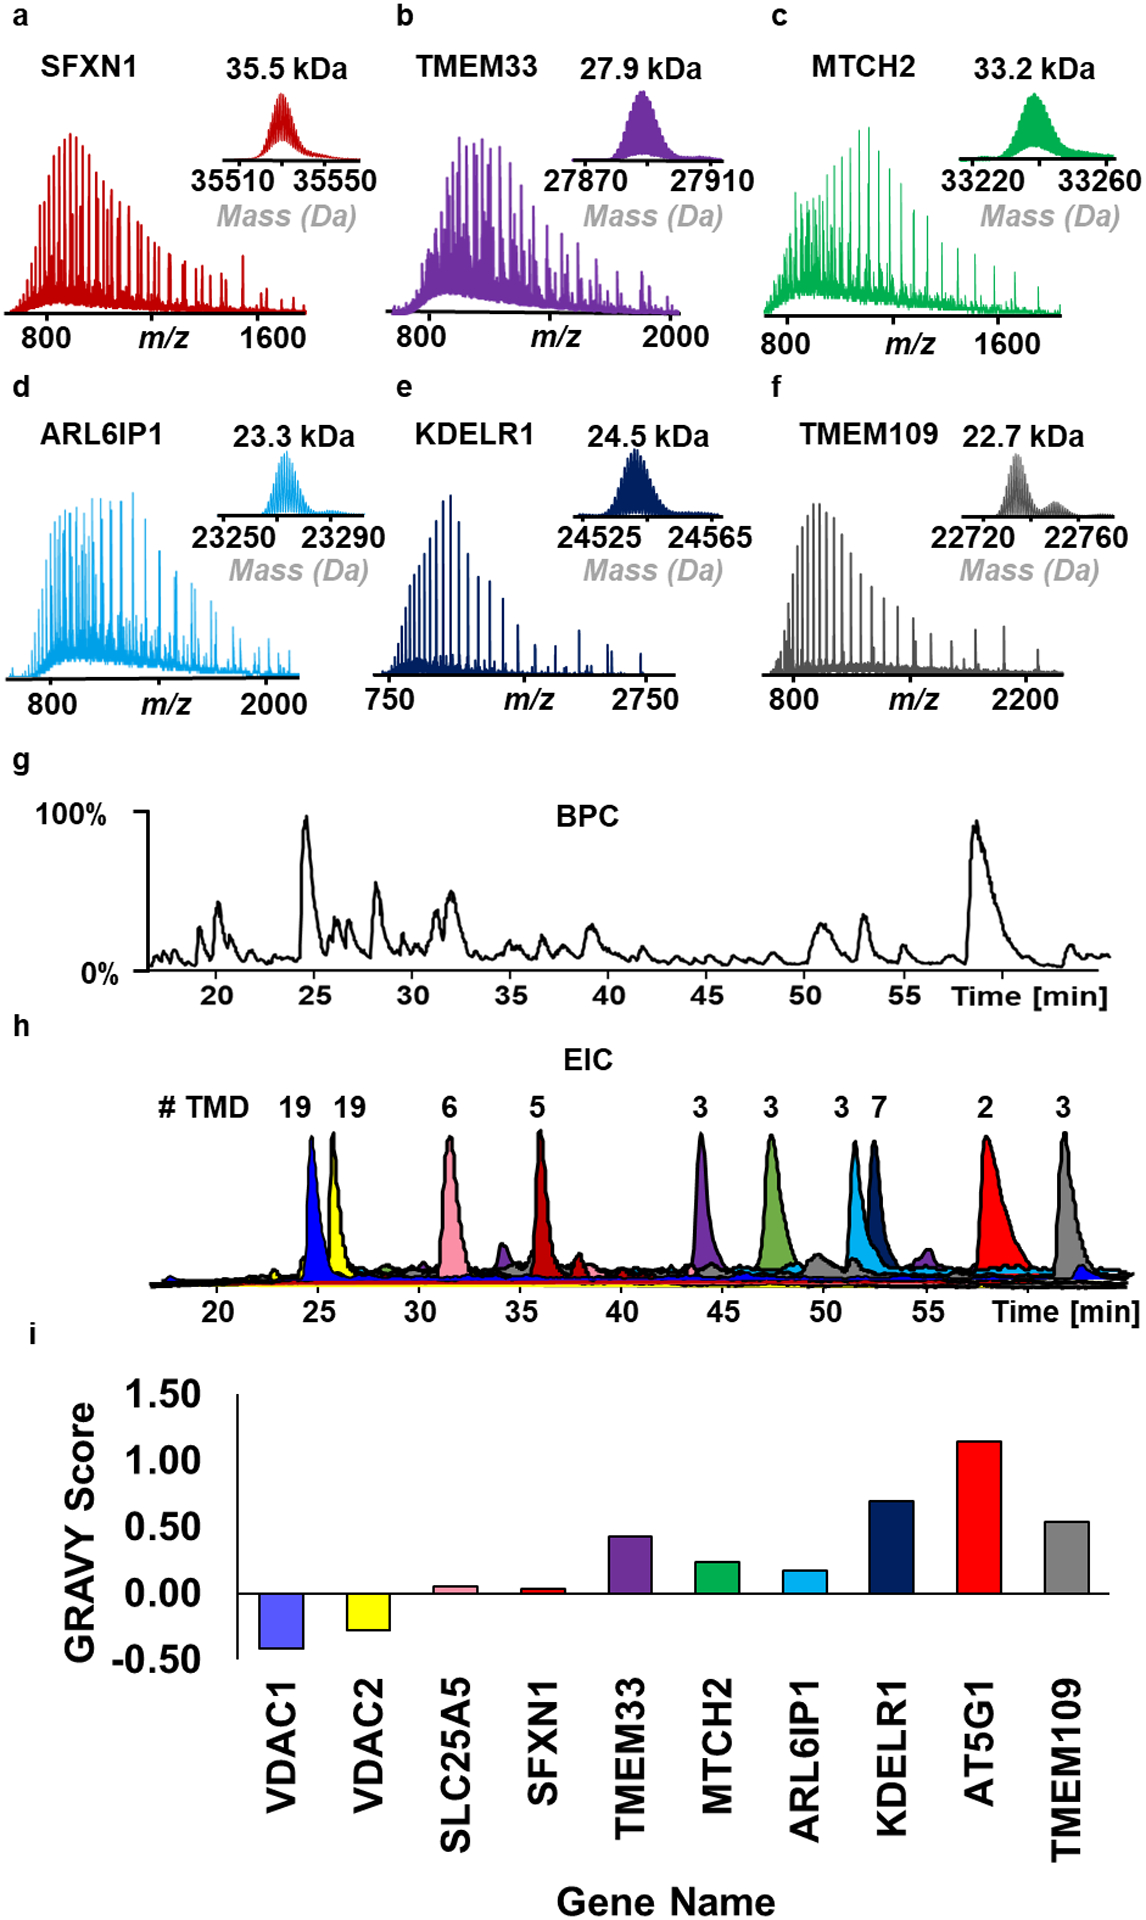
RPLC-MS analysis of enriched integral membrane proteins from HEK293T cells. (a-f) Representative charge state distributions and deconvoluted mass spectra from SEC fraction 3. Proteins include sideroflexin-1 (SFXN1), transmembrane protein 33 (TMEM33), mitochondrial carrier homolog 2 (MTCH2), ADP ribosylation factor like GTPase 6 interacting protein 1 (ARL6IP1), ER lumen protein-retaining receptor 1 (KDELR1), and transmembrane protein 109 (TMEM109). (g) Base peak chromatography (BPC) demonstrating effective membrane protein separation using PLRP stationary phase. (h) Extracted ion chromatograms (EIC) were generated to further demonstrate their effective separation using PLRP material. The number of transmembrane domains (#TMD) ranged from 2–19. Peak heights are not representative of protein MS signal intensity. (i) GRAVY score of representative proteins (indicated by gene name) in order of elution. Proteins with lower scores generally eluted earlier while proteins with higher scores eluted later.
Data Analysis.
DataAnalysis 4.3 (Bruker Daltonics) was used to analyze the raw MS spectra. For protein identification, a msalign file was created using the Sophisticated Numerical Annotation Procedure (SNAP) peak-picking algorithm with the following parameters: quality factor (0.4); signal-to-noise ratio (S/N) (3); intensity threshold (500); and a retention window (1.5 min) as described previously.22 A compiled list of precursor mass-to-charge, precursor charge, and precursor mass followed by the fragment mass-to-charge, intensities, and charges were used to perform protein spectral matching searching against the Homo sapiens reviewed Uniprot36 database (released on 2 July 2018) or the Sus scrofa Uniprot36 database (released on 22 November 2017) using TopPIC (1.1.2)37. The fragment mass tolerance was set to 15 ppm, a satisfactory number of assigned fragment ions (>6) was required, and the false discovery rate was set to 1%. Sequence mass determination and validation and fragmentation mapping were performed using MASH Suite Pro38. The proteoform mass distribution was determined using the following approach similarly as described previously22,32: (1) LC-MS scans were averaged every minute; (2) deconvoluted using maximum entropy algorithm (resolution: 10,000; mass range: 5,000–150,000 Da); (3) mass list outputs were generated using Sum peak (S/N: 5 and absolute intensity >50,000). String analysis was performed using STRINGv11 online software using the highest confidence setting.39 A gene list was imported into Panther software (http://www.pantherdb.org/)40 for gene ontology analysis. The prediction of transmembrane domains was performed using TMHMM Server v. 2.0 (http://www.cbs.dtu.dk/services/TMHMM/)41 and Uniprot36. Prediction of subcellular localization was done using iLoc-Animal42 (http://www.jci-bioinfo.cn/iLoc-Animal). The proteomics data have been deposited to the ProteomeXchange Consortium via the PRIDE43 partner repository with the dataset identifier PXD019368. The proteomics results are summarized in Table S2–3.
Results and Discussion
Cloud Point Enrichment of Endogenous Membrane Proteins.
Effective extraction and enrichment of endogenous membrane proteins were accomplished with a cloud point extraction to provide a phase separation of integral membrane proteins. Here, cells or tissues were lysed in a cold (4 °C) nonionic surfactant, Triton X-114 or Tergitol NP-7,27 to extract and solubilize proteins. After a brief centrifugation step to remove insoluble material, the samples were brought to 37 °C, to rapidly induce phase separation with a surfactant-rich lower layer and an aqueous upper layer (see a photograph in Figure S1a). The temperature at which the phases start to separate and the mixture becomes cloudy is the “cloud point” of a nonionic surfactant (e.g. the cloud point temperature of Triton X-114 and Tergitol NP-7 is 23–26 °C). Significantly, hydrophobic membrane proteins were sequestered in the surfactant-rich layer due to their interaction with the surfactant. Conversely, the soluble proteins remained exclusively in the top aqueous layer and could be removed easily (Figure 1a).24 Overall, the cloud point extraction procedure takes as little as 30 minutes to complete using commercially available reagents and a standard benchtop centrifuge. Importantly, because Triton X-114 and Tergitol NP-7 surfactants are generally incompatible with MS analysis,22,28 the bulk of the nonionic surfactant was then removed by protein precipitation.34 The resulting protein pellet was rapidly resolubilized in cold formic acid16,35 and quickly diluted with a mixture of isopropanol and water for downstream analysis (Figure S1b). The recovery was found to be recovery 98% ± 3% (n=3 extractions) as determined by BCA protein assay, which is consistent with previous reports.35 Notably, the throughput of the cloud point enrichment is a major improvement over traditional membrane protein enrichment strategies that use multiple extractions or organelle purification that can take a day and often require specialized ultracentrifuges capable of speeds >100,000 × g.44–47
Figure 1.
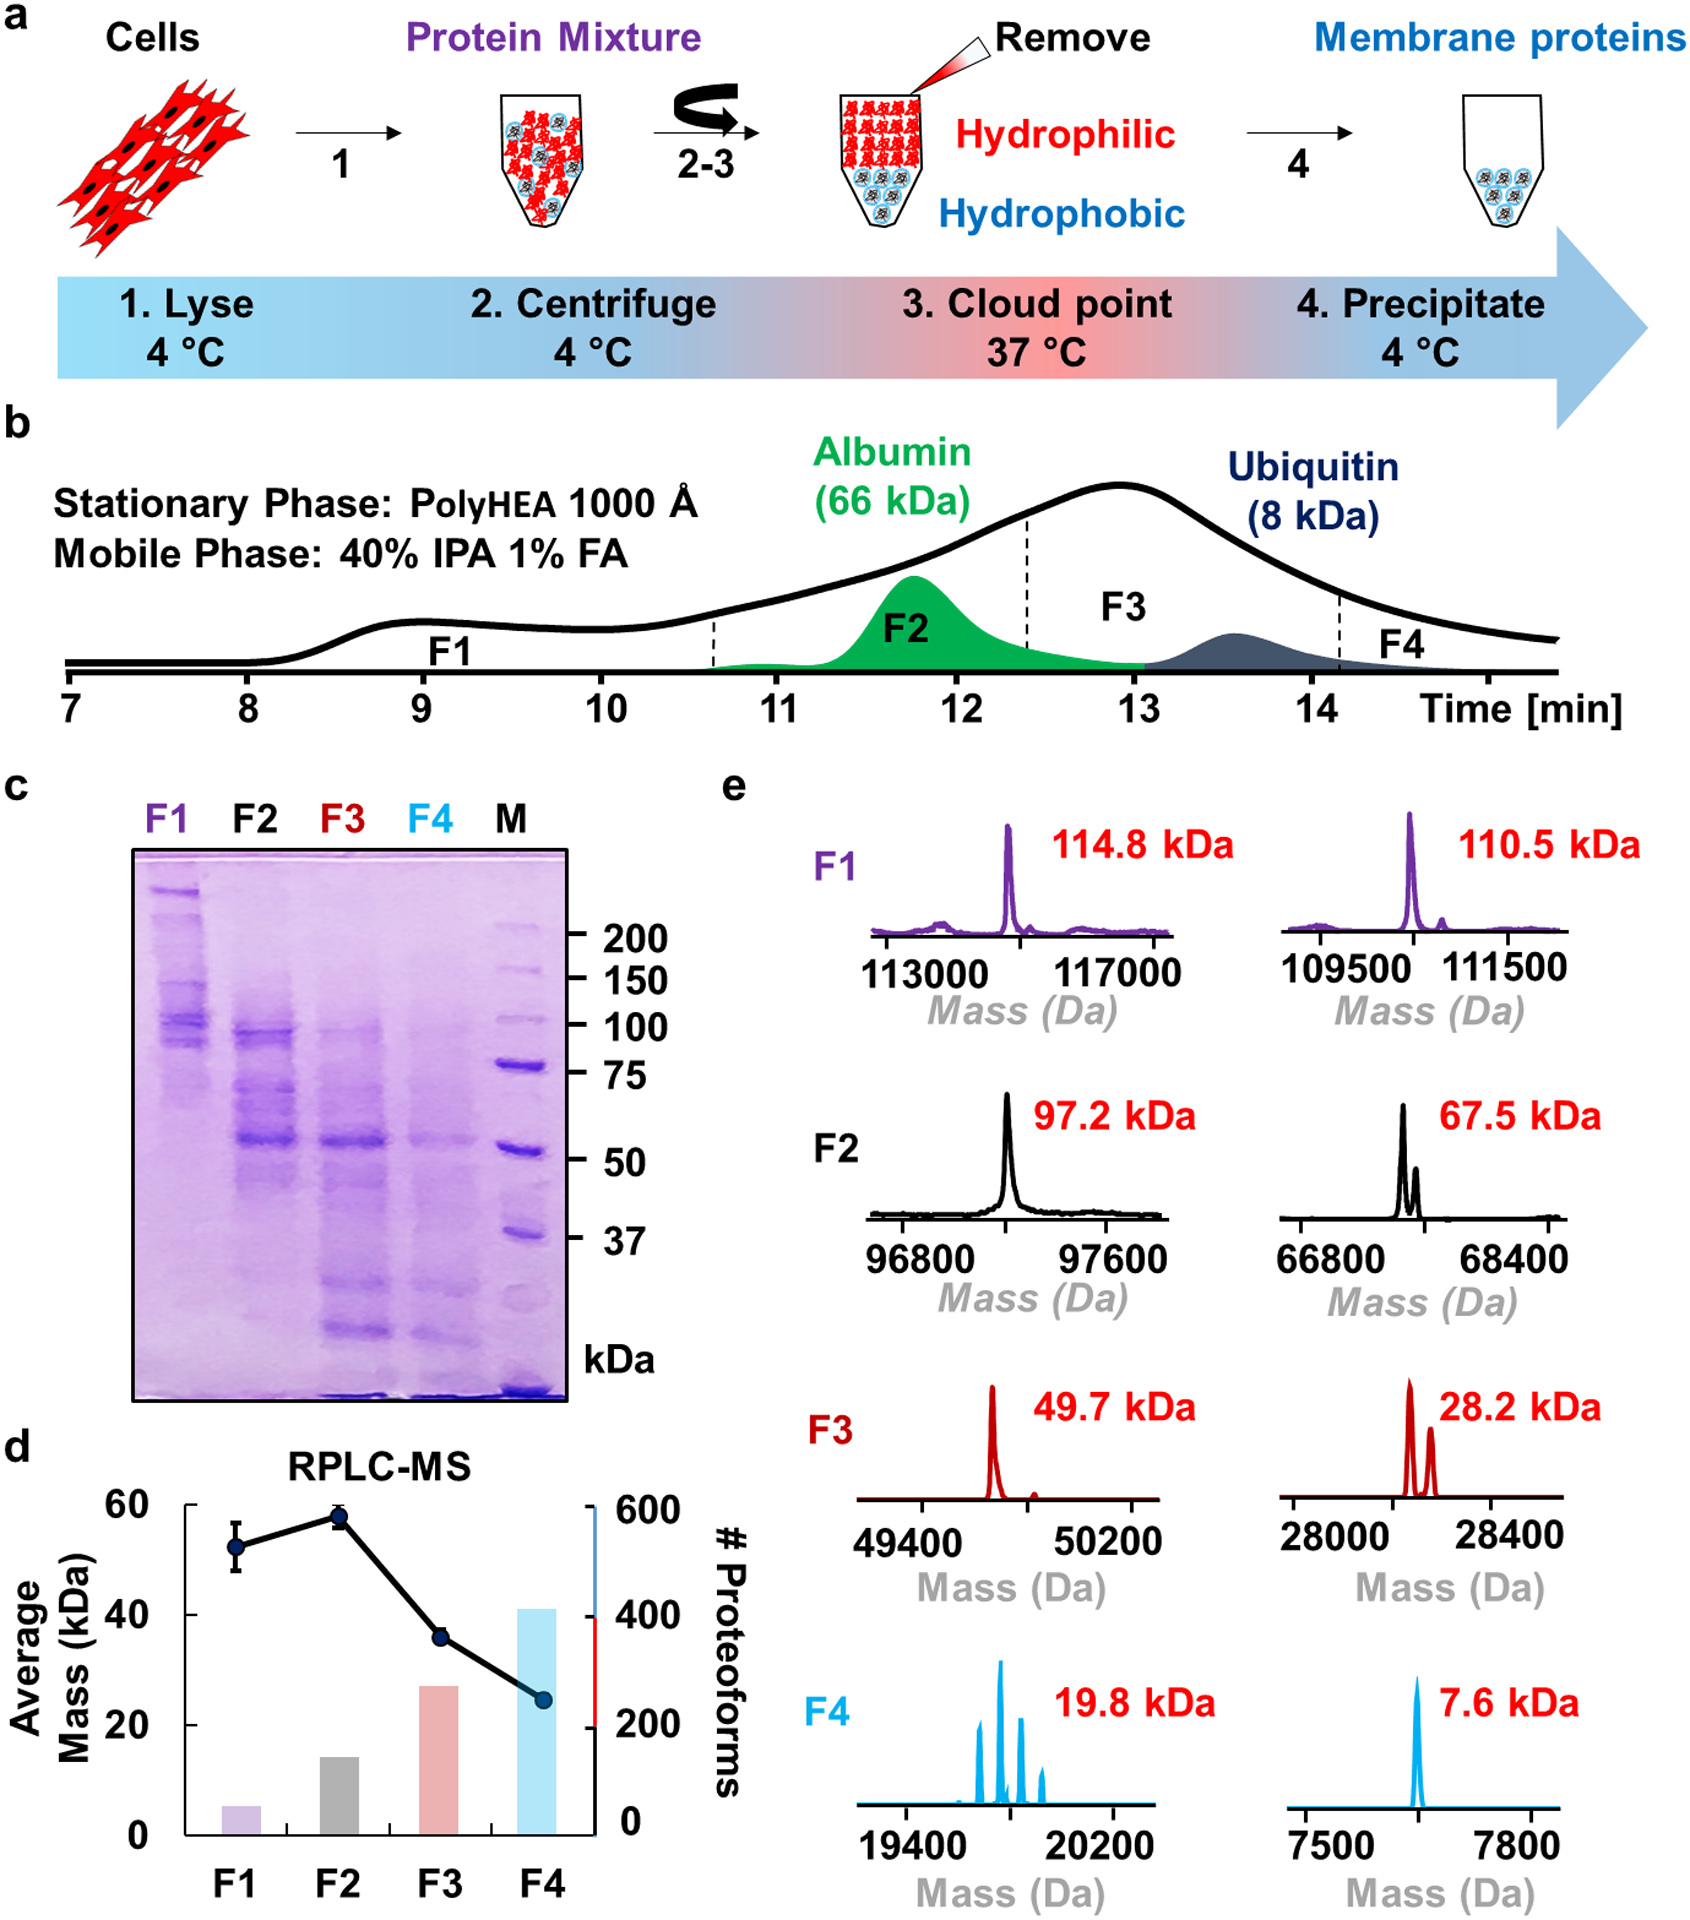
Cloud point extraction process flow and SEC fractionation of endogenous membrane proteins from HEK293T cells. (a) Illustration of the cloud point extraction for the enrichment of membrane proteins. (b) A representative chromatogram of membrane proteins separated by SEC with albumin (66 kDa) and ubiquitin (8 kDa) serving as elution reference standards. SEC was performed using a 1000Å PolyHYDROXYETHYL A (PolyHEA) column and a hydrophobic mobile phase consisting of 40% isopropanol (IPA) and 1% formic acid (FA). (c) SDS-PAGE analysis with coomassie blue visualization of SEC fractions 1–4 (F1, F2, F3, F4). (d) RPLC-MS analysis of SEC fractions. The average proteoform mass (error bars represent standard error of the mean) and the number of proteoforms detected were plotted for each fraction. (e) Representative deconvoluted (low resolution, maximum entropy)48 mass spectra from each fraction.
SEC Fractionation of Intact Membrane Proteins.
After membrane protein enrichment, pre-fractionation is critical for increasing the proteome coverage. Previously, we used a single dimension of chromatography, which was insufficient for deep proteome coverage, particularly for larger proteins (>50 kDa),22 because co-elution of small proteins causes signal suppression of large proteins. Thus, size-based fractionation is often required to access proteins >30 kDa by top-down MS.32,49,50 Furthermore, despite protein precipitation at the end of the cloud point extraction process, because the residual surfactant contamination suppressed protein signal28 the direct analysis of the membrane-enriched sample by LC-MS was not feasible (Figure S2). This is conceivably why the cloud point extraction has not yet been used for top-down MS. Therefore, to increase proteoform detection (particularly high-molecular-weight species) and remove the residual surfactant, we further developed a membrane protein-compatible SEC fractionation strategy.
Previously, the advantage of MS-compatible SEC fractionation to improve the detection of intact soluble proteoforms up to 223 kDa from human heart tissue lysate has been demonstrated.32,50 Here, we utilized an SEC column with a neutral, polar stationary phase (PolyHYDROXYETHYL A), a 1000 Å matrix pore size, and a highly MS-compatible mobile phase, 59% water, 40% isopropanol, 1% formic acid, for SEC fractionation (Figure 1b). Previously, 1% formic acid was used as a mobile phase for fractionation of acid-soluble and water-soluble proteins;32,50 but was insufficient for maintaining membrane protein solubility. However, we found incorporating isopropanol, a more hydrophobic solvent, facilitated membrane protein solubility in the absence of surfactants. We observed effective size-based fractionation of endogenous membrane proteins as confirmed by SDS-polyacrylamide gel electrophoresis (SDS-PAGE) visualized with coomassie blue (Figure 1c and Figure S3). Moreover, small molecule contaminations (e.g., surfactants) were fully removed by SEC, eluting at the end of the run. SEC was highly orthogonal with regards to downstream RPLC-MS analysis.
Next, we tested the effect of increasing the column inner diameter (i.d.) to 9.4 mm to improve fractionation resolution (presumably by decreasing the wall effect and utilizing a flow rate that better matched to the capabilities of most HPLC system).30 We found an improvement in separation (Figure S4–S5); however, the resulting number of protein identifications from a single analysis were similar (103 IDs for each) for both column diameters (Table S2). While SEC separation is not as high resolution as gel-based techniques, improved resolution has been demonstrated by a serial SEC strategy connecting multiple SEC columns with various pore sizes;32 however, the sensitivity and throughput of sSEC are generally lower. Future work, therefore, will focus on further optimizing the SEC (or sSEC) separation to balance the sensitivity, separation, and throughput. Overall, we found the SEC approach was highly orthogonal to downstream RPLC-MS/MS analysis and significantly reduced the separation time (20–40 min) compared to other size-based separation techniques like GELFrEE (1.5–2 h for fractionation based on the manufacturer’s protocol).49
SEC-RPLC for MS Analysis of a Complex Mixture of Intact Proteins.
Next, the SEC fractions were further separated by RPLC coupled with high-resolution MS. High-molecular-weight proteins were detected in the early fractions whereas low-molecular-weight species were found in the later fractions, consistent with SEC fractionation (Figure 1d,e). Fewer proteoforms were detected in the earlier high-molecular-weight fraction (Figure 1d), which can be accounted for by the decreased signal-to-noise ratio (S/N) of large proteins making them more difficult to detect.51 Despite this challenge, we did detect several large proteoforms, including species >100 kDa, demonstrating the promise of this technology for high-molecular-weight proteoform characterization (Figure 1e and Figure 2).
Figure 2.
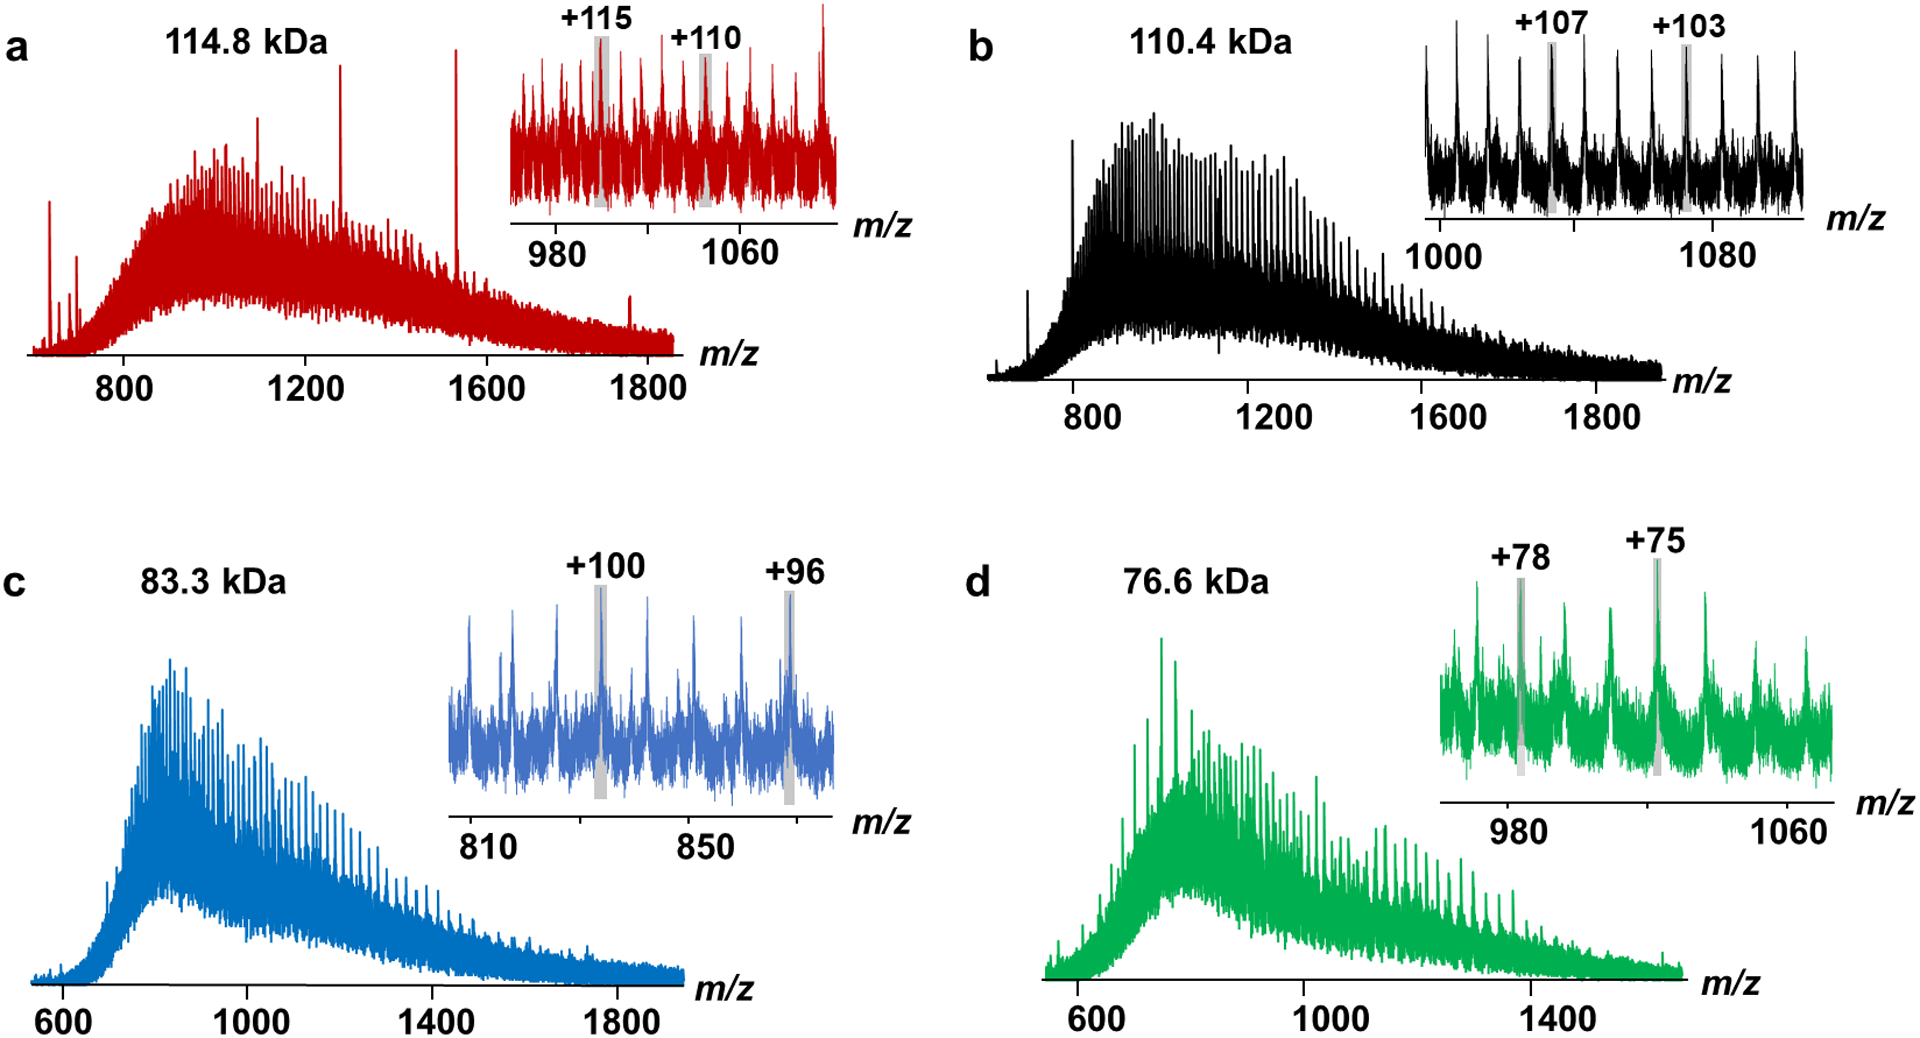
(a-d) Charge state distributions and deconvoluted mass spectra of representative high-molecular-weight proteins detected by RPLC-MS/MS from SEC fraction 1 using HEK293T cells.
Top-down Characterization of Endogenous Membrane Proteoforms Enabled by SEC-RPLC-MS/MS.
With the establishment of a robust SEC-RPLC-MS method, we compared the performance of two common surfactants, Triton X-114 and Tergitol NP-7 (also known as Igepal), which undergo a phase separation at room temperature in water.27 We performed the cloud point extraction with either Triton X-114 or Tergitol NP-7 using human embryonic kidney (HEK) 293T cells, SEC fractionation (Figure S3), and a single RPLC-MS/MS analysis of the two low-molecular-weight fractions (3 and 4), we identified 176 proteins using Triton X-114 versus 138 proteins using Tergitol NP-7 (215 total unique proteins) with a 1% false discovery rate (Figure S6a,b). Using UniProt52 to manually annotate the identifications, we found that 152 (70%) were membrane proteins and 116 (54%) were integral membrane proteins (containing at least 1 transmembrane domain [TMD]), demonstrating effective enrichment of membrane proteins. Next, we performed gene ontology analysis40 based on molecular function and found many proteins involved in binding, catalytic activity, transporter activity, or structural functions, which are characteristics of membrane proteins (Figure S6c).
Generally, we observed that online RPLC using polymeric reversed-phase (PLRP) material16,17 was compatible with the separation of endogenous integral membrane proteins, permitting online characterizations of such proteins with transmembrane domains ranging from 2–19 (Figure 3a–i and Figure S7). Interestingly, we found that the GRAVY score (the measure of a protein’s hydrophobicity based on the amino acid sequence)53 was a relatively good predictor of protein retention, with those with higher scores (more hydrophobic) eluting later (Figure 3g–i and Figure S7). As GRAVY scores are easily determined, it is plausible to integrate GRAVY score assignment with top-down protein identification in the data analysis process for improved targeted proteomics.53 Additionally, as few integral membrane protein standards are commercially available, this platform is well suited for chromatography development towards the goal of improving membrane protein separation.
Next, we observed quality online MS/MS spectra using collisionally activated dissociation (CAD) allowing for confident identifications using TopPic37 for spectral matching and MASH Suite Pro38 for validation (Table S2–3 and ProteomeExchange43,54 PXD017811). Examples included multi-pass integral membrane proteins such as voltage-dependent anionic channel (VDAC) (Experimental Mr=30664.58 Da, 1.3 ppm error), which plays an important role in small molecule transport into and out of the mitochrondria55 and has 19 TMD, as well as ADP/ATP translocase (Experimental Mr=32784.23 Da, 1.8 ppm error), which contains multiple sites of acetylation and has 6 TMD (Figure 4).
Figure 4.
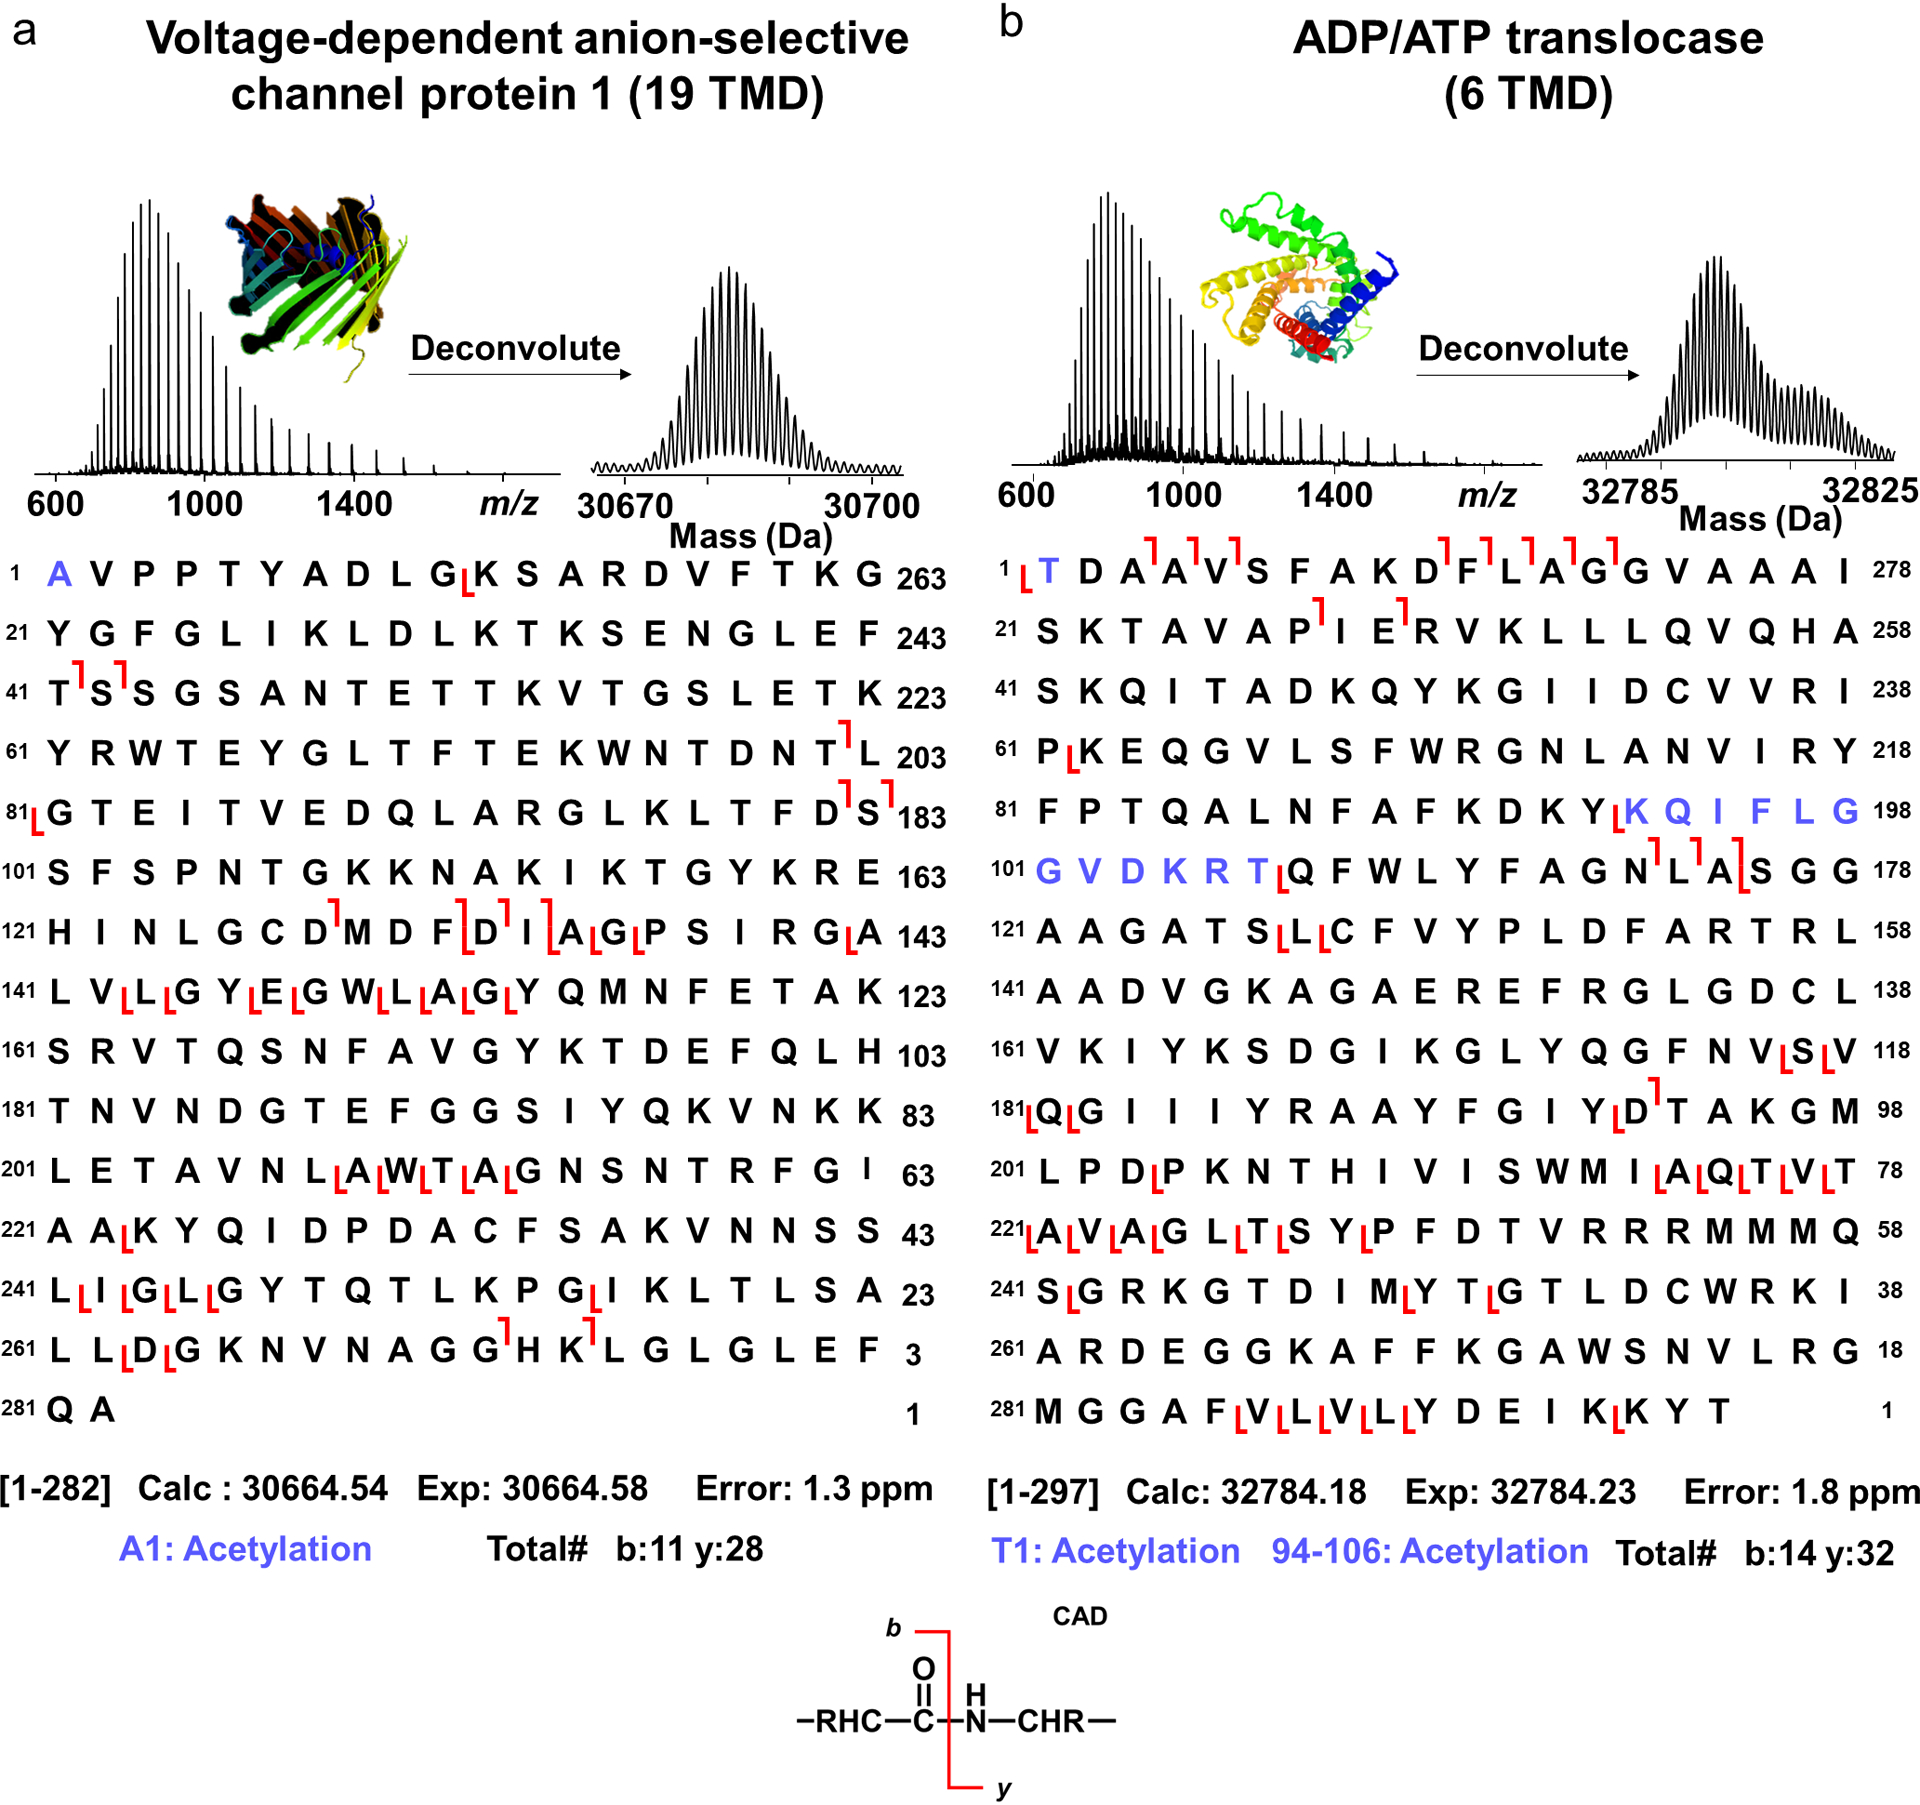
Representative online collisionally activated dissociation (CAD) of multipass integral membrane proteins. (a) Mass spectra of the voltage-dependent anion-selective channel protein 1 (VDAC) with fragmentation map. The protein was identified with 11 b ions and 28 y ions and with a mass accuracy of 1.3 ppm. Acetylation was localized to the N-terminus. (b) Mass spectra and fragmentation map of ADP/ATP translocase identified with 14 b ions and 32 y ions and with a mass accuracy of 1.8 ppm. One acetylation was localized to the N-terminus and the other one localized to residues 94–106. 3D protein structures were generated from the Swiss-Prot repository.56
In addition to integral membrane proteins, we identified membrane-associated and soluble proteins. We reason that the use of a nonionic surfactant2,24 in the extraction buffer preserves protein-protein interactions,57 which can account for the presence of some hydrophilic proteins in the surfactant-rich layer. Examples include subunits of larger membrane protein complexes (Figure 5a) as well as proteins that are known to have biologically relevant interactions58 with hydrophobic membrane proteins, such as tubulins (Figure 5b). Continued development of native separation59,60 could permit this approach to probe protein-protein interactions and protein structure with MS.
Figure 5.
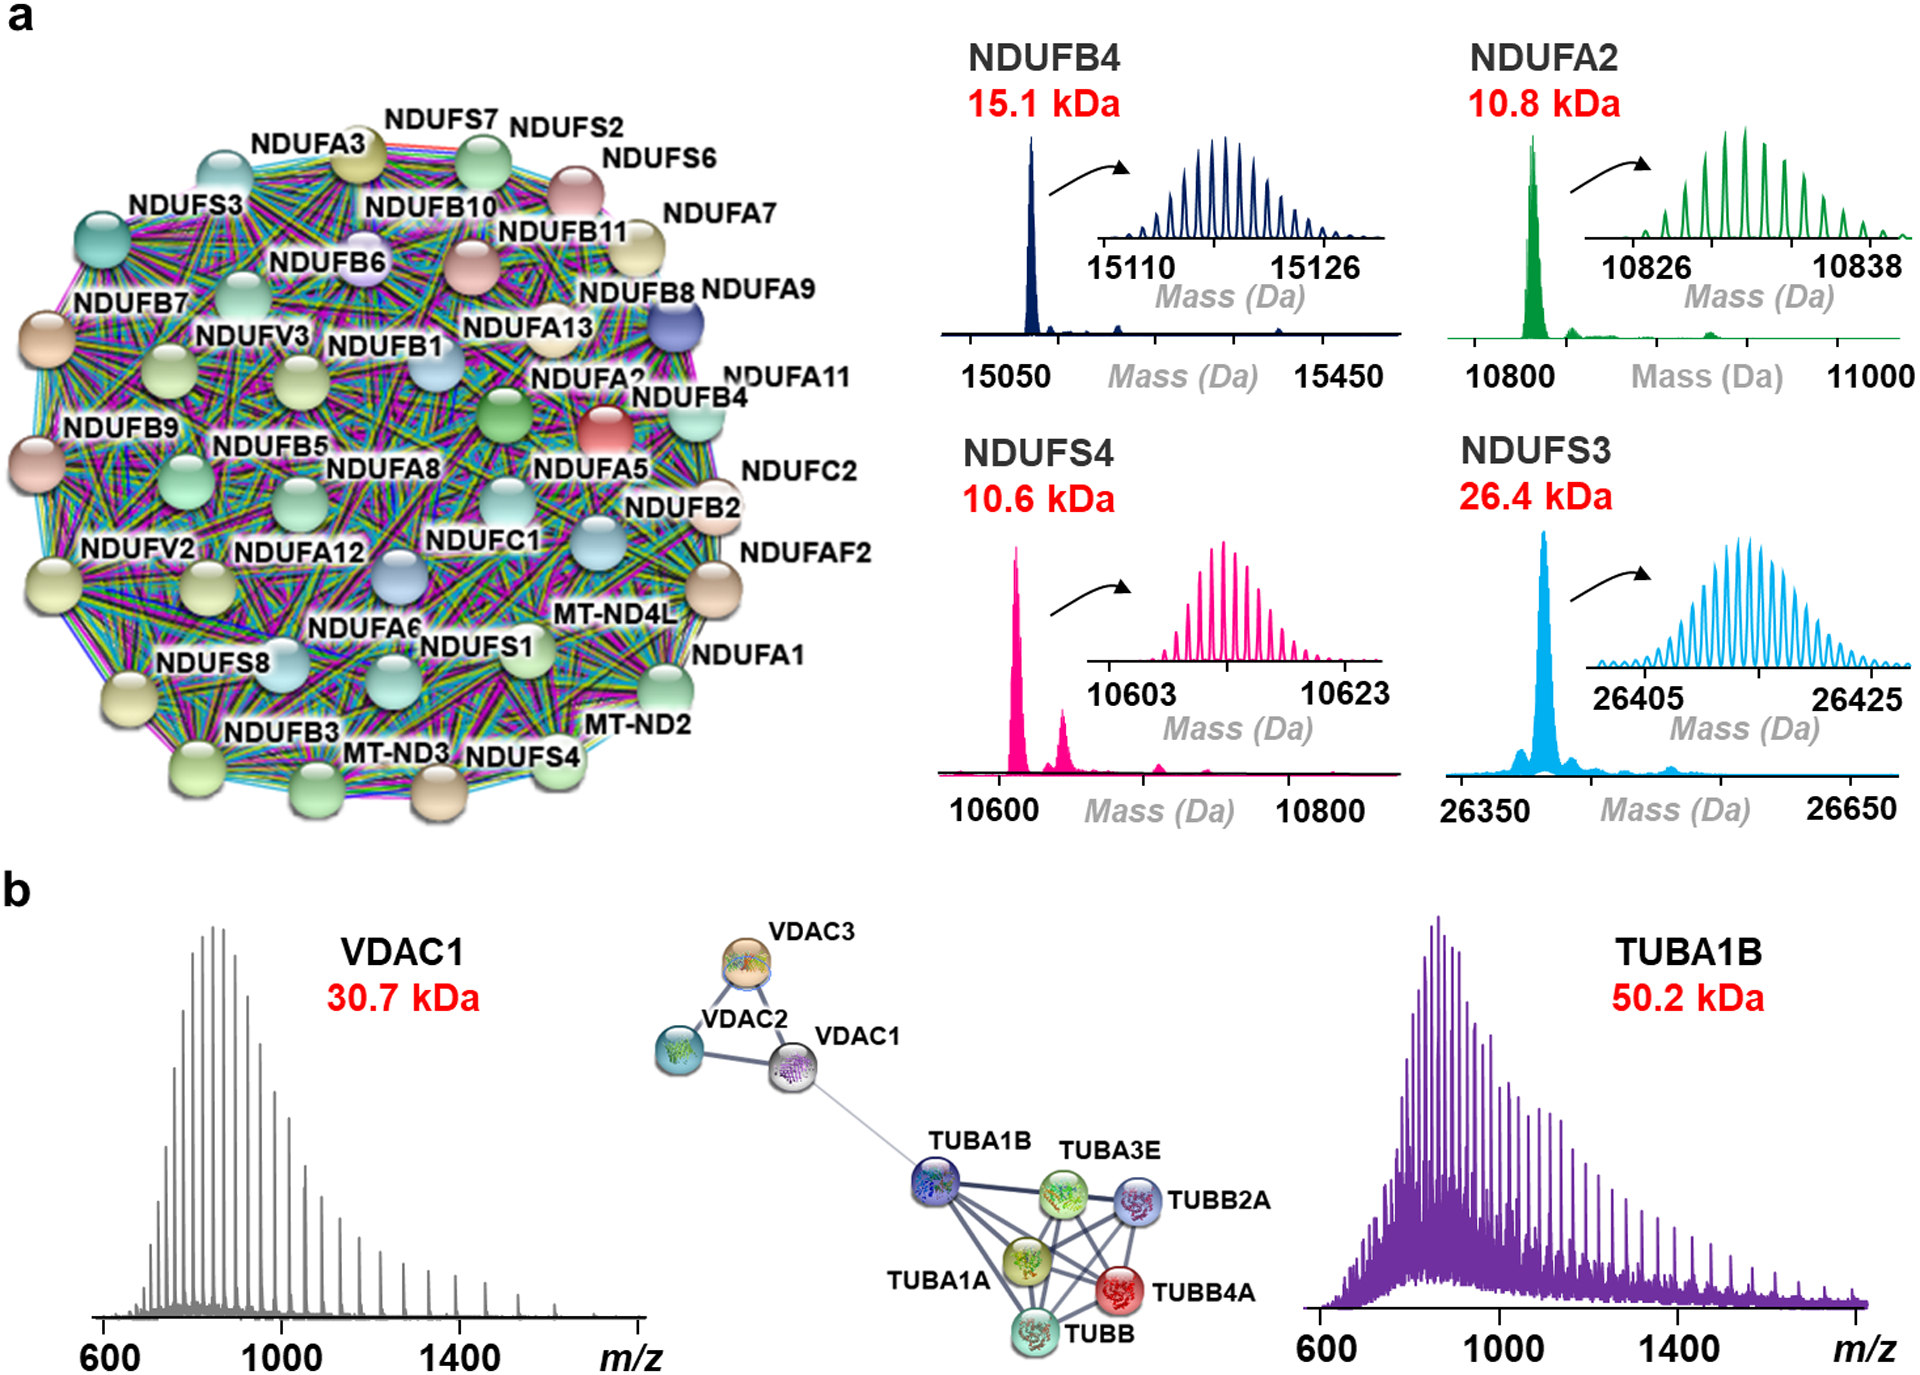
(a) String interactome map39 of proteins belonging to the human NADH dehydrogenase [ubiquinone] complex identified from human cardiac tissue plus representative deconvoluted mass spectra of the protein complex subunits. (b) Mass spectra of voltage-dependent anion channel 1 (VDAC1) and tubulin alpha-1b (TUBA1B) along with a string interactome analysis of all voltage-dependent anion channels (VDAC) and tubulins identified from HEK293T cells. The interaction of VDAC and tubulin represents an ongoing area of neurodegeneration research and demonstrates the potential utility of this approach to probe endogenous interactions.58
To further demonstrate the broad applicability of this approach, we assessed our method using both HEK293T cells and cardiac tissues, identifying a cumulative total of 1688 and 1781 proteoforms (Level 1–3 identification),61 respectively, with a 1% false discovery rate and at least 6 fragments using an error tolerance of 15 ppm (Table S2–3).37 The majority of protein identifications had molecular weights between 20,000–30,000 Da (Figure S8); however, proteins >50,000 could be confidently identified by online LC-MS/MS (Table S2–3). We envision continued development of online fragmentation techniques62,63 and software tools tailored to analyze high-molecular-weight proteins will improve the confident identification of larger proteins whose detection was enabled by the cloud point/SEC/RPLC-MS/MS approach. Thus, future development will focus on improving the sequence coverage and the number of proteoform identifications by applying fragmentation techniques,64,65 with a focus on larger membrane proteoforms which remain challenging to be confidently identified despite quality mass spectra.66
Using TMHMM prediction software,67 we determined that 188 and 124 out of the set of 470 and 310 unique proteins identified were integral membrane proteins (Figure 6). Importantly, 108 and 58 of proteins were multipass-membrane proteins from the two unique protein sets (Figure 6). Analysis using iLoc-animal42 demonstrated a good distribution of protein subcellular locations, with many found in the cell membrane, endoplasmic reticulum, and mitochondrion and with a few proteins from the Golgi apparatus and nucleus.
Figure 6.
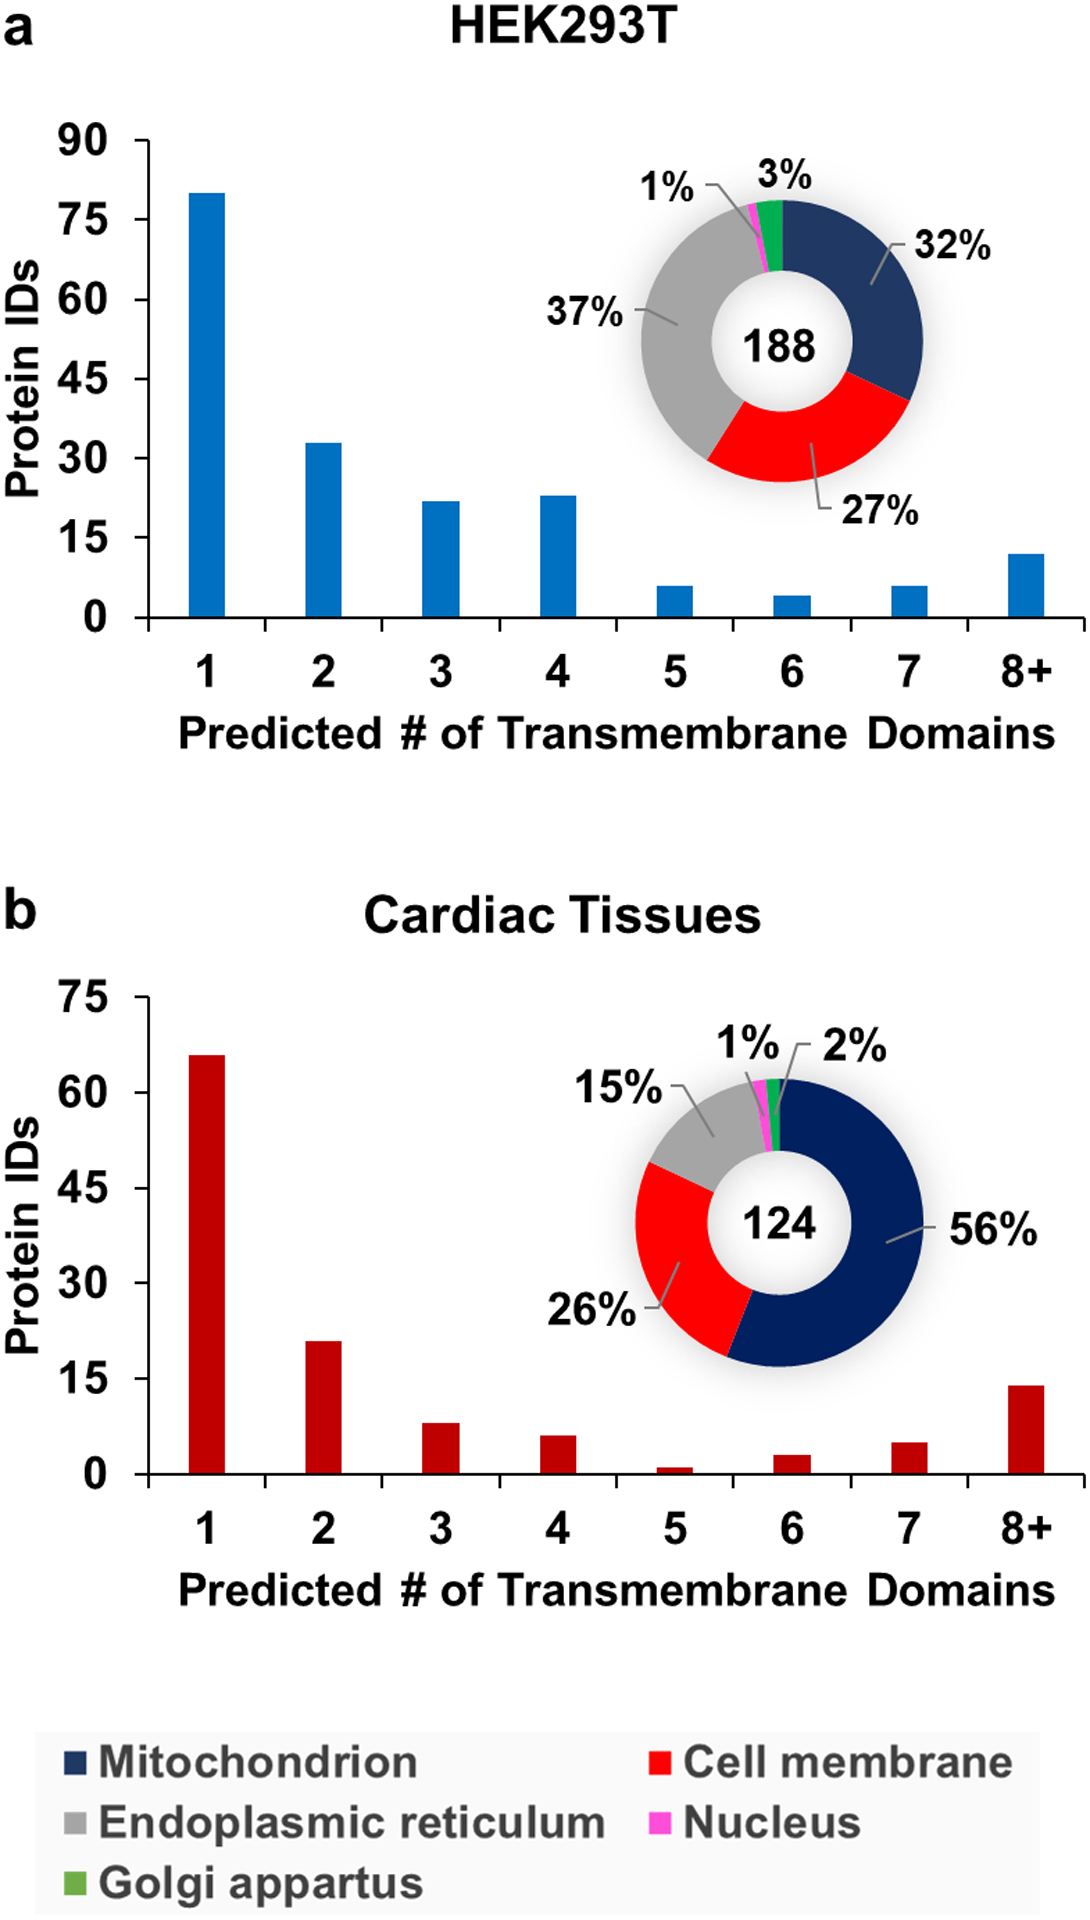
Distribution of the number of transmembrane domains3 and cellular location42 of integral membrane proteins identified from HEK293T cells (a) and cardiac tissues (b).
Finally, we compared the cloud point extraction to the standard RIPA buffer lysis (a detergent cocktail that contains NP-40, deoxycholate, and SDS). After SEC/RPLCMS-MS analysis, we observed a similar number of identified proteins under each extraction condition, but a 4-fold increase in the number of integral membrane protein identified when using the cloud point approach (Figure S9). Additionally, proteins belonging to the mitochondria membrane were enriched when using the cloud point method whereas a greater number of proteins from the cytoplasm where identified in the RIPA extraction (Figure S9c). Additionally, the analysis of three biological replicates using the cloud point extraction demonstrated a significant overlap of protein identifications (Figure S10).
Strength and Weakness of the Cloud Point Extraction Approach for Top-down Membrane Proteomics.
Overall, cloud point extraction with Triton X-114 is a simple and effective method for general membrane protein enrichment. The mild nonionic surfactants (i.e. Triton X-114) show little hydrophobic interaction with water-soluble proteins but selectively interact with hydrophobic membrane proteins.24 Moreover, Triton does not effectively solubilize nuclear,25,68 contractile,69 or extracellular matrix proteins.70 Therefore, the use of Triton X-114 allowed the enrichment of membrane sub-proteome with high specificity. However, a significant drawback of the use of Triton X-114 is the challenge of removing it prior to MS analysis and thus this cloud point extraction approach has not been used for top-down membrane proteomics previously. We observed that precipitation alone could not completely remove the surfactant even after multiple rounds. Here we have shown that SEC is essential for enabling top-down MS after cloud point enrichment, but this requirement could limit the throughput and sensitivity of the method in future applications. In contrast, the use of an MS-compatible surfactant such as Azo, which can be rapidly degraded by irradiation with UV light, enabled high-throughput proteomics.22,23 Furthermore, mild nonionic surfactants do not provide comprehensive protein extraction.22,25 Hence, a more comprehensive proteome extraction can be accomplished by using a strong ionic surfactant (such as Azo)22 after treatment with Triton X-114 (Figure S11). Thus, in some sense, the cloud point extraction approach is complementary to our previously established Azo-enabled top-down proteomics. Combining the cloud point extraction approach with Azo enabled strategies could show even more promise for global proteomic studies by incorporating serial extractions to achieve deep proteome coverage.
Conclusion
In summary, we have developed a simple but effective enrichment and separation strategy for top-down proteomics of endogenous membrane proteins from complex cell and tissue lysates. The cloud point extraction enables effective membrane protein enrichment with a single extraction, including many integral membrane proteins containing as many as 19 transmembrane domains. The subsequent SEC fractionation removes the surfactants from the extraction step and permits the fractionation and detection of proteoforms with molecular weights ranging from 6–115 kDa. Finally, we have demonstrated the effectiveness of online RPLC-MS/MS for membrane protein separation and characterization. We anticipate this simple approach can be widely utilized for membrane protein characterization as an integral part of a generalizable toolset for the development of top-down proteomics methods for endogenous membrane proteins.
Supplementary Material
Acknowledgments
The work was supported by NIH R01 grant GM117058 (to S.J. and Y. G.). Y.G. also would like to acknowledge NIH grants GM125085, and HL096971 and the high-end instrument grant S10OD018475 (to Y.G.). K.A.B. would like to acknowledge support from the Training Program in Translational Cardiovascular Science, T32 HL007936-19. T.T. was supported by the NIH Chemistry-Biology Interface Training Program, T32GM008505. We would like to thank Dr. Yanlong Zhu for his help with the instrument.
Footnotes
Supporting Information
The Supporting Information is available free of charge on the ACS Publications website at
- Step-by-step procedure, visualization of the cloud point extraction (Figure S1), direct LC-MS analysis of proteins from membrane enriched-fraction (Figure S2), SDS-PAGE analysis comparing Tergitol NP-7 and Triton X-114 for membrane protein enrichment (Figure S3), SEC chromatogram comparing membrane proteins separated with a 4.6 and 9.4 mm column (Figure S4), SEC chromatogram and SDS-PAGE analysis of membrane enriched fraction (Figure S5), LC-MS/MS analysis comparing Tergitol NP-7 and Triton X-114 for membrane protein enrichment (Figure S6), RPLC-MS analysis SEC fraction 4 (Triton X-114) from HEK293T cells (Figure S7), histogram of the molecular weights of proteins identified from HEK293T and heart tissues (Figure S8), comparison of cloud point and RIPA buffer extraction of using SEC-RPLC-MS/MS (Figure S9), summary of protein identifications from biological replicates (Figure S10), SDS-PAGE analysis of sequential cloud point-Azo extraction (Figure S11), collisional energy for protein fragmentation (Table S1), summary of HEK293T proteoforms identified using RPLC-MS/MS (Table S2), summary of cardiac proteoforms identified using RPLC-MS/MS (Table S3).
References
- (1).Hauser AS; Attwood MM; Rask-Andersen M; Schioth HB; Gloriam DE Nat Rev Drug Discov 2017, 16, 829–842. [DOI] [PMC free article] [PubMed] [Google Scholar]
- (2).Speers AE; Wu CC Chem Rev 2007, 107, 3687–3714. [DOI] [PubMed] [Google Scholar]
- (3).Krogh A; Larsson B; von Heijne G; Sonnhammer ELL Journal of Molecular Biology 2001, 305, 567–580. [DOI] [PubMed] [Google Scholar]
- (4).Doerr A Nature Methods 2009, 6, 35–35. [Google Scholar]
- (5).Helbig AO; Heck AJ; Slijper M J Proteomics 2010, 73, 868–878. [DOI] [PubMed] [Google Scholar]
- (6).Wu CC; Yates JR 3rd. Nat Biotechnol 2003, 21, 262–267. [DOI] [PubMed] [Google Scholar]
- (7).Smith LM; Kelleher NL; The Consortium for Top Down, P.; Linial M; Goodlett D; Langridge-Smith P; Ah Goo Y; Safford G; Bonilla* L; Kruppa G; Zubarev R; Rontree J; Chamot-Rooke J; Garavelli J; Heck A; Loo J; Penque D; Hornshaw M; Hendrickson C; Pasa-Tolic L, et al. Nature Methods 2013, 10, 186. [DOI] [PMC free article] [PubMed] [Google Scholar]
- (8).Aebersold R; Agar JN; Amster IJ; Baker MS; Bertozzi CR; Boja ES; Costello CE; Cravatt BF; Fenselau C; Garcia BA; Ge Y; Gunawardena J; Hendrickson RC; Hergenrother PJ; Huber CG; Ivanov AR; Jensen ON; Jewett MC; Kelleher NL; Kiessling LL, et al. Nat Chem Biol 2018, 14, 206–214. [DOI] [PMC free article] [PubMed] [Google Scholar]
- (9).Smith LM; Kelleher NL Science 2018, 359, 1106. [DOI] [PMC free article] [PubMed] [Google Scholar]
- (10).Chen B; Brown KA; Lin Z; Ge Y Analytical Chemistry 2018, 90, 110–127. [DOI] [PMC free article] [PubMed] [Google Scholar]
- (11).Cai W; Tucholski TM; Gregorich ZR; Ge Y Expert review of proteomics 2016, 13, 717–730. [DOI] [PMC free article] [PubMed] [Google Scholar]
- (12).Ntai I; Fornelli L; DeHart CJ; Hutton JE; Doubleday PF; LeDuc RD; van Nispen AJ; Fellers RT; Whiteley G; Boja ES; Rodriguez H; Kelleher NL Proceedings of the National Academy of Sciences 2018, 115, 4140. [DOI] [PMC free article] [PubMed] [Google Scholar]
- (13).Ge Y; Rybakova IN; Xu Q; Moss RL Proceedings of the National Academy of Sciences 2009, 106, 12658. [DOI] [PMC free article] [PubMed] [Google Scholar]
- (14).Whitelegge JP; Zhang H; Aguilera R; Taylor RM; Cramer WA Mol Cell Proteomics 2002, 1, 816–827. [DOI] [PubMed] [Google Scholar]
- (15).Kar UK; Simonian M; Whitelegge JP Expert review of proteomics 2017, 14, 715–723. [DOI] [PMC free article] [PubMed] [Google Scholar]
- (16).Whitelegge JP; Gundersen CB; Faull KF Protein Science 1998, 7, 1423–1430. [DOI] [PMC free article] [PubMed] [Google Scholar]
- (17).Catherman AD; Li M; Tran JC; Durbin KR; Compton PD; Early BP; Thomas PM; Kelleher NL Anal Chem 2013, 85, 1880–1888. [DOI] [PMC free article] [PubMed] [Google Scholar]
- (18).Skinner OS; Catherman AD; Early BP; Thomas PM; Compton PD; Kelleher NL Analytical Chemistry 2014, 86, 4627–4634. [DOI] [PMC free article] [PubMed] [Google Scholar]
- (19).Catherman AD; Durbin KR; Ahlf DR; Early BP; Fellers RT; Tran JC; Thomas PM; Kelleher NL Molecular & cellular proteomics : MCP 2013, 12, 3465–3473. [DOI] [PMC free article] [PubMed] [Google Scholar]
- (20).Carroll J; Altman MC; Fearnley IM; Walker JE Proceedings of the National Academy of Sciences 2007, 104, 14330. [DOI] [PMC free article] [PubMed] [Google Scholar]
- (21).Carroll J; Fearnley IM; Walker JE Proceedings of the National Academy of Sciences 2006, 103, 16170. [DOI] [PMC free article] [PubMed] [Google Scholar]
- (22).Brown KA; Chen B; Guardado-Alvarez TM; Lin Z; Hwang L; Ayaz-Guner S; Jin S; Ge Y Nature Methods 2019, 16, 417–420. [DOI] [PMC free article] [PubMed] [Google Scholar]
- (23).Brown K; Tucholski T; Eken C; Knott S; Zhu Y; Jin S; Ge Y Angewandte Chemie International Edition 2020, n/a. [DOI] [PMC free article] [PubMed] [Google Scholar]
- (24).Bordier C J Biol Chem 1981, 256, 1604–1607. [PubMed] [Google Scholar]
- (25).Schuck S; Honsho M; Ekroos K; Shevchenko A; Simons K Proc Natl Acad Sci U S A 2003, 100, 5795–5800. [DOI] [PMC free article] [PubMed] [Google Scholar]
- (26).Donoghue PM; Hughes C; Vissers JP; Langridge JI; Dunn MJ Proteomics 2008, 8, 3895–3905. [DOI] [PubMed] [Google Scholar]
- (27).Duraimurugan D; John I Chemical and Biochemical Engineering Quarterly 2016, 30, 189–198. [Google Scholar]
- (28).Loo RRO; Dales N; Andrews PC Protein Science 1994, 3, 1975–1983. [DOI] [PMC free article] [PubMed] [Google Scholar]
- (29).VanAernum ZL; Busch F; Jones BJ; Jia M; Chen Z; Boyken SE; Sahasrabuddhe A; Baker D; Wysocki VH Nature Protocols 2020, 15, 1132–1157. [DOI] [PMC free article] [PubMed] [Google Scholar]
- (30).Regnier FE; Gooding KM Analytical Biochemistry 1980, 103, 1–25. [DOI] [PubMed] [Google Scholar]
- (31).Waitt GM; Xu R; Wisely GB; Williams JD J Am Soc Mass Spectrom 2008, 19, 239–245. [DOI] [PubMed] [Google Scholar]
- (32).Cai W; Tucholski T; Chen B; Alpert AJ; McIlwain S; Kohmoto T; Jin S; Ge Y Analytical Chemistry 2017, 89, 5467–5475. [DOI] [PMC free article] [PubMed] [Google Scholar]
- (33).Cai W; Hite ZL; Lyu B; Wu Z; Lin Z; Gregorich ZR; Messer AE; McIlwain SJ; Marston SB; Kohmoto T; Ge Y J Mol Cell Cardiol 2018, 122, 11–22. [DOI] [PMC free article] [PubMed] [Google Scholar]
- (34).Wessel D; Flugge UI Anal Biochem 1984, 138, 141–143. [DOI] [PubMed] [Google Scholar]
- (35).Doucette AA; Vieira DB; Orton DJ; Wall MJ Journal of Proteome Research 2014, 13, 6001–6012. [DOI] [PubMed] [Google Scholar]
- (36).The UniProt Consortium. Nucleic acids research 2017, 45, D158–D169. [DOI] [PMC free article] [PubMed] [Google Scholar]
- (37).Kou Q; Xun L; Liu X Bioinformatics 2016, 32, 3495–3497. [DOI] [PMC free article] [PubMed] [Google Scholar]
- (38).Cai W; Guner H; Gregorich ZR; Chen AJ; Ayaz-Guner S; Peng Y; Valeja SG; Liu X; Ge Y Mol Cell Proteomics 2016, 15, 703–714. [DOI] [PMC free article] [PubMed] [Google Scholar]
- (39).Szklarczyk D; Gable AL; Lyon D; Junge A; Wyder S; Huerta-Cepas J; Simonovic M; Doncheva NT; Morris JH; Bork P; Jensen LJ; Mering CV Nucleic Acids Res 2019, 47, D607–d613. [DOI] [PMC free article] [PubMed] [Google Scholar]
- (40).Mi H; Muruganujan A; Thomas PD Nucleic Acids Res 2013, 41, D377–386. [DOI] [PMC free article] [PubMed] [Google Scholar]
- (41).Moller S; Croning MD; Apweiler R Bioinformatics 2001, 17, 646–653. [DOI] [PubMed] [Google Scholar]
- (42).Lin W-Z; Fang J-A; Xiao X; Chou K-C Molecular BioSystems 2013, 9, 634–644. [DOI] [PubMed] [Google Scholar]
- (43).Perez-Riverol Y; Csordas A; Bai J; Bernal-Llinares M; Hewapathirana S; Kundu DJ; Inuganti A; Griss J; Mayer G; Eisenacher M; Perez E; Uszkoreit J; Pfeuffer J; Sachsenberg T; Yilmaz S; Tiwary S; Cox J; Audain E; Walzer M; Jarnuczak AF, et al. Nucleic Acids Res 2019, 47, D442–d450. [DOI] [PMC free article] [PubMed] [Google Scholar]
- (44).Smith SM Methods Mol Biol 2011, 681, 485–496. [DOI] [PubMed] [Google Scholar]
- (45).Lai X Electrophoresis 2013, 34, 809–817. [DOI] [PMC free article] [PubMed] [Google Scholar]
- (46).Lund R; Leth-Larsen R; Jensen ON; Ditzel HJ Journal of Proteome Research 2009, 8, 3078–3090. [DOI] [PubMed] [Google Scholar]
- (47).Okamoto T; Schwab RB; Scherer PE; Lisanti MP Curr Protoc Cell Biol 2001, Chapter 5, Unit 5.4. [DOI] [PubMed] [Google Scholar]
- (48).Ferrige AG; Seddon MJ; Jarvis S; Skilling J; Aplin R Rapid communications in mass spectrometry 1991, 5, 374–377. [Google Scholar]
- (49).Tran JC; Doucette AA Analytical Chemistry 2009, 81, 6201–6209. [DOI] [PubMed] [Google Scholar]
- (50).Tucholski T; Knott SJ; Chen B; Pistono P; Lin Z; Ge Y Analytical Chemistry 2019, 91, 3835–3844. [DOI] [PMC free article] [PubMed] [Google Scholar]
- (51).Compton PD; Zamdborg L; Thomas PM; Kelleher NL Anal Chem 2011, 83, 6868–6874. [DOI] [PMC free article] [PubMed] [Google Scholar]
- (52).The UniProt, C. Nucleic Acids Research 2018, 47, D506–D515. [DOI] [PMC free article] [PubMed] [Google Scholar]
- (53).Eichacker LA; Granvogl B; Mirus O; Muller BC; Miess C; Schleiff E J Biol Chem 2004, 279, 50915–50922. [DOI] [PubMed] [Google Scholar]
- (54).Deutsch EW; Csordas A; Sun Z; Jarnuczak A; Perez-Riverol Y; Ternent T; Campbell DS; Bernal-Llinares M; Okuda S; Kawano S; Moritz RL; Carver JJ; Wang M; Ishihama Y; Bandeira N; Hermjakob H; Vizcaino JA Nucleic Acids Res 2017, 45, D1100–d1106. [DOI] [PMC free article] [PubMed] [Google Scholar]
- (55).Hiller S; Abramson J; Mannella C; Wagner G; Zeth K Trends Biochem Sci 2010, 35, 514–521. [DOI] [PMC free article] [PubMed] [Google Scholar]
- (56).Bienert S; Waterhouse A; de Beer Tjaart A. P.; Tauriello G; Studer G; Bordoli L; Schwede T Nucleic Acids Research 2016, 45, D313–D319. [DOI] [PMC free article] [PubMed] [Google Scholar]
- (57).Garavito RM; Ferguson-Miller S J Biol Chem 2001, 276, 32403–32406. [DOI] [PubMed] [Google Scholar]
- (58).Rovini A Front Physiol 2019, 10, 671. [DOI] [PMC free article] [PubMed] [Google Scholar]
- (59).Chen B; Lin Z; Alpert AJ; Fu C; Zhang Q; Pritts WA; Ge Y Analytical Chemistry 2018, 90, 7135–7138. [DOI] [PMC free article] [PubMed] [Google Scholar]
- (60).Skinner OS; Haverland NA; Fornelli L; Melani RD; Do Vale LHF; Seckler HS; Doubleday PF; Schachner LF; Srzentić K; Kelleher NL; Compton PD Nature Chemical Biology 2018, 14, 36–41. [DOI] [PMC free article] [PubMed] [Google Scholar]
- (61).Smith LM; Thomas PM; Shortreed MR; Schaffer LV; Fellers RT; LeDuc RD; Tucholski T; Ge Y; Agar JN; Anderson LC; Chamot-Rooke J; Gault J; Loo JA; Paša-Tolić L; Robinson CV; Schlüter H; Tsybin YO; Vilaseca M; Vizcaíno JA; Danis PO, et al. Nature Methods 2019, 16, 939–940. [DOI] [PMC free article] [PubMed] [Google Scholar]
- (62).Zenaidee MA; Lantz C; Perkins T; Jung W; Loo RRO; Loo JA Journal of the American Society for Mass Spectrometry 2020, 31, 1896–1902. [DOI] [PMC free article] [PubMed] [Google Scholar]
- (63).Sanders JD; Mullen C; Watts E; Holden DD; Syka JEP; Schwartz JC; Brodbelt JS Analytical Chemistry 2020, 92, 1041–1049. [DOI] [PubMed] [Google Scholar]
- (64).Shaw JB; Li W; Holden DD; Zhang Y; Griep-Raming J; Fellers RT; Early BP; Thomas PM; Kelleher NL; Brodbelt JS Journal of the American Chemical Society 2013, 135, 12646–12651. [DOI] [PMC free article] [PubMed] [Google Scholar]
- (65).Riley NM; Westphall MS; Coon JJ Journal of the American Society for Mass Spectrometry 2018, 29, 140–149. [DOI] [PMC free article] [PubMed] [Google Scholar]
- (66).Schaffer LV; Tucholski T; Shortreed MR; Ge Y; Smith LM Analytical Chemistry 2019, 91, 10937–10942. [DOI] [PMC free article] [PubMed] [Google Scholar]
- (67).Sonnhammer EL; von Heijne G; Krogh A Proc Int Conf Intell Syst Mol Biol 1998, 6, 175–182. [PubMed] [Google Scholar]
- (68).Dahl KN; Kahn SM; Wilson KL; Discher DE Journal of Cell Science 2004, 117, 4779. [DOI] [PubMed] [Google Scholar]
- (69).Zhang J; Guy MJ; Norman HS; Chen YC; Xu Q; Dong X; Guner H; Wang S; Kohmoto T; Young KH; Moss RL; Ge Y J Proteome Res 2011, 10, 4054–4065. [DOI] [PMC free article] [PubMed] [Google Scholar]
- (70).Mirzarafie A; Grainger RK; Thomas B; Bains W; Ustok FI; Lowe CR Rejuvenation Res 2014, 17, 159–160. [DOI] [PubMed] [Google Scholar]
Associated Data
This section collects any data citations, data availability statements, or supplementary materials included in this article.


