

Abstract
Introduction
As cerebrospinal fluid (CSF) neurofilament light protein (NfL) and the CSF/serum albumin ratio (QAlb) are used in the clinical routine, the impact of demographic factors on these biomarkers is important to understand.
Methods
Participants were derived from two Swedish samples: the population‐based H70 Study (n = 308, age 70) and a clinical routine cohort (CSF NfL, n = 8995, QAlb, n = 39252, age 0 to 95). In the population‐based study, QAlb and NfL were examined in relation to sex, cardiovascular risk factors, and cerebral white matter lesions (WMLs). In the clinical cohort, QAlb and NfL sex differences were tested in relation to age.
Results
Men had higher QAlb and NfL concentrations and had higher QAlb and NfL concentrations from adolescence throughout life. NfL was not related to WML, but QAlb correlated positively with WMLs.
Discussion
The CSF NfL sex difference could not be explained by vascular pathology. Future studies should consider using different reference limits for men and women.
Keywords: albumin ratio, blood‐brain barrier integrity, CSF biomarkers, neurofilament light, sex differences
1. INTRODUCTION
Cerebrospinal fluid (CSF) neurofilament light protein (NfL) and CSF/serum albumin ratio (QAlb) are widely used biomarkers that aid diagnostics and disease monitoring of neurodegenerative and neuroinflammatory diseases in both research and clinical settings. CSF NfL is a biomarker signaling rate of ongoing neuronal decay in conditions such as multiple sclerosis (MS), Alzheimer's disease (AD), stroke, frontotemporal dementia (FTD), and Creutzfeldt‐Jakob disease. 1 , 2 , 3 , 4 , 5 , 6 , 7 QAlb is a biomarker of blood‐brain barrier integrity and is altered in multiple neurodegenerative and inflammatory diseases. 8 In clinical chemistry, the possible influence of demographic factors such as age and sex on biomarker levels is examined, and if needed age‐ and sex‐specific reference ranges are established, for example, plasma levels of hemoglobin, creatinine, and apolipoprotein A1 and B. It is known that CSF NfL increases with age, but it has been less examined if there are sex differences or other factors such as cardiovascular pathology that alter concentrations and reference ranges. A recent meta‐analysis found higher NfL concentrations in men among healthy controls and some neurodegenerative conditions, and the same finding was observed in a small data set from the Alzheimer's Disease Neuroimaging Initiative (ADNI) study. 9 , 10 However, the relation with possible vascular factors was not examined. Regarding QAlb, it was recently reported that men had higher levels of QAlb than women from childhood and throughout life. 11 These differences might indicate a need to consider sex differences when constructing reference ranges. Currently, reference ranges for QAlb and CSF NfL are commonly adjusted by age, but no adjustment due to sex is applied. 12 , 13
Therefore, we aimed to determine whether there are sex differences in CSF NfL and QAlb in non‐demented population‐based elderly, and in clinical patients across the lifespan. We hypothesized that CSF NfL and QAlb levels would be higher in men. As a secondary aim, we sought to determine whether sex differences in these biomarkers could be explained by specific pathologies, such as cerebrovascular disease or demographic factors, to elucidate whether sex differences were due to sex‐specific or non–sex‐specific factors. In this aim, we hypothesized that CSF NfL concentration and QAlb would be correlated, and that the sex differences could be explained by higher prevalence of cerebrovascular disease in men.
RESEARCH IN CONTEXT
Systematic review: The authors reviewed the literature using traditional (eg, PubMed) sources and meeting abstracts and presentations. Cerebrospinal fluid (CSF) neurofilament light protein (NfL) concentrations are known to increase with age, but sex differences have been less examined. Higher CSF/serum albumin ratio (QAlb) and CSF NfL in males have recently been described. However, previous studies have not examined sex differences in CSF NfL in childhood or adolescence and have not examined the effect of vascular pathology.
Interpretation: Our findings show that CSF NfL and QAlb are higher in men from adolescence throughout life and in CSF NFL irrespective of white matter pathology.
Future directions: The manuscript proposes that for clinical routine use of NfL and QAlb demographic factors should be considered and that more studies examining possible influencing factors on CSF biomarkers are needed.
2. METHODS
2.1. Population‐based study
This study included a population‐based cohort comprising 70‐year‐olds recruited between 2014 and 2016, as part of the Gothenburg H70 Birth Cohort Studies, Sweden. Gothenburg residents were systematically selected from the local population based on their birthdates; 322 consented to a lumbar puncture (LP) as described previously. 14 Eight participants that lacked data on both CSF NfL and QAlb were excluded. One participant was excluded due to an outlier level of CSF NfL, outside of 10 standard deviations (SD) from the mean. Furthermore, as the purpose of this study was to examine the possible underlying sex differences in CSF NfL and QAlb concentrations, we chose to exclude all participants with a dementia diagnosis (n = 5). The final cohort for this study comprised 308 non‐demented participants aged 70.
2.2. Clinical routine patient cohort
A second cohort was used to study sex differences in CSF biomarker levels in relation to age and was compiled using archived data on all CSF NfL and QAlb measurements for clinical purposes performed CSF sampling at the clinical Neurochemistry Laboratory, Sahlgrenska University Hospital, Sweden, from January 1, 2005 to June 1, 2012. All measurements of QAlb and CSF NfL on patients ages 0 to 95 were included, regardless of clinical indication for the LP. For patients with repeated measurements, only the first measurement was included. The resulting data set consisted of 8995 subjects for the NfL analysis and 39,252 subjects for QAlb.
2.3. Assessment of covariates
Several cardiovascular and related covariates in the H70 population‐based study were assessed (diagnosis of hypertension, diabetes, previous stroke diagnosis, smoking in the past or present, presence of any heart disease, alcohol use as defined by the patients estimation of average total weekly consumption, apolipoprotein E ε4 [APOE ɛ4)] carriership, clinical dementia rating [CDR] score, body mass index [BMI], current statin treatment, current renin‐angiotensin‐aldosterone system [RAAS] treatment, current β‐blocking and calcium blocking agent treatment, and total serum cholesterol) as described previously. 14 , 15 , 16 The neuropsychiatric and somatic examinations were conducted at the neuropsychiatric outpatient clinic at the Sahlgrenska University Hospital or in the participant's home by trained research nurses or medical doctors, as described previously. 15 Information on these covariates was not available for the clinical routine sample.
2.4. CSF measurements
All CSF analyses were performed in clinical practice by board‐certified laboratory technicians using procedures accredited by the Swedish Board for Accreditation and Conformity Assessment. CSF collection, processing, and storage procedures have been described previously. 17 CSF NfL was measured using a commercial enzyme‐linked immunosorbent assay (ELISA; NF‐light ELISA, Uman Diagnostics, Umeå, Sweden) as described by the manufacturer. CSF and serum albumin concentrations were measured by immunonephelometry on a Beckman Image Immunochemistry system (Beckman Instruments, Beckman Coulter, Brea, CA, USA). QAlb was calculated as CSF albumin (mg/L)/serum albumin (g/L). Longitudinal stability in the measurements over time was ascertained using an elaborate system of internal quality control samples and testing of incoming reagents. CSF amyloid beta 1‐42 (Aβ42) was measured using a sandwich ELISA (INNOTEST AB1‐42), as described previously. 18
2.5. Magnetic resonance imaging (MRI) data acquisition and image processing
All H70 study participants (n = 308) were scanned on a 3T Philips Achieva system (Philips Medical Systems) at the Aleris Clinic in Gothenburg using a three‐dimensional (3D) T1‐weighted, a 3D fluid‐attenuated inversion recovery (FLAIR), and a T2‐weighted scan. The full magnetic resonance imaging (MRI) protocol and sequence detail are previously described . 15 The following MRI markers of white matter pathology were used as proxies for cerebrovascular pathology: total white matter lesion (WML) volume and WML volumes for sublobar regions, and the temporal, frontal, occipital, parietal, and limbic lobes.
The number and volume of WMLs were automatically segmented with LST and FreeSurfer. LST is an open source segmentation toolbox implemented in the SPM software (https://www.fil.ion.ucl.ac.uk/spm/). LST utilizes a lesion‐prediction algorithm (LPA) based on FLAIR image intensity distribution (hyperintensities). MRI data management and processing was done with the HiveDB system. 19
2.6. Statistical analysis
Differences between men and women in demographic variables, biomarker concentrations, MRI measures, and possible covariates were analyzed using t tests (age, BMI, serum cholesterol, and all MRI measures) and Mann‐Whitney U tests (NFL, QAlb) for continuous variables and chi‐square statistics for categorical variables. To identify variables associated with NfL and QAlb levels in the population‐based cohort, we performed Spearman correlation analyses between NfL and QAlb with age, hypertension, diabetes, stroke, smoking, alcohol use, APOE ɛ4 carriership, BMI, statin treatment, current β‐blocking and calcium‐blocking agent treatment, RAAS treatment, total cholesterol, CDR scores, and CSF Aβ42. The variables that were significantly associated with NfL and QAlb in these analyses were then included as predictors in forward linear regression models using NfL and QAlb as dependent variables and sex as a covariate. In addition, because higher NfL concentrations were associated with increasing age, we included age as an additional covariate in the NfL model. Due to significantly skewed distributions, biomarker levels were logarithmically transformed where appropriate. In all analyses, a two‐tailed, P < 0.05 was considered significant. All statistical analyses were performed in SPSS version 25 (IBM, New York).
2.7. Ethics—standard protocol approvals, registrations, and patient consent
This study was approved by the Ethics Committee for Medical Research at the University of Gothenburg. All participants in the population‐based study gave informed consent before taking part in the study. Written informed consent was obtainend from all participants in the H70 study. In the second clinical routine patient cohort, the biomarker data was compiled using archived data for clinical purposes performed CSF sampling at the clinical Neurochemistry Laboratory, Sahlgrenska University Hospital. The regional ethical committee at the University of Gothenburg has approved both studies.
3. RESULTS
3.1. Demographics and covariates
The population‐based study sample consisted of 146 women and 162 men, without dementia (Table 1). Compared to women, men were more often diagnosed with diabetes (12% vs 5%, P = 0.028) and had higher alcohol consumption in grams per week (chi‐square = 23.18, P = 0.003). Men also received RAAS‐blocking treatment (36% vs 22%, P = 0.017) and statin treatment (28% vs 16%, P = 0.015) more often than women, and their total serum cholesterol levels were lower (mean 5.21 vs 5.98, P < 0.001).
TABLE 1.
Characteristics and cerebrospinal fluid levels according to biological sex in cognitively normal 70‐year‐old participants of the Gothenburg H70 Birth Cohort studies
| Characteristics | Median (IQR)/N(%) |
|---|---|
| Female (n = 146) | |
| Age | 70.8 (70.7, 71.2) |
| Presence of APOE ɛ4 allele | 44 (30.6%) |
| Body mass index | 24.5 (22.3, 27.4) |
| Diabetes | 7 (4.8%) * |
| Hypertension | 68 (46.6%) |
| Serum total cholesterol | 6.0 (5.2, 6.6) ** |
| Statin treatment | 23 (15.7%) * |
| CSF NfL (pg/mL) | 696.0 (525.0, 857.0) * |
| CSF QAlb (pg/mL) | 5.7 (4.5, 6.7) ** |
| Male (n = 162) | |
| Age | 70.9 (70.7, 71.1) |
| Presence of APOE ɛ4 allele | 66 (40.7%) |
| Body mass index | 25.9 (23.6, 28.3) |
| Diabetes | 19 (11.8%) * |
| Hypertension | 83 (51.2%) |
| Serum total cholesterol | 5.2 (4.4, 5.8) ** |
| Statin treatment | 45 (27.7%) * |
| CSF NfL (pg/mL) | 742.5 (576.0, 976.0) * |
| CSF QAlb (pg/mL) | 6.7 (5.3, 8.3) ** |
NfL, neurofilament light protein, serum total cholesterol in mmol/L; QAlb, CSF/serum albumin ratio.
*Significant difference at the <0.05 level.
**Significant difference at the <0.001 level.
There were no significant differences between men and women in age (mean 70.9 vs 70.9, P = 0.98), BMI (mean 26.3 vs 25.5, P = 0.09), APOE ɛ4 carriership (chi‐square = 5.4, P = 0.07), smoking (chi‐square = 6.3, P = 0.18), previous stroke diagnosis (chi‐square = 1.8, P = 0.17), or presence of hypertension (chi‐square = 0.67, P = 0.41). Men and women were also as frequently treated with diuretics (chi‐square = 23, P = 0.63), β‐blocking (chi‐square = 3.0, P = 0.23), and calcium‐blocking agents (chi‐square = 0.99, P = 0.61) Table 1 gives median (IQR).
In the population‐based cohort, men had higher occipital WML volumes than women (mean 0.15 vs 0.06, P < 0.001).
3.2. CSF biomarkers in the population based sample
There were significant correlations between CSF NfL and QAlb in the whole sample (rs = 0.27, P < 0.001), as well as for both men (rs = 0.22, P = 0.004) and women (rs = 0.25, P = 0.002) separately. Men had higher CSF NfL concentrations (median 742.5 vs 696.0, P = 0.011) and higher QAlb (median 6.7 vs 5.7; P < 0.001) (Table 1, Figure 1) than women.
FIGURE 1.
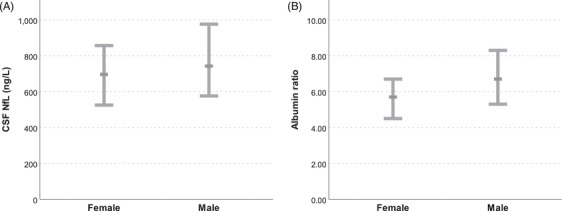
(A) Cognitively normal 70‐year‐old men exhibit higher cerebrospinal fluid neurofilament light protein concentrations than women in the population‐based Gothenburg H70 Birth Cohort studies. Median concentrations and interquartile ranges are displayed in the chart. (B) Cognitively normal 70‐year‐old men exhibit higher QAlb than women in the population‐based Gothenburg H70 Birth Cohort studies. Medians and interquartile ranges are displayed in the chart
3.3. Association between CSF QAlb and NfL and MRI evidence of cerebral vascular pathology in the population‐based cohort
Among all participants, after adjusting for TIV, QAlb correlated significantly with total WML volume (rs = 0.13, P = 0.032), temporal WML volume (rs = 0.14, P = 0. 016), frontal WML volume (rs = 0.12, P = 0.038), and parietal WML (rs = 0.13, P = 0.034). There were no significant correlations between QAlb and any markers of white matter pathology in men. Among women, QAlb correlated with frontal WML volume (r = 0.18, P = 0.033). However, there were no significant interactions between QAlb, sex, and frontal WML.
No significant correlations were found between CSF NfL and markers of white matter pathology in the whole group, or in men or women alone.
3.4. Association between NfL and QAlb with clinical variables in the population‐based cohort
We found a significant correlation between QAlb and RAAS treatment (rs = 0.143, P = 0.011), statin treatment (rs = 0.136, P = 0.015), cholesterol (rs = −0.147, P = 0.009), diabetes (rs = 0.148, P = 0.008), and BMI (rs = 0.180, P = 0.001). In addition, NfL was significantly associated with BMI (rs = −0.126, P = 0.025).
When the previous variables were entered in separate linear regression models to predict QAlb and NfL concentrations while adjusting for sex (QAlb, NfL) and age (NfL), we found that BMI was associated significantly with higher QAlb concentrations (R2 = 0.086, B = 0.006, t = 3.316, P = 0.001) and lower NfL levels (R2 = 0.041, BMI: B = −0.007, t = −2.421, P = 0.016).
3.5. Sex differences in biomarkers and BMI in the population‐based study
BMI was available for all participants in the population‐based study (Table 1), but not for subjects in the clinical routine cohort. BMI correlated positively with QAlb (rs = 0.16, P = 0.10) and negatively with CSF NfL (rs = −0.17, P = 0.008) in the whole population‐based study. In men, BMI correlated with both QAlb (rs = 0.20, P = 0.010) and CSF NfL (rs = −0.19, P = 0.018), but in women BMI did not significantly correlate with either QAlb or CSF NfL.
3.6. Sex differences in CSF biomarkers in the clinical study sample
We then examined sex differences in CSF biomarkers concentrations in 8982 (CSF NfL) and 39252 (QAlb) patients, ages 0 to 95 years, collected for clinical diagnostic purposes. Subject counts for all age categories in the clinical routine cohort are detailed in Table 2. Among all patients, men had higher CSF NfL concentrations (median 1460 vs 1180, P < 0.001) and higher QAlb (median 6.7 vs 5.2, P < 0.001) than women. However, correlations between CSF NfL and QAlb were similar when examining the whole cohort (rs = 0.44, P < 0.001), men only (rs = 0.41, P < 0.001), and women only (rs = 0.43, P < 0.001).
TABLE 2.
Clinical routine cohort description
| NfL | QAlb | |||||
|---|---|---|---|---|---|---|
| Age group | Total | Male (%) | Female (%) | Total | Male (%) | Female (%) |
| 0‐4 | 228 | 130 (57%) | 98 (43%) | 1083 | 564 (52%) | 519 (48%) |
| 5‐9 | 111 | 67 (60%) | 44 (40%) | 661 | 365 (55%) | 296 (45%) |
| 10‐14 | 116 | 56 (48%) | 60 (52%) | 756 | 330 (44%) | 426 (56%) |
| 15‐19 | 126 | 54 (43%) | 72 (57%) | 1063 | 386 (36%) | 677 (64%) |
| 20‐24 | 140 | 43 (31%) | 97 (69%) | 1299 | 484 (37%) | 815 (63%) |
| 25‐29 | 183 | 59 (32%) | 124 (68%) | 1818 | 623 (34%) | 1195 (66%) |
| 30‐34 | 192 | 64 (33%) | 128 (67%) | 2226 | 802 (36%) | 1424 (64%) |
| 35‐39 | 297 | 119 (40%) | 178 (60%) | 2524 | 966 (38%) | 1558 (62%) |
| 40‐44 | 358 | 137 (38%) | 221 (62%) | 2503 | 986 (39%) | 1517 (61%) |
| 45‐49 | 410 | 182 (44%) | 228 (56%) | 2428 | 1062 (44%) | 1366 (56%) |
| 50‐54 | 481 | 232 (48%) | 249 (52%) | 2870 | 1261 (44%) | 1609 (56%) |
| 55‐59 | 692 | 340 (49%) | 352 (51%) | 3281 | 1526 (47%) | 1755 (53%) |
| 60‐64 | 985 | 504 (51%) | 481 (49%) | 3333 | 1633 (49%) | 1700 (51%) |
| 65‐69 | 1220 | 603 (49%) | 617 (51%) | 3461 | 1676 (48%) | 1785 (52%) |
| 70‐74 | 1321 | 691 (52%) | 630 (48%) | 3861 | 1863 (48%) | 1998 (52%) |
| 75‐79 | 1152 | 579 (50%) | 573 (50%) | 3572 | 1626 (46%) | 1946 (54%) |
| 80‐84 | 721 | 323 (45%) | 398 (55%) | 1902 | 838 (44%) | 1064 (56%) |
| 85‐89 | 244 | 98 (40%) | 146 (60%) | 564 | 229 (41%) | 335 (59%) |
| 90‐94 | 18 | 7 (39%) | 11 (61%) | 47 | 20 (43%) | 27 (57%) |
| Total | 8995 | 4288 (48%) | 4707 (52%) | 39252 | 17240 (44%) | 22012 (56%) |
Subjects counts in each age group and with data available on cerebrospinal fluid neurofilament light protein level and QAlb ratio.
NfL, Neurofilament light protein, QAlb, CSF/serum albumin ratio.
When stratifying by age, men had higher QAlb in all age groups (P < 0.05) except in 5‐ to 10‐year‐olds (P = 0.163) (Figures 2A and 3A).
FIGURE 2.
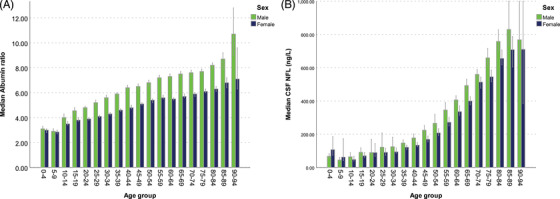
(A) Median QAlb and age in the clinical routine cohort. Men exhibit 25% to 30% higher QAlb in all age group from ages 10 and up. Error bars represent 95% confidence intervals. (B) Median cerebrospinal fluid neurofilament light concentrations and age in the clinical routine cohort. Men exhibit 15% to 30% higher neurofilament light concentrations in most age groups from ages 10 and up. Error bars represent 95% confidence intervals
FIGURE 3.
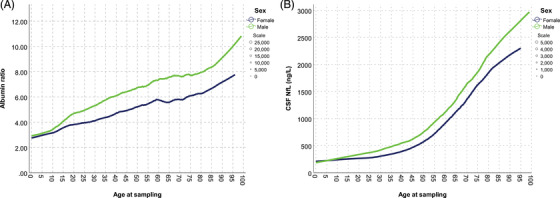
(A) QAlb and age in the clinical routine cohort. Local regression trend lines show QAlb starting to diverge in the early teens and remain constantly separated at ages after about 15 to 20. (B) Cerebrospinal fluid neurofilament light and age in the clinical routine cohort. Both sexes exhibit accelerating increases in neurofilament light concentrations with age, and men have higher concentrations than women from teen years and throughout life.
Men also had significantly (P < 0.05) higher CSF NfL concentrations in most age groups, except in the groups between 0 and 25 and 90 and 95 years of age(Figures 2B and 3B).
4. DISCUSSION
In this study we aimed to identify and examine sex differences in CSF NfL, a non‐specific biomarker for neurodegeneration, and QAlb, a biomarker for BBB integrity, among non‐demented 70‐year‐olds derived from a population‐based sample and a clinical routine cohort, spanning ages 0 to 95. In both samples, men had higher QAlb and CSF NfL levels than women. We initially hypothesized that higher QAlb and CSF NfL levels in men could be due to the higher prevalence of vascular disease in men. However, after adjustment for cerebrovascular pathology and vascular risk factors, the sex difference in QAlb and CSF NfL remained. Furthermore, when exploring CSF NfL and QAlb in relation to age in the large sample of clinical routine measurements, we found that males had higher levels starting in adolescence and remaining throughout the lifespan. These results suggest that the higher levels of CSF NfL and QAlb are not due to cardio‐ or cerebrovascular disease, as vascular pathology increases with age and is rare in younger age groups. The phenomenon of higher QAlb in males across all ages has recently been described. 11 However, previous studies have not examined sex differences in CSF NfL in childhood or adolescence.
Previous studies have shown correlations between QAlb and CSF NfL concentrations, and that blood‐brain barrier leakage is common in dementia, especially in vascular dementia. 20 Studies have also shown associations between white matter pathology and both CSF NfL and QAlb. 21 , 22 , 23 In this study we found correlations between CSF NfL and QAlb in cognitively normal 70‐year‐olds without evidence of dementia, and only a weak correlation between QAlb, but not NfL, and vascular pathology and risk factors. These results, together with the elevated CSF NfL and QAlb levels in young age groups, suggest that other factors are contributing to the observed sex differences. Data from a recent study did not indicate any sex difference changes at puberty or menopause, and propose that their findings point away from hormonal factors as explanatory factors. 11 Our data, which was also derived from clinical routine samples, partly contradicts this notion by showing that QAlb and CSF NfL concentrations in males and females start to diverge in the early teens, roughly coinciding with puberty, and that the separation remains relatively constant at ages over 20 years. Notably, the ratio of CSF QAlb and NfL between the sexes did not differ at or after the age of natural menopause. This suggests that changes in estrogen levels are not the cause of the sex difference. It should be noted that the data in the clinical routine sample is taken from subjects who had an LP on clinical indication and cannot be generalized to healthy populations.
Both NfL and QAlb increased with age in our clinical routine cohort, corroborating previous studies. 6 , 24 CSF NfL has been shown to reflect rate of neurodegeneration in several pathological processes such as stroke, MS, FTD, and Creutzfeldt‐Jakob disease but also in normal aging measured as loss of brain parenchymal fraction (BPF). 1 , 2 , 3 , 4 , 5 , 6 However, faster age‐related decline in BPF in men has, to our knowledge, not been observed, contradicting it as the driver of the gap between sexes in CSF NfL. Taken together, this may indicate that higher CSF NfL concentrations in men reflect a higher axonal turnover.
BMI has previously been observationally reported to be associated with higher QAlb. 25 Of interest, both obesity and AD are affected by sex steroid hormones and differ between sexes. 26 , 27 In this study, BMI was associated with both QAlb and CSF NfL in regression modeling. BMI also correlated weakly with both CSF NfL and QAlb, but not in all groups. Unfortunately, BMI data were not available in the clinical routine cohort prohibiting analysis across age categories. In any case, adjusting for BMI did not eradicate sex as a predictor of QAlb.
The main strengths of this study included the use of the well‐characterized and population‐based H70 cohort for detailed analysis of confounders, in combination with access to the high number of subjects in the clinical routine cohort. The clinical routine sample also provided means of studying the effect of age on biomarker levels. This study also had limitations. The lack of detailed clinical data on the clinical routine cohort might lead to bias, as we had no information on the reason for each individual LP. It is, however, unlikely that this would bias differences in relation to sex, as there are no major indications for an LP that differ greatly between sexes. An exception is MS, which is roughly twice as common in women. Disease onset in MS usually occurs in the third to fourth decade of life, probably explaining the high proportion of women in the clinical routine cohort with CSF NfL measurements around those age categories. 28 Another limitation is that although we have previously shown that participants in LP were similar regarding a number of factors in the H70 study, we cannot exclude the possibility that participants with and without LP differed in health status, even though it is unlikely that this selection bias should affect sex differences. 14 Although the H70 CSF sample was relatively large for a population‐based cohort, it was small in overall size. In addition, men were slightly over‐represented compared to women, but this should also not affect sex differences in CSF levels. Finally, it is plausible that the studied pathologies do not capture all possible biological determinants of CSF NfL and QAlb. Thus there may still be unknown factors that could explain the sex differences. However, this study highlights the need for further studies in large cohorts of healthy individuals to evaluate the need for sex‐specific reference ranges.
In conclusion, this study corroborated previous findings of higher QAlb in men in most age groups, and could add the finding that this difference emerges in ages 10 to 20, coinciding with puberty. This study could also reveal a similar age gap between men and women in CSF NfL concentrations, that also develops in adolescence or early adult years and remains constant throughout life. Vascular pathology as a main driver of these sex differences was contradicted by our results. The results of this study suggest that hormonal factors influence blood‐brain barrier integrity, and patterns of neuronal life cycles. Further studies into the influence of hormonal factors on blood‐brain barrier integrity and CSF NfL are needed. Our results suggest that reference limits for both QAlb and CSF NfL concentration might need to include a consideration of sex.
STATISTICAL ANALYSIS
Tobias Skillbäck and Joana Pereira.
CONFLICT OF INTEREST
HZ has served at scientific advisory boards for Roche Diagnostics, Wave, CogRx, and Samumed, and has given lectures in symposia sponsored by Biogen and Alzecure and is a co‐founder of Brain Biomarker Solutions in Gothenburg AB, a GU Ventures‐based platform company at the University of Gothenburg (all outside submitted work). KB has served as a consultant or at advisory boards for Alector, Biogen, CogRx, Lilly, MagQu, Novartis, and Roche Diagnostics, and is a co‐founder of Brain Biomarker Solutions in Gothenburg AB, a GU Venture‐based platform company at the University of Gothenburg, all unrelated to the work presented in this article. MMM has received unrestricted research grants from Biogen and Lundbeck unrelated to the work presented in this article. IS has served as a speaker for Takeda Pharmaceutical Company Limited outside of this submitted work. TS, SS, AM, JP, OL, AZ, LR, EW, LW, and SS report no disclosures.
Supporting information
Supporting Information
ACKNOWLEDGMENTS
HZ is a Wallenberg Academy Fellow supported by grants from the Swedish Research Council (#2018‐02532), the European Research Council (#681712), the Swedish Brain Foundation (FO2019‐0228), and Swedish State Support for Clinical Research (#ALFGBG‐720931).
KB holds the Torsten Söderberg Professorship in Medicine at the Royal Swedish Academy of Sciences, and is supported by the Swedish Research Council (#2017‐00915), the Swedish Alzheimer Foundation (#AF‐742881), and Hjärnfonden, Sweden (#FO2017‐0243). JBP is supported by the Swedish Research Council, Alzheimerfonden and Hjärnfonden. The study was financed by grants from the Swedish state under the agreement between the Swedish government and the county councils, the ALF‐agreement (ALF 716681, ALFGBG‐715986), The Swedish Research Council 2015‐02830, 2013‐8717, Swedish Research Council for Health, Working Life and Wellfare (2013‐1202, 2018‐00471, 2013‐2300, 2013‐2496, 2013‐0475), Hjärnfonden, Konung Gustaf V:s och Drottning Victorias Frimurarestiftelse, Alzheimerfonden, and Eivind och Elsa K:son Sylvans stiftelse. SK is supported by grants from the Swedish state under the agreement between the Swedish government and the county councils, the ALF‐agreement (ALFGBG‐81392, ALF GBG‐771071). The Alzheimerfonden (AF‐842471, AF‐737641), The Swedish Research Council (2019‐02075) Stiftelsen Demensfonden, Stiftelsen Hjalmar Svenssons Forskningsfond, Stiftelsen Wilhelm och Martina Lundgrens vetenskapsfond.
Skillbäck T, Blennow K, Zetterberg H, et al. Sex differences in CSF biomarkers for neurodegeneration and blood‐brain barrier integrity. Alzheimer's Dement. 2021;13:e12141. 10.1002/dad2.12141
Ingmar Skoog and Silke Kern contributed equally to this study.
Data availability statement
Anonymized data will be shared by request from any qualified investigator.
REFERENCES
- 1. Fotenos AF, Snyder AZ, Girton LE, Morris JC, Buckner RL. Normative estimates of cross‐sectional and longitudinal brain volume decline in aging and AD. Neurology 2005;64:1032‐1039. [DOI] [PubMed] [Google Scholar]
- 2. Skillback T, Mattsson N, Blennow K, Zetterberg H. Cerebrospinal fluid neurofilament light concentration in motor neuron disease and frontotemporal dementia predicts survival. Amyotrophic lateral sclerosis & frontotemporal degeneration 2017;18:397‐403. [DOI] [PubMed] [Google Scholar]
- 3. Pujol‐Calderon F, Portelius E, Zetterberg H, Blennow K, Rosengren LE, Hoglund K. Neurofilament changes in serum and cerebrospinal fluid after acute ischemic stroke. Neurosci Lett. 2019;698:58‐63. [DOI] [PubMed] [Google Scholar]
- 4. Kanata E, Golanska E, Villar‐Pique A, et al. Cerebrospinal fluid neurofilament light in suspected sporadic Creutzfeldt‐Jakob disease. Journal of clinical neuroscience: official journal of the Neurosurgical Society of Australasia 2019;60:124‐127. [DOI] [PubMed] [Google Scholar]
- 5. Hakansson I, Tisell A, Cassel P, et al. Neurofilament light chain in cerebrospinal fluid and prediction of disease activity in clinically isolated syndrome and relapsing‐remitting multiple sclerosis. European journal of neurology: the official journal of the European Federation of Neurological Societies 2017;24:703‐712. [DOI] [PubMed] [Google Scholar]
- 6. Kern S, Syrjanen JA, Blennow K, et al. Association of cerebrospinal fluid neurofilament light protein with risk of mild cognitive impairment among individuals without cognitive impairment. JAMA Neurol. 2018. [DOI] [PMC free article] [PubMed] [Google Scholar]
- 7. Skillback T, Farahmand B, Bartlett JW, et al. CSF neurofilament light differs in neurodegenerative diseases and predicts severity and survival. Neurology 2014;83:1945‐1953. [DOI] [PubMed] [Google Scholar]
- 8. Janelidze S, Hertze J, Nagga K, et al. Increased blood‐brain barrier permeability is associated with dementia and diabetes but not amyloid pathology or APOE genotype. Neurobiol Aging. 2017;51:104‐112. [DOI] [PMC free article] [PubMed] [Google Scholar]
- 9. Bridel C, van Wieringen WN, Zetterberg H, et al. Diagnostic value of cerebrospinal fluid neurofilament light protein in neurology: a systematic review and meta‐analysis. JAMA Neurol. 2019. [DOI] [PMC free article] [PubMed] [Google Scholar]
- 10. Mattsson N, Insel PS, Palmqvist S, et al. Cerebrospinal fluid tau, neurogranin, and neurofilament light in Alzheimer's disease. EMBO Mol Med. 2016;8:1184‐1196. [DOI] [PMC free article] [PubMed] [Google Scholar]
- 11. Parrado‐Fernandez C, Blennow K, Hansson M, Leoni V, Cedazo‐Minguez A, Bjorkhem I. Evidence for sex difference in the CSF/plasma albumin ratio in ∼20 000 patients and 335 healthy volunteers. J Cell Mol Med. 2018;22:5151‐5154. [DOI] [PMC free article] [PubMed] [Google Scholar]
- 12. Blennow K, Fredman P, Wallin A, et al. Protein analysis in cerebrospinal fluid. II. Reference values derived from healthy individuals 18‐88 years of age. Eur Neurol. 1993;33:129‐133. [DOI] [PubMed] [Google Scholar]
- 13. Blennow K, Dahle C, Zetterberg H. Sjukdomar i centrala nervsystemet. Klinisk Kemi i Praktisk Medicin, 10th ed ed: Studentlitteratur, 2017. [Google Scholar]
- 14. Kern S, Zetterberg H, Kern J, et al. Prevalence of preclinical Alzheimer disease: comparison of current classification systems. Neurology 2018;90:e1682‐e1691. [DOI] [PMC free article] [PubMed] [Google Scholar]
- 15. Rydberg Sterner T, Ahlner F, Blennow K, et al. The Gothenburg H70 Birth cohort study 2014‐16: design, methods and study population. Eur J Epidemiol. 2019;34:191‐209. [DOI] [PMC free article] [PubMed] [Google Scholar]
- 16. Ahlner F, Sigstrom R, Rydberg Sterner T, et al. Increased Alcohol Consumption Among Swedish 70‐Year‐Olds 1976 to 2016: Analysis of Data from The Gothenburg H70 Birth Cohort Studies, Sweden. Alcohol Clin Exp Res. 2018;42:2403‐2412. [DOI] [PubMed] [Google Scholar]
- 17. Shaw LM, Vanderstichele H, Knapik‐Czajka M, et al. Cerebrospinal fluid biomarker signature in Alzheimer's disease neuroimaging initiative subjects. Ann Neurol. 2009;65:403‐413. [DOI] [PMC free article] [PubMed] [Google Scholar]
- 18. Andreasen N, Hesse C, Davidsson P, et al. Cerebrospinal fluid beta‐amyloid(1‐42) in Alzheimer disease: differences between early‐ and late‐onset Alzheimer disease and stability during the course of disease. Arch Neurol. 1999;56:673‐680. [DOI] [PubMed] [Google Scholar]
- 19. Muehlboeck JS, Westman E, Simmons A. TheHiveDB image data management and analysis framework. Frontiers in neuroinformatics 2014;7:49. [DOI] [PMC free article] [PubMed] [Google Scholar]
- 20. Skillback T, Delsing L, Synnergren J, et al. CSF/serum albumin ratio in dementias: a cross‐sectional study on 1861 patients. Neurobiol Aging. 2017;59:1‐9. [DOI] [PubMed] [Google Scholar]
- 21. Jonsson M, Zetterberg H, van Straaten E, et al. Cerebrospinal fluid biomarkers of white matter lesions ‐ cross‐sectional results from the LADIS study. Eur J Neurol 2010;17:377‐382. [DOI] [PubMed] [Google Scholar]
- 22. Li Y, Li M, Zhang X, et al. Higher blood–brain barrier permeability is associated with higher white matter hyperintensities burden. J Neurol. 2017;264:1474‐1481. [DOI] [PubMed] [Google Scholar]
- 23. Skoog I, Wallin A, Fredman P, et al. A population study on blood‐brain barrier function in 85‐year‐olds: relation to Alzheimer's disease and vascular dementia. Neurology 1998;50:966‐971. [DOI] [PubMed] [Google Scholar]
- 24. Vagberg M, Norgren N, Dring A, et al. Levels and Age Dependency of Neurofilament Light and Glial Fibrillary Acidic Protein in Healthy Individuals and Their Relation to the Brain Parenchymal Fraction. PLoS One. 2015;10:e0135886. [DOI] [PMC free article] [PubMed] [Google Scholar]
- 25. Seyfert S, Kunzmann V, Schwertfeger N, Koch HC, Faulstich A. Determinants of lumbar CSF protein concentration. J Neurol. 2002;249:1021‐1026. [DOI] [PubMed] [Google Scholar]
- 26. Moser VA, Pike CJ. Obesity and sex interact in the regulation of Alzheimer's disease. Neurosci Biobehav Rev. 2016;67:102‐118. [DOI] [PMC free article] [PubMed] [Google Scholar]
- 27. Pike CJ. Sex and the development of Alzheimer's disease. J Neurosci Res. 2017;95:671‐680. [DOI] [PMC free article] [PubMed] [Google Scholar]
- 28. Golden LC, Voskuhl R. The importance of studying sex differences in disease: the example of multiple sclerosis. J Neurosci Res. 2017;95:633‐643. [DOI] [PMC free article] [PubMed] [Google Scholar]
- 29. Voevodskaya O, Pereira JB, Volpe G, et al. Altered structural network organization in cognitively normal individuals with amyloid pathology. Neurobiol Aging. 2018;64:15‐24. [DOI] [PubMed] [Google Scholar]
Associated Data
This section collects any data citations, data availability statements, or supplementary materials included in this article.
Supplementary Materials
Supporting Information
Data Availability Statement
Anonymized data will be shared by request from any qualified investigator.