

Abbreviations
- ACSL3
Acyl‐CoA Synthetase Long Chain Family Member 3
- ALOX15
Arachidonate 15‐Lipoxygenase
- AUC
area under curve
- DEGs
differential expressed genes
- DPP4
Dipeptidyl Peptidase 4
- GCLC
glutamate‐cysteine ligase catalytic subunit
- GO
gene ontology
- KEGG
Kyoto Encyclopedia of Genes and Genomes
- KM‐plot
Kaplan Meier‐plot
- KRAS
kirsten rat sarcoma viral oncogene
- LUAD
lung adenocarcinoma
- MAP1LC3C
Microtubule Associated Protein 1 Light Chain 3 Gamma
- MCA
multivariate cox analysis
- NCOA4
nuclear receptor coactivator 4
- NRAS
neuroblastoma RAS viral oncogene homolog
- OS
overall survival
- SLC11A2
Solute Carrier Family 11 Member 2
- SLC3A2
Solute Carrier Family 3 Member 2
- SLC7A11
Solute Carrier Family 7 Member 11
- ssGSEA
single sample gene set enrichment analysis
- TCGA
The Cancer Genome Atlas
- TFs
transcription factors
- TP53
Tumor Protein P53
- tROCs
time dependent receiver operating curves
- UCA
univariate cox analysis
- VDAC2
Voltage Dependent Anion Channel 2
- VIF
variance inflation factor
Dear Editor,
Lung cancer remains the most common and fatal type of cancer around the world, and lung adenocarcinoma (LUAD) is the most common subtype. 1 Although gene‐targeted therapies and immunotherapies have made great advances, most patients still suffer from drug‐resistance or insensitivity to current regimens. 2 Ferroptosis is a new regulated cell death form defined in 2012, 3 recently, its relevance in multiple pathological process including malignant tumors 4 has been reported, which is of great prognostic and therapeutic interests. Here, we aim to identify novel prognostic genes and construct a ferroptosis‐related prognostic signature for LUAD.
As shown in the flow chart (Figure 1A), RNA‐seq data of LUAD were retrospectively downloaded from The Cancer Genome Atlas (TCGA) database as discovery cohort, which contained 505 tumor tissues and 59 normal lung tissues after exclusion of samples without clinical or survival information. GSE72094 datasets were obtained from gene expression omnibus, and a total of 398 cases were used as an independent validation cohort. Ferroptosis‐related genes were selected based on the ferroptosis database (http://www.zhounan.org/ferrdb/) and literature review (Table S1). Differential analysis in discovery cohort showed that most of the genes (194/274, 70.08%) were abnormally expressed in LUAD (Figure 1B). Univariate cox analysis (UCA) revealed 49 prognostic genes (49/274, 17.89%, Figure 1C), of which KRAS, NRAS, and SLC7A11 maybe hub proteins in protein‐protein interaction network (Figure 1D). Following least absolute shrinkage and selection operator identified 10 genes (Figures 1E and 1F), proportional hazards (PH) test and variance inflation factor (VIF) were then used to ensure the time‐independence and non‐collinearity of these genes. MAP1LC3C (p = 0.00017) and SLC7A11(p = 0.0093) were excluded due to failure on PH test, finally eight genes with a p‐value larger than 0.05 on PH test and a VIF smaller than 2 were selected for modeling using Cox model (Table S2), and risk score was as follow: (3.40*expression of ACSL3)+ (−0.32*expression of ALOX15)+ (0.16*expression level of DPP4)+ (0.14*expression of GCLC)+ (−3.93*expression of NCOA4)+ (−3.00*expression of SLC11A2)+ (0.05*expression of SLC3A2)+ (2.45*expression of VDAC2). Waterfall map showed that the somatic alteration rates vary from 1% to 3% among eight genes (Figure 2A). Expression of ALOX15 was significantly decreased in tumor in TCGA (Figure S2A). Sample‐matched analysis showed that except for SLC11A2, all genes were abnormally expressed in tumor tissues (Figure 2B). In addition, VDAC2 was increasingly expressed along with disease progression (Figure S2B).
FIGURE 1.

(A) Flow chart of bioinformatic analysis. (B) Differentially expressed ferroptosis‐related genes between tumor and adjacent normal tissue in TCGA database. (C) Forrest plot demonstrates that a total of 49 ferroptosis‐related genes were identified as prognosis related by univariate cox analysis(p < 0.05). (D) PPI network showing interaction among proteins coded by those genes. (E) LASSO regression with tenfold cross‐validation. (F) LASSO coefficients profiles of 49 prognosis‐related genes. Abbreviations: LASSO, least absolute shrinkage and selection operator; PPI, protein‐protein interaction, TCGA, The Cancer Genome Atlas
FIGURE 2.
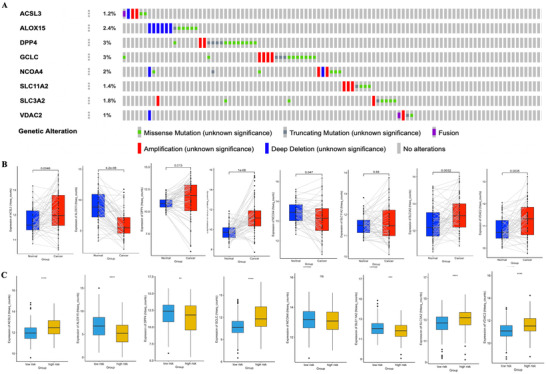
(A) Waterfall map of somatic alteration of eight hub genes from cBioPortal, each grey bar represents one patient. Data of patients without alteration were partly truncated due to page space limitation. (B) Sample‐matched analysis with Wilcox‐test. (C) Differential analysis between low‐ and high‐risk group. *p < 0.05, **p < 0.01, ***p < 0.001. Abbreviation: ns, not significant
Patients were then divided into high‐ or low‐risk group according to mean value of risk score. TP53 and KRAS, which were reported to be closely related with ferroptosis, 5 were more frequently mutated in high‐risk group (Table S3). Kaplan Meier (KM)‐plot showed that patients in high‐risk group correlated with a significantly worse overall survival (OS), no matter in overall population (Figure 3A) or subgroup analysis (Figure S1). UCA showed that stage, EGFR mutation status, and risk score were prognosis‐related (Figure 3B); multivariate cox analysis (MCA) revealed that stage and risk score were independent predictive factors for OS (Figure 3C). Time dependent receiver operating curves (tROCs) showed that risk score has a maximum area under curve (AUC) of 0.7439144 at 1‐year (Figure 3D).
FIGURE 3.

(A‐D) Prognosis analysis of eight‐genes signature in TCGA. (E‐H) Validation of the eight genes signature in GSE72094 dataset. (A) KM plot for OS grouped by risk score in whole population. (B) Univariate cox analysis of OS. (C) Multivariate analysis of OS. (D) AUC of tROCs for OS at 1‐year, 3‐year, and 5‐year. (E) KM plot for OS grouped by risk score in validation cohort. (F) Univariate cox analysis of OS in validation cohort. (G) Multivariate cox analysis of OS in validation cohort. (H) AUC of tROCs for OS at 1‐year, 3‐year, and 5‐year in validation cohort. Abbreviations: KM plot, Kaplan‐Meier plot; OS, overall survival; TCGA, The Cancer Genome Atlas
These results were then validated in the external cohort, KM‐plot showed a consisted result as discovery cohort (Figure 3E), UCA indicated stage, KRAS status, and risk score were prognosis‐related (Figure 3F), stage and risk score were then proved to be independent risk factors for OS by MCA, and tROCs showed a max AUC of 0.7176205 for risk score at 1‐year (Figure 3G).
To further investigate underlying mechanism of this prognosis relevance, functional analysis was implemented. Differential‐expressed genes (DEGs) bewteen high‐ and low‐risk patients were identified (Figure 4A), and further KEGG analysis with DEGs mainly enriched in metabolic pathways, for instance steroid hormone biosynthesis, fat digestion, and absorption (Figure 4B). GO enrichment mainly enriched in ion transportation and leukotriene metabolism pathways (Figure 4C). Immuno‐infiltration status deconvolution by single sample gene set enrichment analysis (ssGSEA) (Table S4) showed high‐risk patients were associated with a decreased score of type I and II T helper cell, immature and activated dendritic cell, and effector memory CD8 T cell (Figures 4D and 4E); gene set variation analysis showed decreased score of antigen processing and presentation pathway in high‐risk patients, which is consistent with ssGSEA results (Figure 4F), and pathways related to glutathione metabolism, steroid biosynthesis, sphingolipid metabolism, and chemokine signaling were also varied in two groups.
FIGURE 4.
Functional analysis. (A) Volcano plot of differential expressed genes between high‐ and low‐risk patients. (B) Top 10 KEGG pathways enriched. (C) Top 10 GO pathways enriched. (D) ssGSEA score heatmap of immune infiltration in LUAD samples from TCGA. (E) ssGSEA score of 28 immune cells grouped by risk score. (F) GSVA score for KEGG pathways grouped by high and low risks. Only data with significance that is p < 0.05 were showed here due to space limitation. (G) Transcription factors of ferroptosis‐related genes predicted by RcisTarget. From left to right: Recovery curve of the gene‐set on the motif ranking; regulating network of TF; motif sequence diagram. More motifs could be seen in Figure S1. (H) Volcano plot of correlation between hub gene expression and drug response AUC value in LUAD cell lines. p < 0.05 and Pearson correlation coefficient > 0.4 were considered significantly correlated, and a negatively correlation means higher expression of this gene was correlated with better response (smaller response AUC value). *p < 0.05, **p < 0.01, ***p < 0.001. Abbreviations: AUC, area under curve; GO, gene ontology; GSVA, gene set variation analysis; KEGG: Kyoto Encyclopedia of Genes and Genomes; LUAD, lung adenocarcinoma; ssGSEA, single sample gene set enrichment analysis; TF, transcription factor


RcisTarget, 6 an R package usually used in single‐cell transcriptome data, was then applied on 274 ferroptosis‐related genes to identify potential transcription factors (TFs). A total of 74 potential TFs were identified, and five TFs with maximum AUCs were annotated as Erythroid Derived 2 Like Protein 2, Nuclear Factor‐Erythroid 2, MAF BZIP Transcription Factor K, Activating Transcription Factor 4, and CCAAT Enhancer Binding Protein Gamma, respectively (Figures 4G and S3). Then we carried out integrated analysis of transcriptome data from cancer cell line encyclopedia and drug response data (response AUC value) from cancer therapeutics response portal respectively to identify potential candidate drugs for risky genes in our signature (Figure 4H). Interestingly, Tozasertib (an Aurora Kinase inhibitor) and PHA‐665752 (a c‐MET inhibitor) were found strongly correlated with both GCLC and SLC3A2 expression, as well as VDAC2, although not statistically significant (p > 0.05).
In conclusion, novel ferroptosis‐related prognosis‐related molecules for LUAD have been identified, a novel eight‐gene signature was constructed and validated, prove to have good capacity in predicting OS in LUAD. Functional analysis showed that immune‐related pathways may be involved in the regulation of ferroptosis. Potential TFs regulating ferroptosis and several candidate drugs targeted the risk gene were identified. Our findings could provide hints for further study and warrant further research on ferroptosis as a functional and therapeutic target in LUAD.
ETHICS APPROVAL AND CONSENT TO PARTICIPATE
All the data involved were publicly available, so the ethics approval was waived. The authors are accountable for all aspects of the work in ensuring that questions related to the accuracy or integrity of any part of the work are appropriately investigated and resolved.
CONFLICT OF INTEREST
The authors declare no conflict of interest.
DATA AVAILABILITY STATEMENT
All the data involved were publicly available on https://cancergenome.nih.gov/ and https://www.ncbi.nlm.nih.gov.
Supporting information
Figure S1 (A‐E) KM‐plot for OS in different subpopulation of TCGA patients
Figure S2 Expression pattern of modeling genes
Figure S3 Representative motifs enriched by RcisTarget
Supplementary materials including Table S1‐S4 and Figure S1‐12 were uploaded separately due to space limitation.
Table S1 Full List of Ferroptosis‐Related Genes
Table S2 Summary of eight genes selected for modeling
Table S3 Clinical characteristics of patients in low‐ and high‐risk group
Table S4 Immune‐Infiltration gene set for ssGSEA
Funding information
This work is supported by Zhongyuan Science and Technology Innovation Leading Talents Program (grant number: 194200510021) and National Natural Science Foundation of China (grant number: 81670091).
REFERENCES
- 1. Bray F, Ferlay J, Soerjomataram I, et al. Global cancer statistics 2018: GLOBOCAN estimates of incidence and mortality worldwide for 36 cancers in 185 countries. CA Cancer J Clin. 2018;68:394–424. [DOI] [PubMed] [Google Scholar]
- 2. Boumahdi S, de Sauvage FJ. The great escape: tumour cell plasticity in resistance to targeted therapy. Nat Rev Drug Discov. 2020;19:39–56. [DOI] [PubMed] [Google Scholar]
- 3. Dixon SJ, Lemberg KM, Lamprecht MR, et al. Ferroptosis: an iron‐dependent form of nonapoptotic cell death. Cell. 2020;149:1060–1072. [DOI] [PMC free article] [PubMed] [Google Scholar]
- 4. Jiang L, Kon N, Li TY, et al. Ferroptosis as a p53‐mediated activity during tumour suppression. Nature. 2015;520:57–62. [DOI] [PMC free article] [PubMed] [Google Scholar]
- 5. Hassannia B, Vandenabeele P, Anden BT. Targeting ferroptosis to iron out cancer. Cancer Cell. 2019;35:830–849. [DOI] [PubMed] [Google Scholar]
- 6. Aibar S, González BCB, Moerman T, et al. SCENIC: single‐cell regulatory network inference and clustering. Nat Methods. 2017;14:1083–1086. [DOI] [PMC free article] [PubMed] [Google Scholar]
Associated Data
This section collects any data citations, data availability statements, or supplementary materials included in this article.
Supplementary Materials
Figure S1 (A‐E) KM‐plot for OS in different subpopulation of TCGA patients
Figure S2 Expression pattern of modeling genes
Figure S3 Representative motifs enriched by RcisTarget
Supplementary materials including Table S1‐S4 and Figure S1‐12 were uploaded separately due to space limitation.
Table S1 Full List of Ferroptosis‐Related Genes
Table S2 Summary of eight genes selected for modeling
Table S3 Clinical characteristics of patients in low‐ and high‐risk group
Table S4 Immune‐Infiltration gene set for ssGSEA
Data Availability Statement
All the data involved were publicly available on https://cancergenome.nih.gov/ and https://www.ncbi.nlm.nih.gov.