

Abstract
Mapping open chromatin regions has emerged as a widely used tool for identifying active regulatory elements in eukaryotes. However, existing approaches, limited by reliance on DNA fragmentation and short-read sequencing, cannot provide information about large-scale chromatin states or reveal coordination between the states of distal regulatory elements. We have developed a method for profiling the accessibility of individual chromatin fibers, a single-molecule long-read accessible chromatin mapping sequencing assay (SMAC-seq), enabling the simultaneous, high-resolution, single-molecule assessment of chromatin states at multikilobase length scales. Our strategy is based on combining the preferential methylation of open chromatin regions by DNA methyltransferases with low sequence specificity, in this case EcoGII, an N6-methyladenosine (m6A) methyltransferase, and the ability of nanopore sequencing to directly read DNA modifications. We demonstrate that aggregate SMAC-seq signals match bulk-level accessibility measurements, observe single-molecule nucleosome and transcription factor protection footprints, and quantify the correlation between chromatin states of distal genomic elements.
In eukaryotes, open chromatin regions are associated with regulatory elements, such as enhancers, promoters and insulators. This property is highly useful for identifying candidate regulatory elements (cREs) and for understanding the functional organization of genomes. That regulatory elements exhibit greatly increased sensitivity to nuclease cleavage was already noted four decades ago1–3. Subsequent advances in microarray4,5 and DNA sequencing technologies6,7 enabled DNAse hypersensitivity-based mapping of cREs genome-wide. Similarly, digestion of DNA is inhibited by nucleosomes, and micrococcal nuclease sequencing (MNase-seq) is widely used to map nucleosome positioning8. More recently, the Tn5 transposase was adapted as a probe for chromatin accessibility (assay for transposase-accessible chromatin-sequencing, or ATAC-seq)9. However, while short-read-based assays can map cREs and positioned nucleosomes, they provide little insight into the long-range physical organization of individual chromatin fibers as they remove linkage between distal segments.
We developed single-molecule long-read accessible chromatin mapping sequencing (SMAC-seq), a single-molecule method that directly assays both open chromatin regions and nucleosome positioning within a single chromatin fiber at multikilobase scales. We use SMAC-seq to study chromatin architecture and coaccessibility states in the yeast Saccharomyces cerevisiae. We assess the degree of coordination between positions of nearby nucleosome particles, enumerate mutually exclusive regulatory states along individual loci and observe coordinated changes in nucleosome positioning and chromatin accessibility on transcriptional activation. SMAC-seq allows for footprinting of transcription factor occupancy, and provides strand-specific information about the exposure of DNA occupied by nucleosomes. We expect future applications of, improvements on and extensions of the SMAC-seq approach to enable new insights into the dynamics of chromatin states in a wide variety of experimental systems.
Results
SMAC-seq maps chromatin accessibility and nucleosome positioning at the multikilobase scale.
SMAC-seq is built on the conceptual foundations of NOMe-seq/dSMF10–12. These methods rely on preferential modification of accessible DNA with M.CviPI and/or M.SssI (GpC/CpG-specific 5mC methyltransferases), followed by bisulfite conversion and Illumina-based sequencing readout (both enzymes can be used in the absence of endogenous 5mC methylation). We use the m6A methyltransferase EcoGII (ref. 13) as an alternative/addition to CpG/GpC, and use nanopore sequencing to generate single-molecule readouts of accessibility states over many kilobases (Fig. 1a). Nanopore sequencing allows direct detection of these modifications14,15, enabling the generation of methylation maps for individual DNA molecules, which can then be interpreted in terms of chromatin accessibility.
Fig. 1 |. The SMAC-seq assay for profiling chromatin accessibility and nucleosome positioning at the multikilobase scale.

a, Outline of the SMAC-seq assay. Intact chromatin is treated with m6A and CpG and GpC 5mC methyltransferases, which preferentially methylate DNA bases in open chromatin regions. High molecular weight (HMW) DNA is then isolated and subjected to nanopore sequencing, and methylated bases are used to reconstruct the open chromatin state within individual molecules. b-h, SMAC-seq faithfully captures chromatin accessibility around promoters and positioned nucleosomes in S. cerevisiae. b, MNAse-seq and dSMF profiles around chemically mapped positioned nucleosome dyads. c, DNAse-seq and dSMF profiles around the top 20% highly expressed genes in S. cerevisiae. d, DNAse-seq and dSMF profiles around the bottom 20% expressed genes in S. cerevisiae. RPM, reads per million (c,d). e, Average SMAC-seq profile around chemically mapped positioned nucleosomes dyads (shown is the ‘diamide 0 min rep2’ sample). f, Average SMAC-seq profile around the top 20% highly expressed genes in S. cerevisiae. g, Average SMAC-seq profile around the bottom 20% expressed genes in S. cerevisiae. TSS, transcription start site (f,g). h, SMAC-seq correlates closely with both DNAse-seq and nucleosome occupancy profiling at the level of individual loci and provides a combined readout of accessibility and nucleosome positioning. Shown is the aggregate SMAC-seq signal along the genome (aggregated over 50-bp windows sliding every 5 bp; see Methods for details), together with DNAse-seq, nucleosome chemical mapping data and transcriptional activity (measured by PRO-seq and PRO-cap). Large aggregate SMAC-seq signal enrichments match closely with DNAse accessibility peaks, while smaller aggregate SMAC-seq peaks are inversely correlated with positioned nucleosomes. i, SMAC-seq profiles chromatin accessibility in repetitive regions of the genome that are ‘invisible’ to short reads. The telomeric region of chrXVI is shown.
The addition of an m6A signal associated with accessible chromatin substantially improves both the resolution and applicability of SMAC-seq. Many genomes are endogenously methylated at 5mC positions16,17, usually in CpG contexts, but not always18, confounding CpG/GpC-based accessibility measurements. More importantly, CpG/GpC dinucleotides are rare. The average resolution achieved by combining the two methyltransferases is >10 base pairs (bp) in Drosophila melanogaster and ~15 bp in yeast. It is ~25 bp for GpC alone in mammals, and these are averages; in practice, many individual regions either completely lack or contain too few informative positions. Using m6A increases SMAC-seq’s resolution down to a theoretical limit of ~3 bp in all model organisms, and ensures proper coverage over all individual loci (Supplementary Figs. 1–12).
We initially developed the method in S. cerevisiae as it has no endogenous DNA methylation and has a small genome (~12 million bp), enabling very high sequencing coverage. To verify the specificity and efficiency of enzymatic treatments, we carried out both dSMF experiments on chromatin and M.CviPI + M.SssI + EcoGII reactions on naked DNA (genomic DNA), followed by bisulfite sequencing. We observe ≥95% CpG/GpC methylation for gDNA, ≤10% for chromatin and ~0% on untreated gDNA (Supplementary Fig. 13). Comparing dSMF to DNAse-seq and MNase-seq profiles around TSSs and positioned nucleosomes19 revealed the expected nucleosome depletion/occupancy patterns (Fig. 1b–d).
EcoGII’s methylation efficiency is more difficult to estimate as fully methylated templates are known to be difficult to sequence on the Oxford Nanopore platform. Using yeast gDNA or λ DNA treated with a high dose of EcoGII (Supplementary Table 1), the limited number of observed reads exhibited ~50% methylation levels (Supplementary Figs. 14 and 15). We hypothesize these rates are underestimates, as biochemical reports suggest ≥50% methylation of gDNA after 5 min, increasing to ≥85% after an hour13.
We next applied SMAC-seq to unsynchronized S. cerevisiae cells. We obtained reads with a median length ~1.5 kilobase pairs (kbp) from this initial experiment, allowing the capture of multiple promoter regions for much of the yeast genome (Supplementary Figs. 16 and 17). We applied the Tombo20 algorithm (running on top of the Minimap aligner21) for ‘resquiggling’ of raw nanopore signal and general methylated base calling. We also analyzed our initial dataset with Nanopolish14, an alternative algorithm for identifying 5mC events in CpG/GpC context.
Unlike Illumina-based bisulfite sequencing, nanopore-based measurements of DNA methylation provide methylation probabilities. While per-base methylation probabilities are skewed toward 0 or 1, a substantial fraction lie in between those extremes (Supplementary Fig. 18). We examined multiple approaches for binarizing methylation calls within single molecules to identify the optimal strategy in terms of signal-to-noise ratio (Supplementary Figs. 19 and 20). We compared average SMAC-seq profiles to dSMF, MNase-seq and DNAse-seq, as well as chromatin immuno-precipitation sequencing (ChlP-seq) for RNA Polymerase (Pol2) and transcription initiation factors around known chromatin features (Fig. 1e–g and Supplementary Figs. 21–23). SMAC-seq faithfully reproduces nucleosomal positioning throughout the genome and nucleosome depletion around promoters. We also observe positive correlation between average SMAC-seq methylation levels and DNAse/ATAC-seq coverage over promoter regions (Supplementary Fig. 24). SMAC-seq has a larger observed dynamic range than dSMF data (possibly due to higher long-read mapping efficiency). Based on dSMF and untreated gDNA data, we estimate the false positive rate of methylation base calling to be ~20% for Tombo and 10–15% for Nanopolish (Supplementary Figs. 14 and 25). We also examined potential sequence biases inherent to the combination of methylation enzymes and base calling algorithm. We find only modest differences in methylation levels for different k-mers (≤two-fold for k = 6; see Supplementary Figs. 26 and 27).
In practice, the biologically relevant scale of chromatin accessibility is larger than an individual base. We thus reasoned that sharing methylation information between adjacent bases should improve the reliability of accessibility measurements, and developed a Bayesian procedure to aggregate methylation probabilities and derive single-molecule accessibility calls over windows of arbitrary size (thereafter referred to as the ‘aggregate’ signal).
We observed a relatively small subpopulation of reads highly methylated over large segments (Supplementary Fig. 28 and Fig. 2a), which we interpret as originating from naked DNA molecules likely from dead cells. As such reads can confound many analyses, we filter these out (Supplementary Fig. 29). However, at certain loci chromatin is indeed largely nucleosome-free in vivo; for such unique loci, we analyze all reads.
Fig. 2 |. SMAC-seq provides a single-molecule linked-read view of the chromatin landscape.
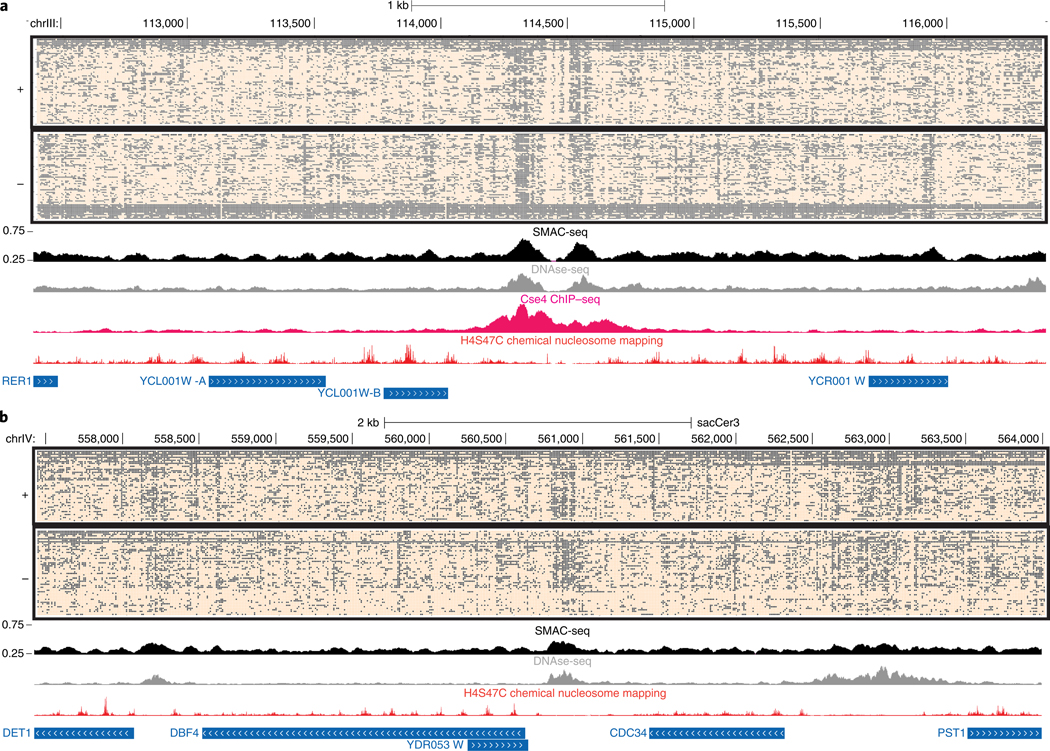
a, Unfiltered nanopore reads fully spanning the 4-kb neighborhood of the centromere of S. cerevisiae chrlll (aggregate signal from Sample 1). b, Unfiltered nanopore reads fully spanning a 6.6-kb neighborhood encompassing several genes on chrlV (aggregate signal from Sample 1). In both cases, accessibility is shown at 10-bp resolution (see Methods section for details) for the single-molecule display, and aggregated over sliding (every five bases) 50-bp windows for the average SMAC-seq track.
We then compared average SMAC-seq profiles against positioned nucleosomes, DNAse-seq and transcriptional activity maps at the level of individual genomic loci (Fig. 1h). Qualitatively, we observe that large SMAC-seq peaks match very closely with DNAse-seq peaks, while smaller SMAC-seq ‘bumps’ inversely correlate with positioned nucleosomes, consistent with labeling of linker DNA. Thus, SMAC-seq simultaneously identifies both open chromatin regions and positioned nucleosomes.
The long nanopore reads allow SMAC-seq to map accessibility for the whole yeast genome (Supplementary Fig. 30). For example, SMAC-seq maps chromatin and nucleosomes in the repetitive telomere of chrXVI (Fig. 1i), which contains several active promoters and numerous well-positioned nucleosomes. SMAC-seq also revealed open chromatin peaks around the promoters of multiple transposable elements (Supplementary Fig. 31).
SMAC-seq provides single-molecule accessibility profiles on individual chromatin fibers.
To demonstrate SMAC-seq’s ability to map open chromatin within individual long molecules we investigated all reads spanning the 4-kb neighborhood around the chrlll centromere (Fig. 2a). Yeast centromeres are specified by precisely defined sequence elements and are occupied by a single nucleosome containing the H3 histone variant Cse4, thought to be nearly perfectly positioned22,23. We indeed observe strong nucleosomal positioning using SMAC-seq, with nearly all individual reads exhibiting the expected nucleosomal pattern. We also observe hints of substructure in the form of accessibility inside the protected centromeric region and potential protection footprints in its immediate vicinity. We find similarly strong positioning for many other centromeric nucleosomes (Supplementary Figs. 32–35). We also examined a ~6.6-kb span of chrIX containing five genes and three open chromatin regions, one of them fairly large and diffuse. In contrast to the more localized accessibility observed elsewhere, this region exhibits considerable accessibility heterogeneity suggesting a complex protein occupancy landscape.
We next asked whether SMAC-seq could reveal binary chromatin accessibility states by investigating ribosomal DNA (rDNA) loci. In yeast, rDNA is organized into multicopy (~150) arrays, each ~9.1 kb unit of which contains a copy of the 35S precursor pre-ribosomal RNA transcribed by Pol I, a 5S RNA transcribed by Pol III and a replication origin ARS (autonomously replicating sequence) element, located in the non-transcribed (NTS) regions of the array. The number of units can vary between cells, and the sac-Cer3 genome assembly only contains a single locus with two array copies. The rDNA chromatin structure adopts two distinct conformations24–26; an inactive nucleosomal state and a state largely devoid of nucleosomes due to extremely high transcription activity25,27,28. The two states are estimated to exist in roughly equal proportions in normally growing cells29. However, other studies have alternatively suggested that nucleosomes are present over actively transcribed rDNA arrays29. Of note, rDNA indeed appears to be extremely accessible in short-read assays; around half of reads in a typical yeast ATAC-seq dataset originate from rDNA arrays (Supplementary Fig. 36). Single-molecule SMAC-seq maps reveal a striking picture of the two alternative, mutually exclusive rDNA states (Fig. 3a). About a quarter of full-length molecules exhibit near-full accessibility over the 35S transcript, but not in the NTS; the rest show a typical nucleosomal state. A broadly similar picture is observed in all samples (Supplementary Figs. 37–40). We note that it is possible that the two states are differentially represented due to biases against fully methylated long reads, as we observe the fully accessible fraction in approximately 50% of molecules over shorter windows around the 35S promoter (Fig. 3c). We also observe a region of localized accessibility just upstream of the 35S transcriptional unit present only in the nucleosomal subpopulation, suggesting the possibility of a regulatory switch at this location. Finally, we also observe at least two previously unreported regions inside 35S exhibiting strong accessibility in the nucleosome-protected fraction (Fig. 3a).
Fig. 3 |. SMAC-seq’s single-molecule readout provides insights into the distribution and relationship between mutually exclusive chromatin yeast rDNA states.
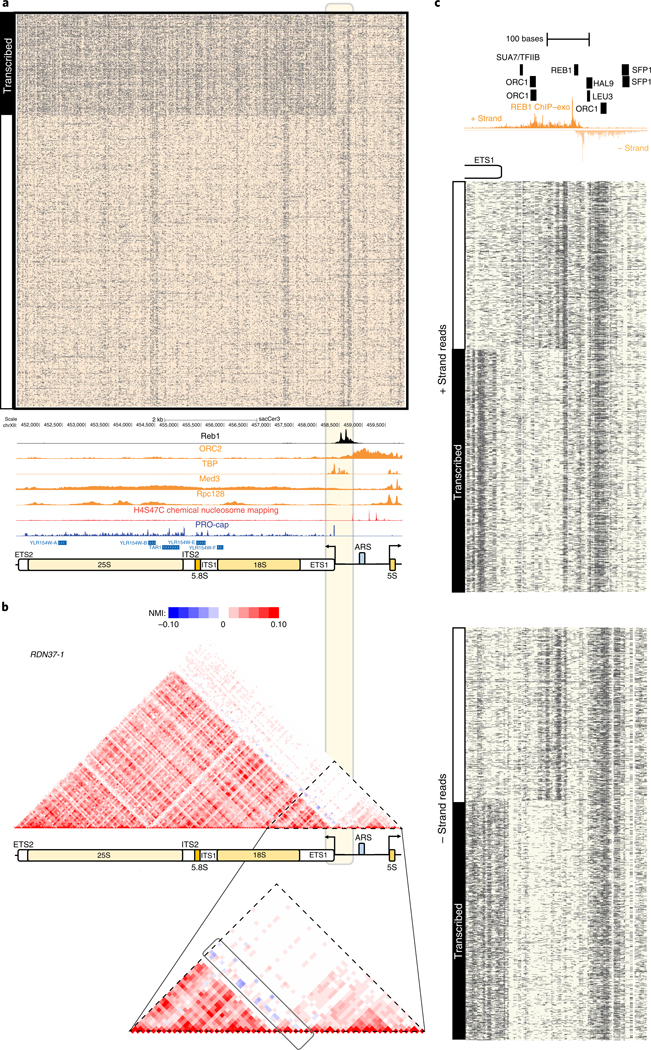
a, SMAC-seq reveals the distribution of alternative chromatin states of rDNA arrays. Shown are all reads covering the RDN37–1 array in the RDN1 locus in the ‘diamide 30 min repV experiment (unfiltered reads, aggregate signal). See Supplementary Figs. 37–40 for additional details. ChlP-seq and ChIP-exo tracks were generated by including and normalizing all multimappers rather than the usual unique-only policy (see the Methods section for more details). The light-yellow box highlights the 35S TSS region, which contains the element anticorrelated with the transcribed state of the rDNA array. b, NMI profiles for the RDN37–1 array show anticorrelation between the accessibility peaks immediately upstream of the 35S TSS and the nucleosome-free state over the 35S transcriptional unit. Top panel shows the whole locus, bottom panel zooms in on the vicinity of the 35S TSS. c, High-resolution SMAC-seq profiles reveal regulatory protein footprints in the immediate vicinity of the 35S TSS and the Reb1 binding site in the rDNA NTS region (shown are 3,000 randomly sampled reads using 10-bp aggregate SMAC-seq signal at 1-bp resolution).
To quantify (anti)correlation between chromatin states, we developed a modified normalized mutual information (NMI) metric for assessing the degree of accessibility correlation between genomic regions. NMI analysis of rDNA confirmed the inverse correlation between the active 35S state and accessibility of this upstream element (Fig. 3b).
What factors might be driving this observed chromatin state switch? Silencing of yeast rDNA is thought to be mediated by the Sir2-containing RENT complex30, and a NTS1 Reb1 binding site has been suggested to recruit corepressors29. We took a higher-resolution view of NTS1 by integrating SMAC-seq, Reb1 ChIP-exo data and transcription factor motif maps. We find a clear pattern of protection around the Reb1 motif, concordant with ChIP-exo (Fig. 3c), and we also observe patterns consistent with footprinting for several other transcription factors. However, the anticorrelated accessibility profile seems to not be exclusively associated with Reb1 binding but rather with the region closer to the 35S TSS. Thus, it appears that other proteins may be responsible for establishing this state.
SMAC-seq provides a high-resolution strand-specific view of protein occupancy on DNA.
We next asked whether SMAC-seq can generally identify transcription factor footprints (Supplementary Fig. 41). Averaging genome-wide SMAC-seq profiles over occupied motifs revealed strong protection footprints for several factors, such as Reb1, Rap1 and ORC1 (Fig. 4a,b and Supplementary Fig. 42). We observed high concordance between footprint profiles observed using DNAse-seq, ATAC-seq and SMAC-seq with footprints identified previously by high-resolution DNAse-seq7 in aggregate and at some individual sites (Supplementary Figs. 43–50). However, we did not observe strong footprinting for all transcription factors (that is, Abf1 and Cbf1; see Supplementary Fig. 42) even though some do exhibit DNAse-seq footprints7, perhaps because different enzymes vary in their ability to access DNA in the context of protein occupancy.
Fig. 4 |. SMAC-seq provides a high-resolution strand-specific view of genomic occupancy by DNA-binding proteins and complexes.
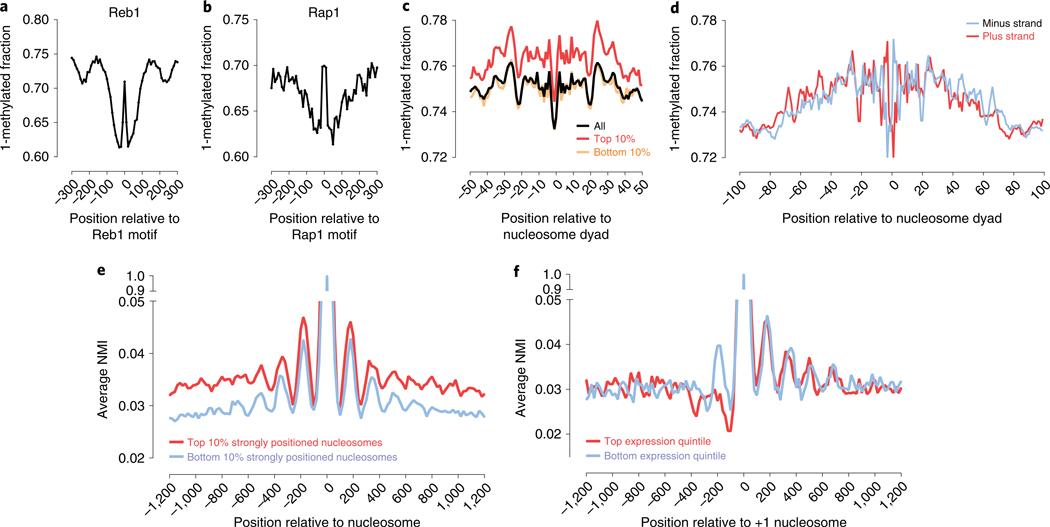
a,b, SMAC-seq allows for footprinting of transcription factor binding events. Shown is aggregate genome-wide SMAC-seq signal around occupied (as measured by ChIP-exo) Reb1 (a), and Rap1 (b) sequence recognition motifs. c, SMAC-seq profiles around positioned nucleosome dyads reveal increased accessibility in the dyad and increased protection at the points of contact with the nucleosome (see Supplementary Fig. 23 for additional details). d, SMAC-seq provides a strand-specific view of nucleosome occupancy and reveals differential accessibility between the two DNA strands depending on their position on the nucleosomal particle. e,f, Coordination between the positions of individual nucleosomes at the level of single chromatin fibers. e, The average NMI between each strongly or poorly positioned nucleosome in the yeast genome and its immediate genomic neighborhood (measured for windows of 10 bp length tiling at every genomic position centered on the nucleosome dyad). f, The average NMI between each +1 nucleosome and its immediate genomic neighborhood in highly expressed and in mostly silent genes (measured for windows of 10-bp length tiling at every genomic position centered on the +1 nucleosome dyad).
To further explore SMAC-seq’s resolution limits, we studied methylation patterns around positioned nucleosomes in more detail (Fig. 4c,d and Supplementary Fig. 23). We observe a marked increase in accessibility signal at the dyad point, in contrast to the points of contact with DNA two helical turns away. The same pattern was observed for all nucleosomes irrespective of positioning strength. We did not observe similar patterns in deep DNAse-seq data (Supplementary Fig. 23e). We next quantified strand-specific DNA accessibility within nucleosomes, and observe a strandasymmetric DNA accessibility pattern around the nucleosome particle (Fig. 4d), especially within the dyad and at the points two helical turns away. The magnitude of these differences is similar to that observed between nucleosomes and flanking linker regions. This heterogeneity in methylation potential within the nucleosome may inform the manner by which transcription factors might interact with nucleosome-associated DNA in vivo31. We also note that these patterns are most clearly observed using m6A (Supplementary Fig. 51).
SMAC-seq reveals chromatin coaccessibility patterns.
We next examined coaccessibility patterns in the yeast genome by assessing nucleosome positioning correlations. Average NMI profiles centered on positioned nucleosomes reveal detectable correlation between nucleosome positions up to three to four nucleosomes away (Fig. 4e and Supplementary Fig. 52), with strongly positioned nucleosomes exhibiting stronger overall correlation. These observations are consistent with nucleosomes imposing restrictions on one another, resulting in short-range correlation between protection footprints that dephases over longer ranges. We next measured coaccessibility in the vicinity of promoters (Fig. 4f). Active yeast TSSs are characterized by an upstream nucleosome-depleted/free region (NFR) and a well-positioned +1 nucleosome. NMI profiles centered on the latter show marked differences between expressed and inactive genes. While correlation decays downstream of the TSS similarly for both groups, active genes exhibit an inverse correlation pattern upstream of the TSS.
Active yeast genes often exist in a looped conformation, with promoter and termination regions in physical proximity, an arrangement thought to help enforce transcriptional directionality32,33. We wondered whether accessibility would be correlated between the two gene ends. SMAC-seq reveals low levels of correlation between the NFR and 3’ gene ends, and a stronger correlation between positioned nucleosomes in these locations (Supplementary Fig. 53). The correlation between the NFR and 3’ ends increases for active genes and decreases for silent genes, indicating that transcriptional activity and/or looping may help more strongly position nucleosomes at the two gene ends.
We next assessed coordinated accessibility between yeast TSSs. To this end, we devised an explicit test of coordinated coaccessibility based on splitting reads into separate pieces, randomly reassembling them, then deriving an empirical coaccessibility distribution. We identified 1,115 TSS pairs as significantly correlated (out of 19,578 pairs covered with ≥100 reads; Supplementary Fig. 54). Of these, 560 were located ≥1 kb from each other (for example, see Supplementary Fig. 55). One possible mechanism for this correlated accessibility signal is increased frequency of physical association in three-dimensional space. Analysis of Micro-C data34 shows that significantly coaccessible promoters interact more frequently than non-coaccessible ones at a similar distance (Supplementary Fig. 56).
SMAC-seq charts coordinated accessibility changes during the yeast stress response.
Finally, we carried out SMAC-seq during a time course of diamide treatment, to monitor chromatin states during a dynamic response to an external stress. Diamide oxidizes thiols in proteins, leading to activation of the stress response pathway and changes in the expression of hundreds of genes35. Yeast stress response is largely mediated by the Hsf1 and Msn2/4 transcription factors36.
We performed SMAC-seq at 0, 30 and 60 min after diamide treatment, as well as RNA-seq, ATAC-seq and ChlP-seq for Pol2, the elongating Pol2pS2 version, and HSF1 (RNA and ATAC data were also collected at 15 and 45 min; see Fig. 5a). We observe several hundred genes exhibiting strong expression changes (Supplementary Fig. 57), and strong Hsf1 occupancy induction at hundreds of sites (Supplementary Fig. 58). SMAC-seq at 30 min shows strong footprinting over Hsf1 motifs within induced Hsf1 binding sites.
Fig. 5 |. Coordinated changes in chromatin accessibility and nucleosomal occupancy during the yeast stress response.

a, Experimental outline. Yeast cells were treated with diamide, then SMAC-seq and other functional genomic assays were carried out at 15- or 30-min intervals. b, Sites occupied by the HSF1 transcription factor upon its activation by the stress response pathway exhibit strong footprints in SMAC-seq data. c, Changes in the expression of the TMA10 gene on diamide treatment (FPKM, fragments per kilobase per million). d, Changes in RNA polymerase and HSF1 occupancy (measured by ChIP-seq), and of chromatin accessibility at the single-molecule level in the vicinity of the TMA10 gene during the diamide time course. e, Changes in RNA polymerase and HSF1 occupancy (measured by ChIP-seq), and of chromatin accessibility at the single-molecule level in the vicinity of the HSP26 gene during the diamide time course. f, Decrease in the fraction of transcribed rDNA arrays as a result of cellular response to diamide treatment. Shown is SMAC-seq signal around the 35S rDNA TSS region, as also shown in Fig. 3c.
We illustrate the dynamic accessibility patterns we observe upon diamide treatment using the TMA10 and HSP26 genes in Fig. 5d,e, and multiple others in Supplementary Figs. 59–67. TMA10 and HSP26 are strongly upregulated at 15 min; TMA10 expression subsequently declines and stabilizes (Fig. 5c) while HSP26 only declines at 60 min. SMAC-seq reveals a relatively modest level of upstream accessibility before diamide treatment. However, at 30 min and after Hsf1 binding, dramatic changes are evident. Nearby nucleosomes are evicted in many cells, and nucleosome depletion increases within gene bodies, where RNA Pol2 ChIP–seq shows highly active transcription. At 60 min, this response dampens for TMA10, with the fraction of accessible reads decreasing; the effect is less pronounced for HSP26 whose expression remains relatively higher. NMI coaccessibility maps (Supplementary Figs. 59–68) frequently show loss of correlation between positioned nucleosomes within and upstream of activated gene bodies as a result of diamide response, consistent with increased nucleosome movement due to the activity of polymerases and chromatin remodelers. Aggregate SMAC-seq observations were largely corroborated by matched ATAC-seq on the same samples (Supplementary Figs. 69–70). We also examined the response to diamide treatment of the rDNA locus and observed a decrease in the transcribed rDNA array fraction (Fig. 5f), consistent with decreased rDNA transcription after activation of the stress response program.
Discussion
SMAC-seq is a single-molecule method for profiling chromatin accessibility within individual chromatin fibers on a multikilobase scale using nanopore sequencing. SMAC-seq generates accessibility signals similar to widely used short-read methods while enabling the simultaneous profiling of nucleosome positioning and accessible chromatin on a truly genome-wide scale, the measurement of the underlying distribution of accessibility states, and the identification of loci exhibiting significant coaccessibility.
Extending SMAC-seq to larger genomes will require substantially increased sequencing throughput, or selective enrichment of individual loci. Fortunately, nanopore throughput is increasing rapidly, while selective enrichment methods are also becoming available37. Increases in read length will also be useful, especially for assaying coaccessibility of distal regulatory elements, which can often be tens of kilobases apart in mammalian genomes.
Base calling is another area of future improvement. One hurdle for the creation of more accurate base callers is the lack of ground truth controls for training base calling algorithms (that is, pools of DNA templates with individual modifications in well-defined yet highly diverse sequence contexts). Alternatively, the use of tags bulkier than a methyl group38 may provide much stronger modulation of the current passing through the nanopore, enabling more reliable signal identification. We also anticipate a diversity of DNA modifying enzymes available to carry out SMAC-seq variations.
Endogenous methylation in mammalian genomes also represents potentially confounding signal. To evaluate the scale of this concern, we generated low-coverage SMAC-seq data for human GM12878 cells using only EcoGII, and examined aggregate ‘m6ASMAC’ profiles around CTCF sites, open chromatin regions and TSSs. We recovered the expected features of chromatin accessibility (strong nucleosome positioning around CTCF sites39, accessibility peaks around all three features) and observed no significant difference between SMAC-seq profiles generated by filtering out A positions nearby CpGs, demonstrating that interference from endogenous methylation is not a major concern (Supplementary Figs. 71–73).
However, there are also species where m6A occurs endogenously and is strongly correlated with chromatin accessibility and nucleosome positioning40–42. Modifications such as 4mC43 (N4-methylcytosine), cytidine deamination44 or 5-hydroxymethyluracil45 are among the potential future alternatives in such cases. Finally, we believe that the integration of SMAC-seq with other measurements of the physical genome and the epigenome into single-molecule multiomic assays represents a potentially fruitful direction. We envision the possibility of simultaneous single-molecule, multikilobase-scale measurements of accessibility, nucleosomal positioning, endogenous DNA methylation, protein occupancy, chromatin interactions and/or DNA replication. In principle, similar approaches may also be applicable to individual RNA molecules. We expect long-read single-molecule approaches to provide an important new class of tools for the study of the functional and physical organization of genomes.
Online content
Any methods, additional references, Nature Research reporting summaries, source data, extended data, supplementary information, acknowledgements, peer review information; details of author contributions and competing interests; and statements of data and code availability are available at https://doi.org/10.1038/s41592–019-0730–2.
Methods
Except for when explicitly stated otherwise, all analyses were carried out using custom-written Python or R scripts (available on request).
Cell lines and cell culture.
The BY4741 S. cerevisiae strain (a gift from J.-P. Wang and X. Wang) was used for all experiments except for Hsf1 ChIP-seq experiments where MS143 (H4S47C_Hsf1-V5::HphMX6, this study) was used. MS143 was generated by PCR-based C-terminal tagging of Hsf1 with the V5 epitope. Hsf1-V5 tagging was confirmed by colony PCR and western blotting. For all experiments, except the initial one (‘Sample 1’), cells were grown in YPD media (30 °C) to an approximate optical density (~OD) of 0.8 before collection.
Yeast SMAC-seq experiments.
Enzymatic treatment of chromatin.
We developed and optimized SMAC-seq using the equivalent of 1× 10⁶ human cells, which in the case of S. cerevisiae translates in to 2.5 × 10⁸ (the size of the haploid human genome is ~3 × 10⁹ bp while that of S. cerevisiae is 1.2 × 10⁶ bp). As yeast cells have a cell wall, we adapted the spheroplasting protocol previously used for carrying out ATAC-seq in yeast cells46 for our SMAC-seq experiments.
Yeast cells in log phase (OD660 ≤ 1.0) were first centrifuged at 13,000 r.p.m. for 1 min, then washed with 100 μl of sorbitol buffer (1.4 M sorbitol, 40 mM HEPES-KOH pH 7.5, 0.5 mM MgCl2) and centrifuged again at 13,000 r.p.m. for 1 min. Cells were then spheroplasted by resuspending in 200 μl of sorbitol buffer with DTT added at a final concentration of 10 mM and 0.5 mg ml−1 100T Zymolase, followed by incubating for 5 min at 30 °C at 300 r.p.m. in a Thermomixer. The pellet was centrifuged for 2 min at 5,000 r.p.m., washed in 100 μl of sorbitol buffer and centrifuged again at 5,000 r.p.m. for 2 min.
Cells were then resuspended in 100 μl of ice-cold nuclei lysis buffer (10 mM Tris pH 7.4, 10 mM NaCl, 3 mM MgCl2, 0.1 mM EDTA, 0.5% NP-40) and incubated on ice for 10 min. Nuclei were then centrifuged at 5,000 r.p.m. for 5 min at 4 °C, resuspended in 100 μl of cold nuclei wash buffer (10 mM Tris pH 7.4, 10 mM NaCl, 3 mM MgCl2, 0.1 mM EDTA) and centrifuged again at 5,000 r.p.m. for 5 min at 4 °C. Finally, nuclei were resuspended in 100 μl of M.CviPI reaction buffer (50 mM Tris-HCl pH 8.5, 50 mM NaCl, 10 mM DTT).
Nuclei were first treated with M.CviPI + EcoGII by adding 200 U of M.CviPI (NEB) and 200 U of EcoGII (NEB), SAM (S-adenosylmethionine) at 0.6 mM and sucrose at 300 mM, and then incubated at 30 °C for 7.5 min. After this incubation, 128 pmol SAM and another 100 U of enzymes were added, and a further incubation at 30 °C for 7.5 min was carried out. Immediately after that, M.SssI treatment followed by adding 60 U of M.SssI (NEB), 128 pmol SAM, MgCl2 at 10 mM and incubation at 30 °C for 7.5 min.
The reaction was stopped by adding an equal volume of Stop Buffer (20 mM Tris-HCl pH 8.5, 600 mM NaCl, 1% SDS, 10 mM EDTA).
High molecular weight DNA isolation.
HMW DNA was isolated using the MagAttract HMW DNA Kit (Qiagen, catalog no. 67563) following the manufacturer’s instructions.
Enzymatic treatment of naked DNA.
Naked DNA was treated under exactly the same conditions as chromatin, except that the reaction volume and enzyme amounts were reduced by half. HMW DNA was purified as described above.
GM12878 cell culture.
The GM12878 human lymphoblastoid cell lines were grown in media containing RPMI1640-GlutaMAX (Life Technologies) supplemented with 10% fetal bovine serum.
GM12878 SMAC-seq experiments.
Briefly, 1 × 10⁶ human GM12878 cells were washed with 1× PBS, then resuspended in 200 μl of ice-cold nuclei lysis buffer (10 mM Tris pH 7.4, 10 mM NaCl, 3 mM MgCl2, 0.1 mM EDTA, 0.5% NP-40) and incubated on ice for 10 min. Nuclei were then centrifuged at 500g for 5 min at 4°C, resuspended in 200 μl of cold nuclei wash buffer (10 mM Tris pH 7.4, 10 mM NaCl, 3 mM MgCl2, 0.1 mM EDTA) and centrifuged again at 500g for 5 min at 4 °C. Finally, nuclei were resuspended in 200 μl of reaction buffer (1× NEB CutSmart buffer, 0.3 M sucrose). Nuclei were then treated with EcoGII by adding 200 U of EcoGII (NEB) and SAM at 0.6 mM, and incubated at 37°C for 10 min. The reaction was stopped by adding 0.2% SDS, and HMW DNA was immediately isolated as previously described.
SMAC-seq analysis.
Nanopore sequencing.
HMW DNA was converted into libraries using the Ligation Sequencing Kit 1D (Oxford Nanopore Technologies, SQK-LSK108) following the manufacturer’s instructions. Nanopore sequencing was carried out on R9.4 MinION flowcells (Oxford Nanopore Technologies) for up to 48 h.
Nanopore base calling.
Nanopore events were converted to DNA sequence using Albacore (v.2.3.3) using default settings. Reads were resquiggled using Tombo20, v.1.3, using the sacCer3 reference genome. Methylated bases were identified using Tombo in the ‘de novo model’ mode.
Aggregation of accessibility information over multibase-pair windows.
Even with the addition of m6A methylation, the resolution of SMAC-seq still does not cover every nucleotide in the genome, and it varies substantially between different locations depending on local sequence content differences. In addition to that, nanopore base calling is still far from being a fully resolved problem, and even more so in methylation-aware mode. For these reasons, for many of the analyses described in this study, we aimed to assign aggregate accessibility scores over windows, taking the totality of the available evidence into account, thus obtaining more reliable, if coarser-grained, views of accessibility patterns along the genome. We used a Bayesian approach to carry out aggregation, as follows.
For a given window of width w in the genome, specified by coordinates c, i, i + w (where c denotes the chromosome and i the leftmost coordinate of the window), and for all reads fully spanning the window, we obtain all Tombo probabilities pr,(c,j) such that for sequence contexts CpG, GpC and A on the corresponding genomic strand. We use a beta prior B(α,β),with α_=_ β =10, which we then updated based on each probability pr,(c,j) for all . The final binary accessibility score pr,(c,i,i+w) for read r and window c, i, i + w is determined by the final state of the prion
Read filtering.
As discussed above, we sometimes observe a population of reads that are fully methylated across their whole length or over large segments of it. There, reads most likely derive from dead cells, as our initial experiment, which was carried out on a very dense yeast population containing a substantial number of dead cells, exhibited a much higher proportion of such reads compared to subsequent experiments using early log-phase cells. To remove such potentially artifactual reads, ‘filtered’ sets of reads were obtained by removing all reads containing a ≥1-kbp stretch that is ≥75% methylated (while also filtering out reads shorter than 1 kb).
Read clustering.
For most analyses presented in this manuscript, the tglkmeans package was used to cluster SMAC-seq reads (implemented in R, https://bitbucket.org/tanaylab/tglkmeans). In addition, the hierarchical clustering implementation in scipy was also used in certain cases.
Coaccessibility assessment using NMI.
To evaluate coaccessibility patterns along the genome, we applied NMI as follows. Each chromosome in the genome c was split into windows of size w. For each such window (c, i, i + w), we identified the maximum range to the right of it, (c,j,j + w) such that the span (c, i,j + w) was covered by ≥M reads. All reads spanning (c, i, j + w) were then extracted and subsampled down to M reads (usually M = 100, unless specified otherwise). Accessibility scores were then aggregated and binarized as described above for all windows located in the span (c, i, j + w), and for all M reads fully spanning it, resulting in a local coaccessibility matrix LCM of size M × (j + w — i)/w. We then calculated NMI scores for each pair of columns LCMk and LCMl, as follows:
| (1) |
MI scores were then normalized and rescaled in the interval (−1,1):
| (2) |
where H refers to the entropy of each individual distribution.
For computational efficiency, local NMI matrices were calculated for even-sized (50 kb) evenly spaced (every 10 kb) tiles of the genome. The entries of the general genome-wide NMI matrix were then calculated as the average of all local NMI matrices containing each entry.
Testing for coordinated accessibility.
Coordinated accessibility was evaluated as follows. For each pair of locations (c, i1 i1 + r1) and (c, i2, i2 + r2) (usually r1 = r2), a minimum number of reads N was required that fully spans the (c, ip i2 + r) interval. All such reads were then obtained for each pair, and then subsampled multiple times down to N reads (so as not to introduce bias in coordinated accessibility tests arising due to differential read coverage between locations closer/further apart). For each subsampling, the fraction of accessible regions p1 and p2 was estimated for each of the two locations using the Bayesian procedure described above, as well as the distribution of joint accessibilities over the four states (0,0), (1,0), (0,1) and (1,1). The two halves of the reads were then virtually split in half and recombined for a total of 103 random combinations. The empirical distribution of the four states was then estimated from these random combinations, . Empirical coordinated accessibility P values were then estimated based on the observed counts . The Bonferroni correction was applied to account for multiple hypothesis testing.
dSMF and bisulfite sequencing.
Illumina measurements of CpG and GpC methylation levels were carried out using the PBAT protocol47 with modifications. HMW DNA (~500 ng) was bisulfite converted using the EZ DNA Methylation-Lightning Kit (Zymo, catalog no. D5030) by mixing 20 μl of purified DNA (~500 ng) with 130 μl of DNA Methylation-Lightning Conversion reagent and incubating at 98 °C for 8 min and then at 64 °C for 60 min. Bisulfite converted DNA was then cleaned up using the EZ DNA Methylation-Lightning Kit following the manufacturer’s instructions.
First-strand synthesis was carried out by mixing 20 μl of bisulfite converted DNA, 19.75 μl of H2O, 5 μl of 10× Blue Buffer (ThermoFisher), 1.25 μl of 10 mM dNTP (NEB) and 4 μl of custom-designed biotinylated adapter. Samples were then incubated at 94 °C for 5 min, and at 4 °C for 5 min, after which 1.5 μl of Klenow (3’ → 5’ exo minus; MCLab) were added, and the reaction was incubated at 4 °C for 15 min, at 37 °C for 90 min and at 70 °C for 5 min. First-strand reaction cleanup was carried out using 50 μl of AMPure XP beads (Beckman Coulter); DNA was eluted 50 μll of EB buffer.
Biotinylated DNA was captured on streptavidin beads. A total of 20 μl of streptavidin Dybaneads M-280 (ThermoFisher) per sample were added to a PCR tube, separated on a magnet and then resuspended in 50 μl of 2× BW(Li) buffer (6.3 g LiCl, 0.5 m; Tris-HCl pH 8.0 and 0.1 ml of 500 mM EDTA for 50 ml total volume), to which the 50 μl of eluted first-strand reaction DNA was added. Beads were then incubated at room temperature for 30 min, washed with 180 μl of 2× BW(Li) buffer, twice with 0.1 N NaOH (by resuspending well and incubating at room temperature for 2 min), washed again with 180 μl of 2μ BW(Li) buffer, then with 180 μl of 10 mM Tris-HC; pH 7.5.
Second-strand synthesis was carried out by resuspending streptavidin beads in the following reaction mix: 5 μl of 10× Blue Buffer, 1.25 μl of 10 mM dNTPs, 39.75 μl of H2O, 4 μl of custom-designed second-strand adapter. Samples were then incubated at 94 °C for 5 min and at 4°C for 5 min, after which 1.5 μl of Klenow (3’ → 5’ exo minus) were added, followed by further incubation at 4 °C for 15 min, at 37 °C for 30 min and at 70 °C for 5 min.
Beads were separated on magnet and the chase reaction was carried out by resuspending in a mix of 5 μl of 10× Thermo Pol Buffer, 1.25 μl of 10 mM dNTPs, 43.5 μl of H2O and 1 μl of Bst DNA Polymerase Large Fragment (NEB). Samples were incubated at 65 °C for 30 min, then again separated on magnet.
PCR was performed on beads in 50-pl reactions composed of 25 μl of 2× NEB Next PCR Master Mix, 20 μl of H2O, 2.5 μl of i7 and 2.5 μl of i5 primers (both custom-designed), with initial extension at 72 °C for 3 min, denaturation at 98 °C for 30 s, 15 cycles of 98 °C for 10 s, 63 °C for 30 s and 72 °C for 30 s, and final extension at 72 °C for 5 min. PCR reactions were cleaned up and size-selected using AMPure XP beads.
Libraries were sequenced on Illumina NextSeq or MiSeq instruments, as 2×75 mers or 2×300 mers, respectively.
dSMF data processing.
Bisulfite reads were trimmed using cutadapt (v.0.16) and Trim Galore (v.0.4.4), using the following settings (taking into account that the bisulfite sequencing libraries are generated with the PBAT protocol): --clip_R1 9 --clip_R2 9 --three_prime_clip_r1 6 --three_prime_clip_r2 6 --paired. Trimmed reads were the mapped to the sacCer3 version of the yeast genome using Bismark48 (v.0.19.0) with the following settings: --bowtie2 --pbat. Methylation calls were extract using the bismark_methylation_extractor program within Bismark and the following settings: -s --no_overlap --comprehensive --merge_non_CpG --cytosine_report --CX.
ATAC-seq.
ATAC-seq was carried out on the same nuclei isolated for SMAC-seq as described above (before resuspension in M.CviPI Reaction Buffer), by resuspending nuclei with 25 μl of 2× TD buffer (20 mM Tris-HCl pH 7.6, 10 mM MgCl2, 20% dimethyl formamide), 2.5 μl of transposase (custom produced) and 22.5 μl of nuclease-free H2O, and incubating at 37 °C for 30 min in a Thermomixer at 1,000 r.p.m. Transposed DNA was isolated using the DNA Clean & Concentrator Kit (Zymo, catalog no. D4014) and PCR amplified as described before49. Libraries were then sequenced on a Illumina NextSeq instrument as 2×36 mers or as 2×75 mers.
ATAC-seq data processing.
Demultipexed fastq files were mapped to the sacCer3 assembly of the S. cerevisiae genome as 2×36 mers using Bowtie50 with the following settings: -v 2 -k 2 -m 1 --best --strata. Duplicate reads were removed using picard-tools (v.1.99).
ChlP-seq experiments.
Cell lysis and ChIP reactions were performed as previously described51 with minor modifications. Cells were fixed with 1% formaldehyde for 20 min (Rpb1-CTD and Rbp1-CTD-S2P ChIP) or 30 min (Hsf1-V5 ChIP) and quenched with 0.125 M glycine for 5 min. A total of ~50 ODs of cells were used per Rpb1-CTD or Rpb1-CTD-S2P ChIP and ~300 ODs per Hsf1-V5 ChIP. Fixed cell were washed 2× in cold 1X PBS, pelleted and stored at −80 °C. Pellets were lyzed in 300 μl of FA lysis buffer (50 mM HEPES-KOH pH 8.0, 150 mM NaCl, 1 mM EDTA, 1% Triton X-100, 0.1% sodium deoxycholate, 1 mM PMSF, Roche protease inhibitor) with ~1 ml of ceramic beads on a Fastprep-24 (MP Biomedicals). The entire lysate was then collected and adjusted to 1 ml with FA lysis buffer before sonication with a 1/8’ microtip on a Q500 sonicator (Qsonica) for 14 min (10 s on, 20 s off). The sample tube was held in a −20 °C 80% ethanol bath throughout sonication to prevent sample heating. After sonication, cell debris was pelleted and the supernatant was retained for ChIP. For each ChIP reaction, 30 μl of Protein G Dynabeads (Invitrogen) were blocked (PBS + 0.5% BSA), prebound with 5–10 μl of antibody (8wG16 Rpb1-CTD, Abcam catalog no. ab817); 3E10 Rpb1-CTD-S2P, Milipore catalog no. 04–1571-1) or SV5-Pk1 (anti-V5, BioRad catalog no. MCA1360G)) and washed once with PBS before incubation with supernatant (4 °C, overnight). Dynabeads were then washed (5 min per wash) 3× in FA lysis buffer, 3× in high-salt FA lysis buffer (50 mM HEPES-KOH pH 8.0, 500 mM NaCl, 1 mM EDTA, 1% Triton X-100, 0.1% sodium deoxycholate, 1 mM PMSF), 1× in ChIP wash buffer (10 mM Tris-HCl pH 7.5, 0.25 M LiCl, 0.5% NP-40, 0.5% sodium deoxycholate, 1 mM EDTA, 1 mM PMSF) and 1× in TE wash buffer (10 mM Tris-HCl pH 7.5, 1 mM EDTA, 50 mM NaCl). DNA was eluted from the beads in ChIP elution buffer (50 mM Tris-HCl pH 7.5; 10 mM EDTA; 1% SDS) at 65 °C for 20 min. Eluted DNA was incubated at 65 °C overnight to reverse crosslinks, before treatment with RNAse A (37°C, 1 h) and then Proteinase K (65 °C, 2 h). DNA was purified using the ChIP DNA Clean & Concentrator kit (Zymo Research). Sequencing libraries were generated using the NEB Next Ultra II DNA Library Prep kit (NEB catalog no. E7645) and sequenced on a Illumina NextSeq instrument as 2×36 mers or as 2×75 mers.
ChlP-seq data processing.
Demultipexed fastq files were mapped to the sacCer3 assembly of the S. cerevisiae genome as 2×36 mers using Bowtie50 with the following settings: -v 2 -k 2 -m 1 --best --strata. Duplicate reads were removed using picard-tools (v.1.99). Hsf1 peaks were called using MACS2 (ref. 52) (v.2.1.0) with the following settings: -g 12000000-f BAMPE.
Multiread-preserving alignment and normalization.
Multiread-preserving alignment and track generation was carried out by mapping reads to the sacCer3 assembly of the S. cerevisiae genome using Bowtie50 with the following settings: -v 2-a --best --strata. Each alignment was then given a weight inversely proportional to the number of locations that the read maps to. Each position’s score was normalized to RPMs as follows:
| (3) |
where NHR is the number of locations in the genome a read maps to.
RNA-seq experiments.
Cells (1 ml) were pelleted and flash frozen in liquid N2. Pellets were resuspended in 300 μl of TRIzol and lyzed with ~1 ml of ceramic beads on a Fastprep-24 (MP Biomedicals). Cell debris were pelleted and RNA was extracted from the supernatant using the Direct-Zol RNA Microprep Kit (Zymo Research). RNA-seq libraries were generated using the NEB Next Ultra Directional RNA Library Prep Kit (NEB catalog no. E7420)
RNA-seq processing and gene expression quantification.
RNA-seq reads were mapped to the yeast genome as 1×50 mers (external datasets) or 2×75 mers (diamide experiments) using TopHat v.2.0.8 (ref. 53). Gene-level quantifications (in fragments per kilobase per million mapped reads) were generated using Cufflinks v.2.0.2 (ref. 53). The mean from all replicates was taken as the expression level for each gene for subsequent analyses.
External sequencing datasets.
A number of previously published S. cerevisiae genomics datasets were used in this study. ChIP–exo reads and called peaks for Abf1, Cbf1, Rap1 and Reb1 were downloaded from Gene Expression Omnibus (GEO) accessions GSE93662 and GSE72106. ChIP–seq data for centromeric proteins was downloaded from GEO accessions GSE31466 and GSE51949. PRO-seq and PRO-CAP data were obtained from GEO accession GSE76142. ORC ChIP–seq data were downloaded from GEO accession GSE16926. DNAse-seq was downloaded from GEO accession GSE69651 while DGF (digital genomic footprinting) data were downloaded from DNA Data Bank of Japan (DDBJ) accession SRP000620. MNase-seq data were obtained from GEO accessions GSE26493 and GSE29292, TBP ChIP–seq from GSE44200, Rpb1 ChIP–seq from GSE93190, Rpb3 ChIP–seq from GSE74787, RPC128 ChIP–seq from GSE39566 and Mediator subunits ChIP–seq from GSE95051. RNA-seq data from accession GSE85590 was also used. Except where otherwise stated, raw reads were aligned using Bowtie50 with the following settings: -v 2 -k 2 -m 1 --best --strata, with the addition of -X 1000 for paired-end reads. Paired-end reads were aligned as 2×25 mers), while single-end reads were aligned as 1×36 mers. PRO-seq and PRO-CAP data were aligned as 1×16 mers.
Micro-C data and processing.
Micro-C data were downloaded from GEO accession GSE68016 and processed as described in the original publication34.
Transcription factor motif mapping.
Transcription factor motif recognition sequences were mapped genome-wide using FIMO54 (v.4.11.2) of the MEME-Suite55 using the CIS-BP database56 as a reference set of position weight matrices.
Gene annotation update.
Publicly available gene models for S. cerevisiae do not contain TSS and TTS (transcription termination site) information for a large fraction of genes in the genome, only including the coding (‘CDS’) portions instead. As the omission of untranslated regions presents a problem for TSS- and TTS-centered analyses, we updated the existing gene models following the approach described previously46 and the S. cerevisiae TIF-seq dataset from GEO accession GSE39128 (ref. 57). New TSS and TTS positions were assigned to each gene for which such information was available based on the median untranslated region length as measured by TIF-seq.
Nucleosome positioning information.
H4S47C19,58 chemical mapping data were downloaded form GEO accessions GSE59523 and GSE36063. H3Q85C59 chemical mapping data were downloaded from GEO accession GSE97290. We used the nucleosome positioning calls obtained from the original 2012 Brogaard et al. study for our analyses, after transforming them from coordinates in the sacCer2 version of the S. cerevisiae genome assembly to sacCer3 using the liftOver function in the UCSC Genome Browser utilities toolkit.
Mappability tracks generation.
To evaluate unique read mappability, the whole genome was tiled with reads of given length at every position. The reads were then mapped back to the genome using the same settings used to map single-end ChlP-seq reads. For every position coverage by mapped reads was calculated, and mappability was scored as the ratio between read coverage and the read length used to tile the genome.
Reporting Summary.
Further information on research design is available in the Nature Research Reporting Summary linked to this article.
Supplementary Material
Acknowledgements
This work was supported by National Institutes of Health grants (nos. P50HG007735, RO1 HG008140, U19AI057266 and UM1HG009442 to W.J.G., 1UM1HG009436 to W.J.G. and A.K., 1DP20D022870–01 and 1U01HG009431 to A.K.), the Rita Allen Foundation (to W.J.G.), the Baxter Foundation Faculty Scholar Grant and the Human Frontiers Science Program grant RGY006S (to W.J.G). W.J.G is a Chan Zuckerberg Biohub investigator and acknowledges grant nos. 2017–174468 and 2018–182817 from the Chan Zuckerberg Initiative. Z.S. is supported by EMBO Long-Term Fellowship EMBO ALTF 1119–2016 and by Human Frontier Science Program Long-Term Fellowship HFSP LT 000835/2017-L. G.K.M. is supported by the Stanford School of Medicine Dean’s Fellowship. N.A.S.A. is funded by the Department of Defense through a National Defense Science and Engineering Grant and by a Stanford Graduate Fellowship. We also thank members of the Greenleaf and Kundaje laboratories for their helpful suggestions and discussions on the subject over the course of the study.
Footnotes
Data availability
Short-read datasets associated with this study are available through GEO accession GSE128290. Nanopore data are available through SRA BioProject PRJNA594057. Nanopore raw data are available at https://zoharshiponh.s3.amazonaws.com/NMETH_2020/index.html.
Competing interests
The authors declare no competing interests.
Supplementary information is available for this paper at https://doi.org/10.1038/s41592–019-0730–2.
Peer review information Nicole Rusk and Lei Tang were the primary editors on this article and managed its editorial process and peer review in collaboration with the rest of the editorial team.
Publisher’s note Springer Nature remains neutral with regard to jurisdictional claims in published maps and institutional affiliations.
References
- 1.Wu C The 5′ ends of Drosophila heat shock genes in chromatin are hypersensitive to DNase I. Nature 286, 854–860 (1980). [DOI] [PubMed] [Google Scholar]
- 2.Keene MA, Corces V, Lowenhaupt K & Elgin SC DNase I hypersensitive sites in Drosophila chromatin occur at the 5′ ends of regions of transcription. Proc. Natl Acad. Sci. USA 78, 143–146 (1981). [DOI] [PMC free article] [PubMed] [Google Scholar]
- 3.McGhee JD, Wood WI, Dolan M, Engel JD & Felsenfeld GA 200 base pair region at the 5′ end of the chicken adult β-globin gene is accessible to nuclease digestion. Cell 27, 45–55 (1981). [DOI] [PubMed] [Google Scholar]
- 4.Dorschner MO et al. High-throughput localization of functional elements by quantitative chromatin profiling. Nat. Methods 1, 219–225 (2004). [DOI] [PubMed] [Google Scholar]
- 5.Sabo PJ et al. Genome-scale mapping of DNase I sensitivity in vivo using tiling DNA microarrays. Nat. Methods 3, 511–518 (2006). [DOI] [PubMed] [Google Scholar]
- 6.Boyle AP et al. High-resolution mapping and characterization of open chromatin across the genome. Cell 132, 311–322 (2008). [DOI] [PMC free article] [PubMed] [Google Scholar]
- 7.Hesselberth JR et al. Global mapping of protein-DNA interactions in vivo by digital genomic footprinting. Nat. Methods 6, 283–289 (2009). [DOI] [PMC free article] [PubMed] [Google Scholar]
- 8.Schones DE et al. Dynamic regulation of nucleosome positioning in the human genome. Cell 132, 887–898 (2008). [DOI] [PMC free article] [PubMed] [Google Scholar]
- 9.Buenrostro JD, Giresi PG, Zaba LC, Chang HY & Greenleaf WJ Transposition of native chromatin for fast and sensitive epigenomic profiling of open chromatin, DNA-binding proteins and nucleosome position. Nat. Methods 10, 1213–1218 (2013). [DOI] [PMC free article] [PubMed] [Google Scholar]
- 10.Kelly TK et al. Genome-wide mapping of nucleosome positioning and DNA methylation within individual DNA molecules. Genome Res. 22, 2497–2506 (2012). [DOI] [PMC free article] [PubMed] [Google Scholar]
- 11.Nabilsi NH et al. Multiplex mapping of chromatin accessibility and DNA methylation within targeted single molecules identifies epigenetic heterogeneity in neural stem cells and glioblastoma. Genome Res. 24, 329–339 (2014). [DOI] [PMC free article] [PubMed] [Google Scholar]
- 12.Krebs AR et al. Genome-wide single-molecule footprinting reveals high RNA polymerase II turnover at paused promoters. Mol. Cell 67, 411–422.e4 (2017). [DOI] [PMC free article] [PubMed] [Google Scholar]
- 13.Murray IA et al. The non-specific adenine DNA methyltransferase M.EcoGII. Nucleic Acids Res. 46, 840–848 (2018). [DOI] [PMC free article] [PubMed] [Google Scholar]
- 14.Simpson JT et al. Detecting DNA cytosine methylation using nanopore sequencing. Nat. Methods 14, 407–410 (2017). [DOI] [PubMed] [Google Scholar]
- 15.Rand AC et al. Mapping DNA methylation with high-throughput nanopore sequencing. Nat. Methods 14, 411–413 (2017). [DOI] [PMC free article] [PubMed] [Google Scholar]
- 16.Feng S et al. Conservation and divergence of methylation patterning in plants and animals. Proc. Natl Acad. Sci. USA 107, 8689–8694 (2010). [DOI] [PMC free article] [PubMed] [Google Scholar]
- 17.Zemach A, McDaniel IE, Silva P & Zilberman D Genome-wide evolutionary analysis of eukaryotic DNA methylation. Science 328, 916–919 (2010). [DOI] [PubMed] [Google Scholar]
- 18.Lister R et al. Highly integrated single-base resolution maps of the epigenome in Arabidopsis. Cell 133, 523–536 (2008). [DOI] [PMC free article] [PubMed] [Google Scholar]
- 19.Brogaard K, Xi L, Wang JP & Widom J A map of nucleosome positions in yeast at base-pair resolution. Nature 486, 496–501 (2012). [DOI] [PMC free article] [PubMed] [Google Scholar]
- 20.Stoiber MH et al. De novo identification of DNA modifications enabled by genome-guided nanopore signal processing. Preprint at bioRxiv 10.1101/094672 (2017). [DOI] [Google Scholar]
- 21.Li H Minimap and miniasm: fast mapping and de novo assembly for noisy long sequences. Bioinformatics 32, 2103–2110 (2016). [DOI] [PMC free article] [PubMed] [Google Scholar]
- 22.Cole HA, Howard BH & Clark DJ The centromeric nucleosome of budding yeast is perfectly positioned and covers the entire centromere. Proc. Natl Acad. Sci. USA 108, 12687–12692 (2011). [DOI] [PMC free article] [PubMed] [Google Scholar]
- 23.Henikoff S et al. The budding yeast centromere DNA element II wraps a stable Cse4 hemisome in either orientation in vivo. Elife 3, e01861 (2014). [DOI] [PMC free article] [PubMed] [Google Scholar]
- 24.Conconi A, Widmer RM, Koller T & Sogo JM Two different chromatin structures coexist in ribosomal RNA genes throughout the cell cycle. Cell 57, 753–761 (1989). [DOI] [PubMed] [Google Scholar]
- 25.French SL, Osheim YN, Cioci F, Nomura M & Beyer AL In exponentially growing Saccharomyces cerevisiae cells, rRNA synthesis is determined by the summed RNA polymerase I loading rate rather than by the number of active genes. Mol. Cell Biol. 23, 1558–1568 (2003). [DOI] [PMC free article] [PubMed] [Google Scholar]
- 26.Goetze H et al. Alternative chromatin structures of the 35S rRNA genes in Saccharomyces cerevisiae provide a molecular basis for the selective recruitment of RNA polymerases I and II. Mol. Cell Biol. 30, 2028–2045 (2010). [DOI] [PMC free article] [PubMed] [Google Scholar]
- 27.Merz K et al. Actively transcribed rRNA genes in S. cerevisiae are organized in a specialized chromatin associated with the high-mobility group protein Hmol and are largely devoid of histone molecules. Genes Dev. 22, 1190–1204 (2008). [DOI] [PMC free article] [PubMed] [Google Scholar]
- 28.Panday A & Grove A Yeast HMO1: linker histone reinvented. Microbiol. Mol. Biol. Rev. 81, e00037–16 (2016). [DOI] [PMC free article] [PubMed] [Google Scholar]
- 29.Jones HS et al. RNA polymerase I in yeast transcribes dynamic nucleosomal rDNA. Nat. Struct. Mol. Biol. 14, 123–130 (2007). [DOI] [PMC free article] [PubMed] [Google Scholar]
- 30.Huang J & Moazed D Association of the RENT complex with nontranscribed and coding regions of rDNA and a regional requirement for the replication fork block protein Fob1 in rDNA silencing. Genes Dev. 17, 2162–2176 (2003). [DOI] [PMC free article] [PubMed] [Google Scholar]
- 31.Zhu F et al. The interaction landscape between transcription factors and the nucleosome. Nature 562, 76–81 (2018). [DOI] [PMC free article] [PubMed] [Google Scholar]
- 32.O’Sullivan JM et al. Gene loops juxtapose promoters and terminators in yeast. Nat Genet 36, 1014–1018 (2004). [DOI] [PubMed] [Google Scholar]
- 33.Tan-Wong SM et al. Gene loops enhance transcriptional directionality. Science 338, 671–675 (2012). [DOI] [PMC free article] [PubMed] [Google Scholar]
- 34.Hsieh TH et al. Mapping nucleosome resolution chromosome folding in yeast by Micro-C. Cell 162, 108–119 (2015). [DOI] [PMC free article] [PubMed] [Google Scholar]
- 35.Weiner A et al. High-resolution chromatin dynamics during a yeast stress response. Mol. Cell 58, 371–386 (2015). [DOI] [PMC free article] [PubMed] [Google Scholar]
- 36.Morano KA, Grant CM & Moye-Rowley WS The response to heat shock and oxidative stress in Saccharomyces cerevisiae. Genetics 190, 1157–1195 (2012). [DOI] [PMC free article] [PubMed] [Google Scholar]
- 37.Gabrieli T et al. Selective nanopore sequencing of human BRCA1 by Cas9-assisted targeting of chromosome segments (CATCH). Nucleic Acids Res. 46, e87 (2018). [DOI] [PMC free article] [PubMed] [Google Scholar]
- 38.Staševskij Z, Gibas P, Gordevičius J, Kriukiene E & Klimašauskas S Tethered oligonucleotide-primed sequencing, TOP-Seq: a high-resolution economical approach for DNA epigenome profiling. Mol. Cell 65, 554–564.e6 (2017). [DOI] [PMC free article] [PubMed] [Google Scholar]
- 39.Fu Y, Sinha M, Peterson CL & Weng Z The insulator binding protein CTCF positions 20 nucleosomes around its binding sites across the human genome. PLoS Genet. 4, e1000138 (2008). [DOI] [PMC free article] [PubMed] [Google Scholar]
- 40.Fu Y et al. N6-methyldeoxyadenosine marks active transcription start sites in Chlamydomonas. Cell 161, 879–892 (2015). [DOI] [PMC free article] [PubMed] [Google Scholar]
- 41.Wang Y, Chen X, Sheng Y, Liu Y & Gao S N6-adenine DNA methylation is associated with the linker DNA of H2A.Z-containing well-positioned nucleosomes in Pol II-transcribed genes in Tetrahymena. Nucleic Acids Res. 45, 11594–11606 (2017). [DOI] [PMC free article] [PubMed] [Google Scholar]
- 42.Luo GZ et al. N6-methyldeoxyadenosine directs nucleosome positioning in Tetrahymena DNA. Genome Biol. 19, 200 (2018). [DOI] [PMC free article] [PubMed] [Google Scholar]
- 43.Timinskas A, Butkus V & Janulaitis A Sequence motifs characteristic for DNA [cytosine-N4] and DNA [adenine-N6] methyltransferases. Classification of all DNA methyltransferases. Gene 157, 3–11 (1995). [DOI] [PubMed] [Google Scholar]
- 44.Salter JD, Bennett RP & Smith HC The APOBEC protein family: united by structure, divergent in function. Trends Biochem. Sci. 41, 578–594 (2016). [DOI] [PMC free article] [PubMed] [Google Scholar]
- 45.Kawasaki F et al. Genome-wide mapping of 5-hydroxymethyluracil in the eukaryote parasite Leishmania. Genome Biol. 18, 23 (2017). [DOI] [PMC free article] [PubMed] [Google Scholar]
References
- 46.Schep AN et al. Structured nucleosome fingerprints enable high-resolution mapping of chromatin architecture within regulatory regions. Genome Res. 25, 1757–1770 (2015). [DOI] [PMC free article] [PubMed] [Google Scholar]
- 47.Miura F, Enomoto Y, Dairiki R & Ito T Amplification-free whole-genome bisulfite sequencing by post-bisulfite adaptor tagging. Nucleic Acids Res. 40, e136 (2012). [DOI] [PMC free article] [PubMed] [Google Scholar]
- 48.Krueger F & Andrews SR Bismark: a flexible aligner and methylation caller for Bisulfite-Seq applications. Bioinformatics 27, 1571–1572 (2011). [DOI] [PMC free article] [PubMed] [Google Scholar]
- 49.Corces MR et al. An improved ATAC-seq protocol reduces background and enables interrogation of frozen tissues. Nat. Methods 14, 959–962 (2017). [DOI] [PMC free article] [PubMed] [Google Scholar]
- 50.Langmead B, Trapnell C, Pop M & Salzberg SL Ultrafast and memory-efficient alignment of short DNA sequences to the human genome. Genome Biol. 10, R25 (2009). [DOI] [PMC free article] [PubMed] [Google Scholar]
- 51.Hu B et al. Biological chromodynamics: a general method for measuring protein occupancy across the genome by calibrating ChIP-seq. Nucleic Acids Res. 43, e132 (2015). [DOI] [PMC free article] [PubMed] [Google Scholar]
- 52.Feng J, Liu T, Qin B, Zhang Y & Liu XS Identifying ChIP-seq enrichment using MACS. Nat. Protoc. 7, 1728–1740 (2012). [DOI] [PMC free article] [PubMed] [Google Scholar]
- 53.Trapnell C et al. Differential gene and transcript expression analysis of RNA-seq experiments with TopHat and Cufflinks. Nat. Protoc. 7, 562–578 (2012). [DOI] [PMC free article] [PubMed] [Google Scholar]
- 54.Grant CE, Bailey TL & Noble WS FIMO: scanning for occurrences of a given motif. Bioinformatics 27, 1017–1018 (2011). [DOI] [PMC free article] [PubMed] [Google Scholar]
- 55.Bailey TL et al. MEME SUITE: tools for motif discovery and searching. Nucleic Acids Res. 37, W202–208 (2009). [DOI] [PMC free article] [PubMed] [Google Scholar]
- 56.Weirauch MT et al. Determination and inference of eukaryotic transcription factor sequence specificity. Cell 158, 1431–1443 (2014). [DOI] [PMC free article] [PubMed] [Google Scholar]
- 57.Pelechano V, Wei W & Steinmetz LM Extensive transcriptional heterogeneity revealed by isoform profiling. Nature 497, 127–131 (2013). [DOI] [PMC free article] [PubMed] [Google Scholar]
- 58.Ramachandran S, Zentner GE & Henikoff S Asymmetric nucleosomes flank promoters in the budding yeast genome. Genome Res. 25,`381–390 (2015). [DOI] [PMC free article] [PubMed] [Google Scholar]
- 59.Chereji RV, Ramachandran S, Bryson TD & Henikoff S Precise genome-wide mapping of single nucleosomes and linkers in vivo. Genome Biol. 19, 19 (2018). [DOI] [PMC free article] [PubMed] [Google Scholar]
Associated Data
This section collects any data citations, data availability statements, or supplementary materials included in this article.