Abstract
Background:
The mechanical stimulus (i.e. stress or stretch) for growth occurring in the pressure-overloaded left ventricle (LV) is not exactly known.
Objective:
To address this issue, we investigate the correlation between local ventricular growth (indexed by local wall thickness) and the local acute changes in mechanical stimuli after aortic banding.
Methods:
LV geometric data were extracted from 3D echo measurements at baseline and 2 weeks in the aortic banding swine model (n = 4). We developed and calibrated animal-specific finite element (FE) model of LV mechanics against pressure and volume waveforms measured at baseline. After the simulation of the acute effects of pressure-overload, the local changes of maximum, mean and minimum myocardial stretches and stresses in three orthogonal material directions (i.e., fiber, sheet and sheet-normal) over a cardiac cycle were quantified. Correlation between mechanical quantities and the corresponding measured local changes in wall thickness was quantified using the Pearson correlation number (PCN) and Spearman rank correlation number (SCN).
Results:
At 2 weeks after banding, the average septum thickness decreased from 10.6 ± 2.92mm to 9.49 ± 2.02mm, whereas the LV free-wall thickness increased from 8.69 ± 1.64mm to 9.4 ± 1.22mm. The FE results show strong correlation of growth with the changes in maximum fiber stress (PCN = 0.5471, SCN = 0.5111) and changes in the mean sheet-normal stress (PCN= 0.5266, SCN = 0.5256). Myocardial stretches, however, do not have good correlation with growth.
Conclusion:
These results suggest that fiber stress is the mechanical stimuli for LV growth in pressure-overload.
Keywords: Pressure overload, concentric hypertrophy, left ventricular mechanics, ventricular growth and remodeling, aortic banding swine model
INTRODUCTION
Left ventricular (LV) afterload as reflected by an elevated systolic pressure [1] is an important determinant of acute cardiac mechanics and the chronic growth process. An increase in afterload in pathological conditions (e.g., aortic stenosis and hypertension [2, 3]) can impair longitudinal myocardial deformation [4, 5] as well as trigger concentric hypertrophy. During concentric hypertrophy, the LV wall thickness increases via parallel sarcomerogenesis with little or no change in the cavity volume. The systolic stress-correction hypothesis proposed by Grossman et al. [6] states that the increase in wall thickness in concentric hypertrophy serves to normalize wall stress to baseline homeostatic levels (i.e., increase in wall thickness to radius ratio increase proportionally to the increase in pressure such that the hoop stress computed by Laplace’s law is restored). Besides geometrical changes, interstitial and perivascular accumulation of fibrillar collagen (type I and type III) may also occur over a prolonged period of time [7].
An increase in afterload changes mechanical quantities of the LV locally, specifically myocardial stresses and stretches [8]. It is believed that mechanical stimuli, directly or indirectly, are the major driving forces of growth at both cellular and organ levels [9]. In in-vivo studies at the organ level, volume overload for example, increases the passive stretches or stresses of the muscle cells at end diastole that is associated with the dilation of heart chamber that occurs after a prolonged period of time [10]. An increase in afterload in pressure overload, on the other hand, not only produces an increase in stresses in the muscle cells during systole [11–13], but may also affect stretches of the cell (when stroke volume is reduced) that altogether are associated with ventricular wall thickening that occurs after a prolonged period of time. At the cellular level, Yang et. al. used live-cell imaging to show that pressure overload induces parallel sarcomeric addition, whereas volume overload causes sarcomeric addition both in parallel and series. Besides utilizing the existing sarcomeres as anchors or templates, the mechanisms involved include either insertion of new sarcomeres into an existing myofibril for longitudinal expansion or splitting of existing myofibrils for lateral expansion [14]. Although this study explains the growth process through sarcomerogenesis, it is not possible to infer from it if mechanical stresses or stretches drive the process as it is difficult to replicate local mechanical environment in the myocardium during pressure overload.
To explain chronic changes of the heart due to pressure overload quantitatively, a few constitutive models based on the volumetric growth framework have been proposed. Specifically, Goktepe et al. [15, 16] and Rausch et al. [17] both proposed a stress-driven growth constitutive model to describe ventricular wall thickening associated with pressure overload in the heart. On the other hand, Kerckhoffs et al. proposed a unified strain-driven growth law that is able to reproduce features found in concentric hypertrophy associated with aortic stenosis and eccentric hypertrophy associated with mitral valve regurgitation [18]. Based on this unified strain-driven growth law but with different homeostatic set points for growth, Yoshida et al. showed that the model is able to predict forward growth with pressure overload, but is unable to predict reverse growth with the removal of pressure overload [19]. While these studies have shown their models, using either stress or strain as the growth stimuli, are able to reproduce global growth features associated with pressure overload (e.g., global change in wall thickness), they did not verify how their model prediction of regional/local growth compares with the experimental and/or clinical measurements. Correspondingly, it is difficult to assess whether using stresses or strains as stimuli can better reproduce growth features associated with pressure overload.
To address this issue, we used a combination of computational modeling and experiments to investigate whether normal stresses or strains along 3 orthogonal material directions can better correlate with regional measurements of growth in a swine model of aortic banding. While changes in stretch in pressure overloaded hearts can in principle be measured experimentally, the combination of a complex ventricular wall structure with highly nonlinear mechanical behavior and the limitations of current available techniques, however, do not allow for stresses in the muscle fibers to be quantified directly through experiment [12]. As such, we developed animal-specific finite element (FE) models of the LV to simulate the acute effects of pressure overload and estimate the regional changes in normal stresses and strains, which were then correlated with the corresponding regional growth. We showed that regional growth is best correlated with changes in regional stresses rather than stretches. The implications and limitations of the study are also elaborated.
METHODS
Animal Model of Pressure Overload
Surgical anesthesia was induced in Yorkshire pigs with TKX (Telazol 10 mg/kg, Ketamine 5 mg/kg, and Xylazine 5 mg/kg, i.m.) (n = 4). Animals were maintained on surgical anesthesia with isoflurane (1–2%) and oxygen while on the ventilator. The chest was opened through a midline sternotomy and the heart was cradled in the pericardial sac. Lidocaine (80 mg iv) was administered as a slow bolus injection before cardiac instrumentation. The root of the ascending aorta was dissected free from the pulmonary artery to prepare for the placement of an inflatable cuff (18-mm-diameter Teflon occluder) around the ascending aorta and the tube of the occluder was exteriorized through an intercostal space on the right thoracic wall. The sternotomy was closed and the animal was allowed to recover. After the animal recovery for one week, the aorta was constricted using the externalized inflatable cuff. While the animal was under anesthesia, the cuff was inflated with glycerin while the LV pressure was measured and adjusted until the LV systolic pressure had been raised to 35 – 50% above baseline. The inflatable constrictor was fixed to maintain the stenosis.
Experimental measurement
Measurements were acquired in vivo from the animals before aortic constriction (baseline) and 2 weeks after aortic constriction (growth). Specifically, aortic and LV pressure waveforms were measured using catheterization while 3D echo (EPIQ-C system, Philips Healthcare, Andover, MA, USA) was performed on the animals from which the LV geometry and volume waveforms were acquired. The LV pressure and volume waveforms were synchronized to obtain pressure-volume (PV) loops in each animal at baseline and after growth.
Based on the LV geometry segmented from 3D echo, we also computed the regional thickness by measuring the local shortest distance between the endocardium and epicardium. The local regional wall thickness was projected on the endocardium and regional growth was indexed by the difference between thickness at baseline and after growth.
Left ventricular model geometry and microstructure
Left ventricular geometries segmented from the 3D echo images were discretized using (~4000) tetrahedral elements (Figure 1), which is sufficient for convergence based on a previous study using a biventricular mesh [20] (See Appendix A for a mesh sensitivity analysis). Myofiber direction fo, was prescribed based on a linear transmural variation of the helix angle from 60° at the endocardium to −60° at the epicardium [21] across the wall using a Laplace-Dirichlet rule-based algorithm [22].
Figure 1:

Construction of animal-specific LV FE model. (a) Segmentation of LV surfaces from 3D echo images, (b) Meshing of geometry to construct a LV FE model that is connected to a 3-element Windkessel model [23] (c) Transmural distribution of fiber angle from +60° at endocardium to −60° at epicardium is prescribed in the LV FE model.
Left ventricular mechanics
Left ventricular mechanics was described using an active stress formulation. In the formulation, the 2nd Piola Kirchhoff stress tensor S was additively decomposed into an active Sa and a passive component Sp i.e.,
| (1) |
The myocardium is assumed incompressible. Passive mechanics was described by a transversely isotropic Fung-type strain energy function [24] given by
| (2a) |
with
| (2b) |
In Eq. (2), C, bff, bxx, bfs are material parameters of the passive constitutive model. Components of the Green-Lagrange strain tensor E are denoted by Eij with (i, j) ∈ (f, s, n), where f, s, n describe the fiber, sheet and sheet-normal directions, respectively. Active mechanics was described using the active contraction model by Guccione et al. [25, 26] with the active stress tensor given as
| (3a) |
| (3b) |
| (3c) |
| (3d) |
In Eq. (3), Tmax is the isometric tension achieved at the longest sarcomere length, Ca0 denotes the peak intracellular calcium concentration, ECa50 is the length dependent calcium sensitivity. The parameter t0 is the prescribed time to maximum active tension, whereas tr denotes the duration of relaxation that varies linearly with the instantaneous sarcomere length governed by parameters m and b.
Finite element formulation
Finite element formulation of the LV mechanics problem was obtained by minimizing the following Lagrangian functional [27, 28]
| (4) |
In Eq. (4)), ψT is the total strain energy of the myocardium, u ∈ H1(Ω0) is the displacement field. On the other hand, P ∈ R, p ∈ L2(Ω0), c1 ∈ R3 and c2∈R3 are the Lagrange multipliers for, respectively, constraining the cavity volume Vcav (u) to the prescribed value Vp , enforcing incompressibility in which the Jacobian of the deformation gradient tensor J = 1, enforcing zero mean translation and enforcing zero mean rotation, respectively. A spring (robin-type) boundary condition with spring constant kspring was also imposed on the epicardial surface dΩ0,epi to describe the loading by the pericardial fluid.
The weak formulation was then obtained by taking the first variation of the Lagrangian functional as follows:
| (5) |
In the above equation, δu ∈ H1(Ω0), δp ∈ L2(Ω0), δP ∈ R, δc1 ∈ R3, δc2 ∈ R3 are the test functions corresponding to u, p, P, c1 and c2, respectively. Displacement at the LV base was constrained from moving out of plane i.e.,
| (6) |
The displacement field u(X) and Lagrange multiplier p were interpolated using quadratic and linear tetrahedral elements, respectively. An implicit backward Euler scheme was used for numerical time-integration with a fixed time step. The modeling framework was implemented using the open-source FE library FEniCS [29].
Simulation cases
We considered two simulation cases for each pig: 1) Before banding (baseline) and 2) Acute effects of banding (acute overload). In the baseline case, passive filling was simulated by increasing the LV volume in the FE model up to the measured end diastolic volume (EDV). The scaling factor C in Eq. (2a) associated with the passive constitutive model was adjusted so that model prediction of end diastolic pressure (EDP) matches the baseline measurements. Isovolumic contraction was then simulated by constraining the LV cavity volume at EDV. Ejection was simulated when LV pressure exceeded the measured aortic pressure at baseline. This phase was simulated by connecting the LV to a 3-element Windkessel model. Parameters of the Windkessel model and the active constitutive model (i.e. Tmax, t0, m and b) were adjusted to match the pressure and volume waveforms measured at baseline. Isovolumic relaxation phase was simulated with the termination of ejection phase when the LV outflow rate fell below 0.005ml/min. The isovolumic relaxation phase was simulated by constraining the LV cavity volume. Last, the diastolic filling phase was simulated when the LV pressure fell below the measured mitral valve opening pressure.
To simulate aortic constriction in the acute (immediate) overload cases, only parameters of the Windkessel model were adjusted to match the elevated peak systolic pressure measured at 2nd week after aortic banding in the animals. As the pressure was not measured immediately after banding, we had assumed that the elevated pressure associated with aortic banding was sustained for the 2 weeks. Also, we assumed that end-diastolic volume was not changed immediately after aortic banding based on a previous canine study by Crozatier et al. [45], which found no acute end-diastolic diameter increase in most of the animals after aortic stenosis. Other model parameters as well as fiber orientation distribution in the acute overload case for each pig were prescribed to be the same as those in the corresponding baseline case.
Mechanical stimuli
In the baseline and acute overload cases for each pig, the Cauchy stress tensor was calculated from the 2nd Piola Kirchhoff stress tensor S by
| (7) |
and the stretch is defined by
| (8) |
with k ∈ (f, s, n) and f, s, n describing the fiber, sheet and sheet-normal directions, respectively. In the above equation, C = FTF is the right Cauchy-Green deformation tensor and k0 is a unit vector defining the material axis at end diastole. The potential mechanical stimuli are defined as the arithmetic differences between the baseline and acute overload cases for the normal stress and stretch in the fiber, sheet and sheet-normal directions.
Statistical Analysis
Results were tested for significance using the Student’s t-tests with a chosen r-value of 0.05. The bar plot of deviations in Figure 4 were expressed as absolute values of mean + SD. Linear correlations between growth and deviation of mechanical quantities (i.e., stresses and stretches) were assessed using the Pearson correlation coefficient and the Spearman rank correlation coefficient, which unlike the former, does not assume that the dataset has a normal distribution. These two correlation coefficients provide not only a dimensionless measure of the covariance – a measure how two variables, i.e. stimulus and growth, vary together – but also information on the direction of the relationship (either positive or negative) between these two parameters. The relationship becomes stronger in the positive and negative directions as the coefficients approach +1 and −1, respectively. There is no correlation when the Spearman rank and Pearson correlation coefficients are 0. We note that while the coefficient of determination (R2) can also be applied to detect the association of 2 quantities, it does not provide any information about direction of the relationship. All statistical analyses were performed using Microsoft Excel.
Figure 4:
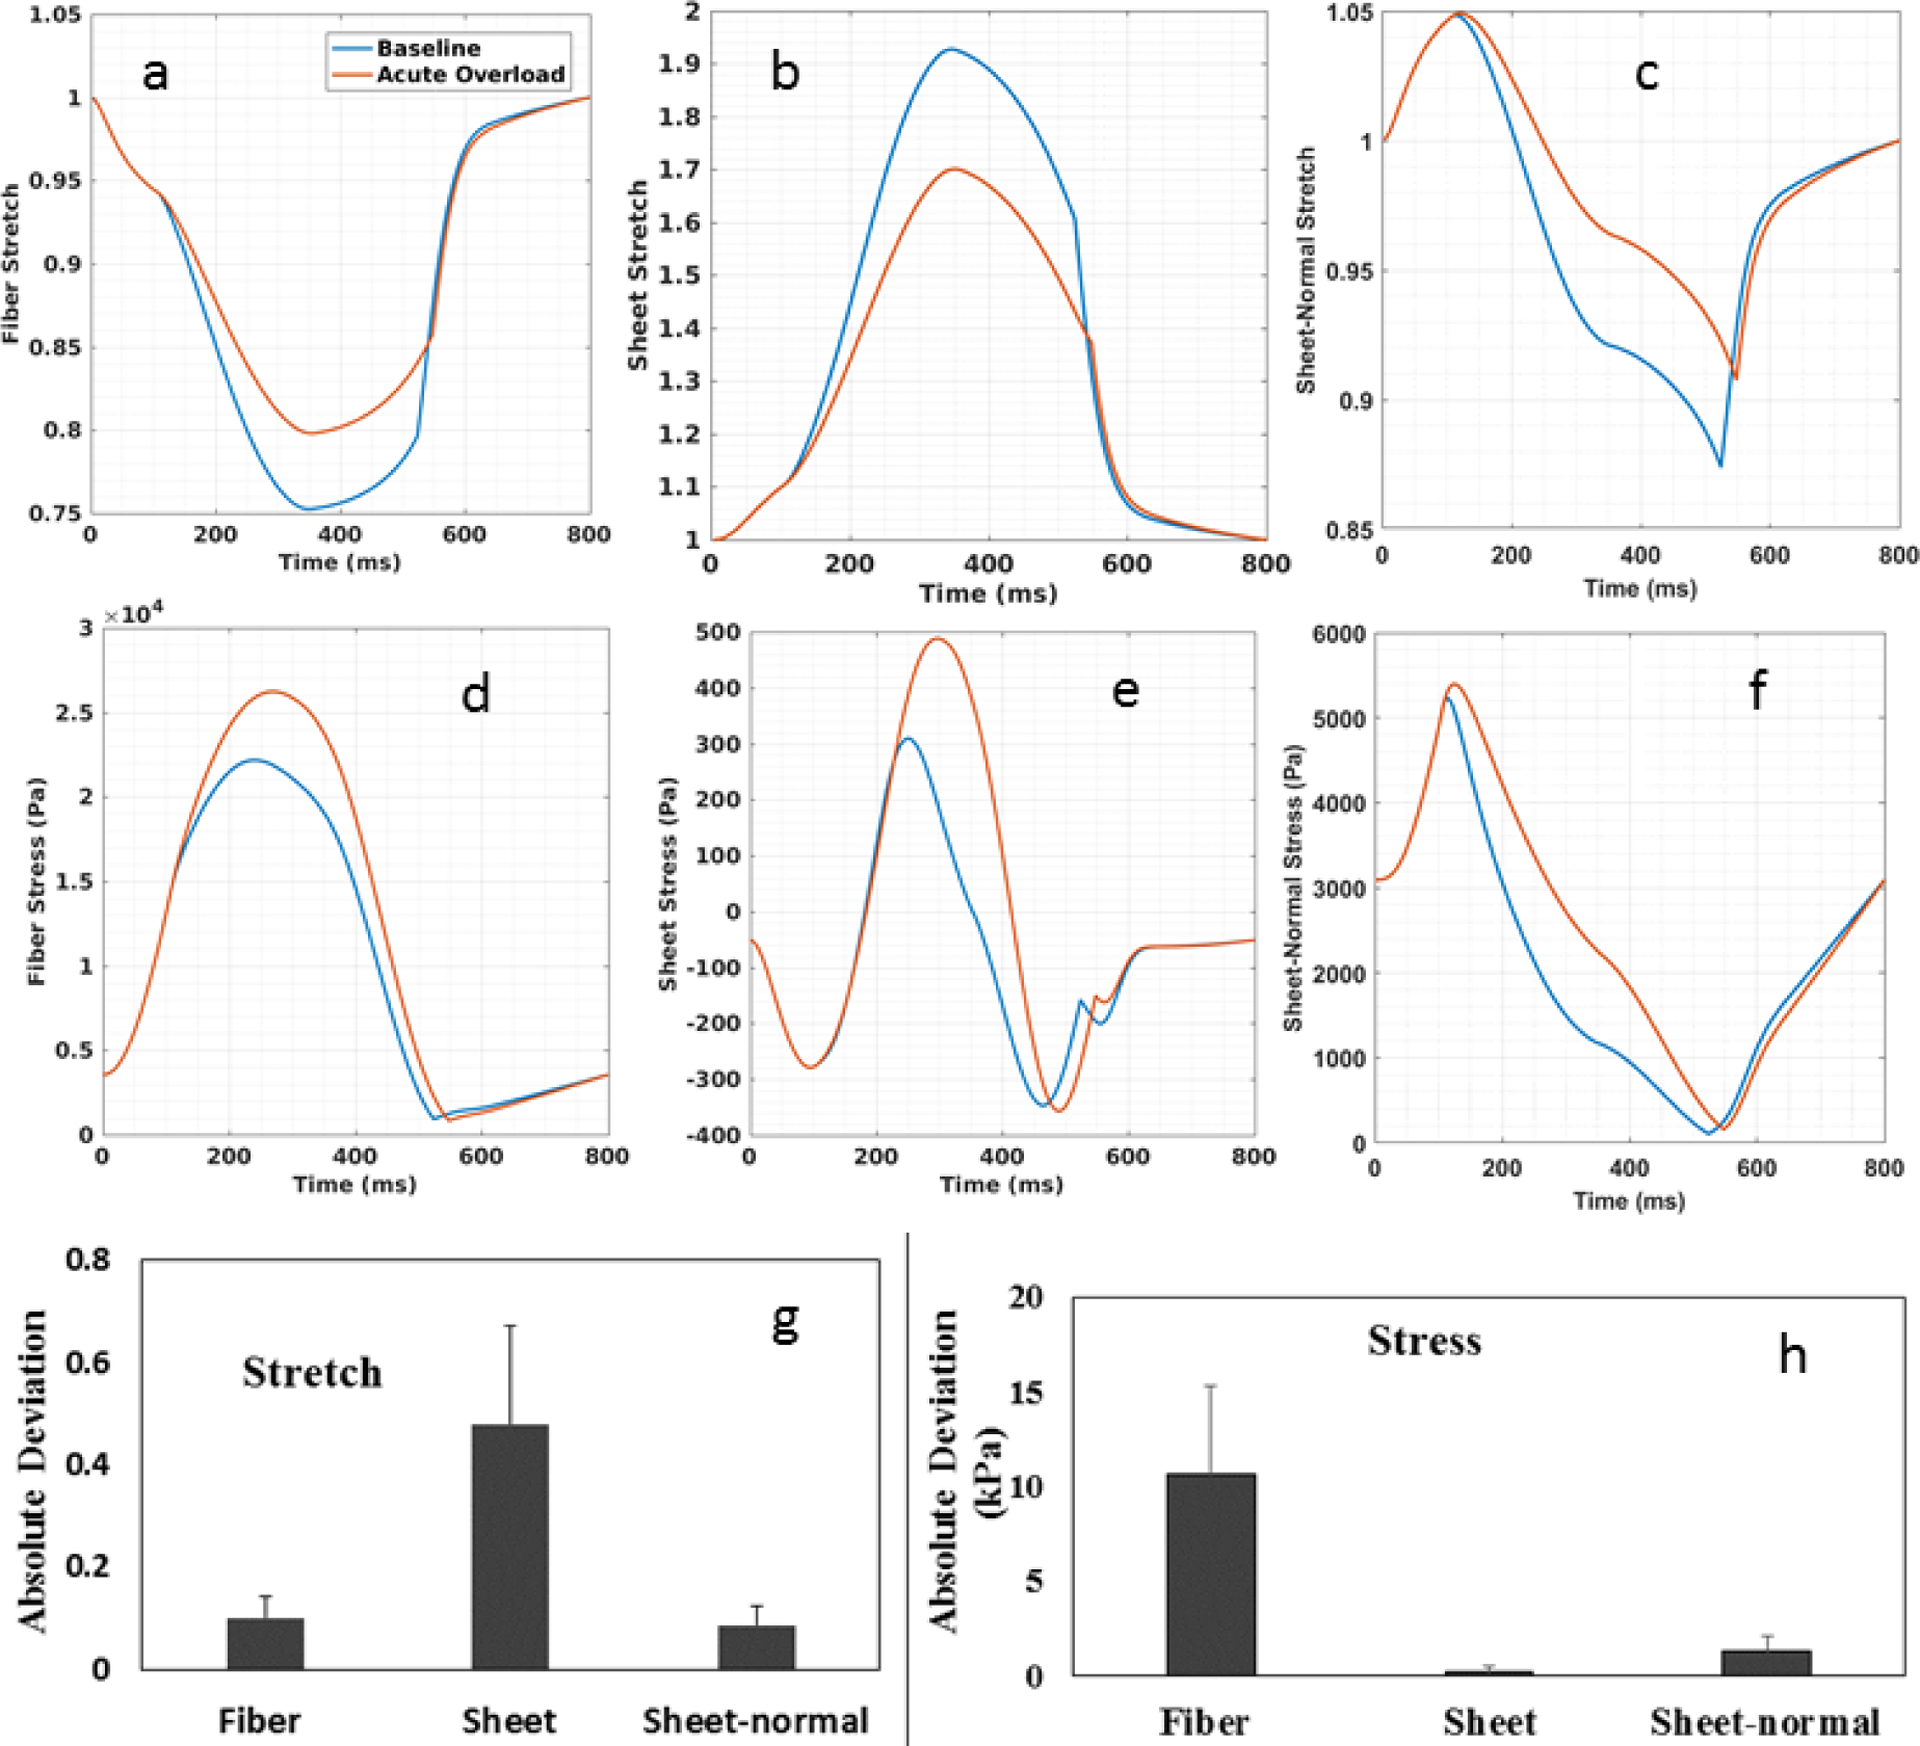
Comparison of normal stress and stretch in the fiber, sheet and sheet-normal directions between the baseline and acute overload cases. Spatially averaged waveforms of the baseline (blue) and acute overload (red) for: (a) fiber stretch (b) sheet stretch (c) sheet-normal stretch (d) fiber stress (e) sheet stress and (g) sheet-normal stress. Stretch was computed with end-diastolic configuration as reference. Maximum absolute deviation of (g) stretch and (h) stress averaged over four pigs. Maximum absolute deviation is defined to be the absolute maximum difference between quantities obtained in the acute overload and baseline case averaged over all material points and averaged for 4 pigs.
RESULTS
Measurements from the aortic banding animal model
Experimental measurements of four pig models before and after 2 weeks of aortic banding are tabulated in Table 1. A significant increase in the mean peak systolic pressure (~ 43%) was found in the post aortic banding animals. Mean end diastolic volume (EDV) was increased (~ 10%) while mean ejection fraction (EF) was decreased (~5% absolute) after 2 weeks of banding. Mean aortic pressure was also increased (~53%) whereas average maximum and minimum thickness remained relatively unchanged. The mean septum thickness was decreased (~10%), however, while the mean free-wall thickness was increased (~8%).
Table 1:
Experimental measurements
| Parameters | 0th Week | 2nd Week |
|---|---|---|
| End Diastolic Volume, EDV (ml) | 72 ± 14 | 79 ± 19 |
| End Diastolic Pressure, EDP (mm Hg) | 14 ± 5 | 28 ± 16 |
| End Systolic Volume, ESV (ml) | 39 ± 8 | 46 ± 10 |
| Stroke volume, SV (ml) | 33 ± 7 | 32 ± 10 |
| Ejection Fraction, EF (%) | 46 ± 3 | 41 ± 3 |
| Peak Systolic pressure (mm Hg) | 79 ± 8* | 112 ± 16* |
| Aortic Pressure (mm Hg) | 58 ± 3 | 89 ± 19 |
| Maximum Thickness (mm) | 13 ± 4 | 13 ± 2 |
| Minimum Thickness (mm) | 5 ± 1 | 5 ± 1 |
| Septum Thickness (mm) | 11 ± 3 | 9 ± 2 |
| LV Free wall Thickness (mm) | 9 ± 2 | 9 ± 1 |
| Wall volume (ml) | 63 ± 23 | 66 ± 13 |
Data are expressed as mean ± SD.
P < 0.05
Regional wall thickness and growth as indexed by the change in the wall thickness before and after banding are shown in Figure 2. In 3 pigs (1 – 3), the septum became thinner and the free wall became thicker after banding. In Pig 4, both septum and free wall thickened.
Figure 2:
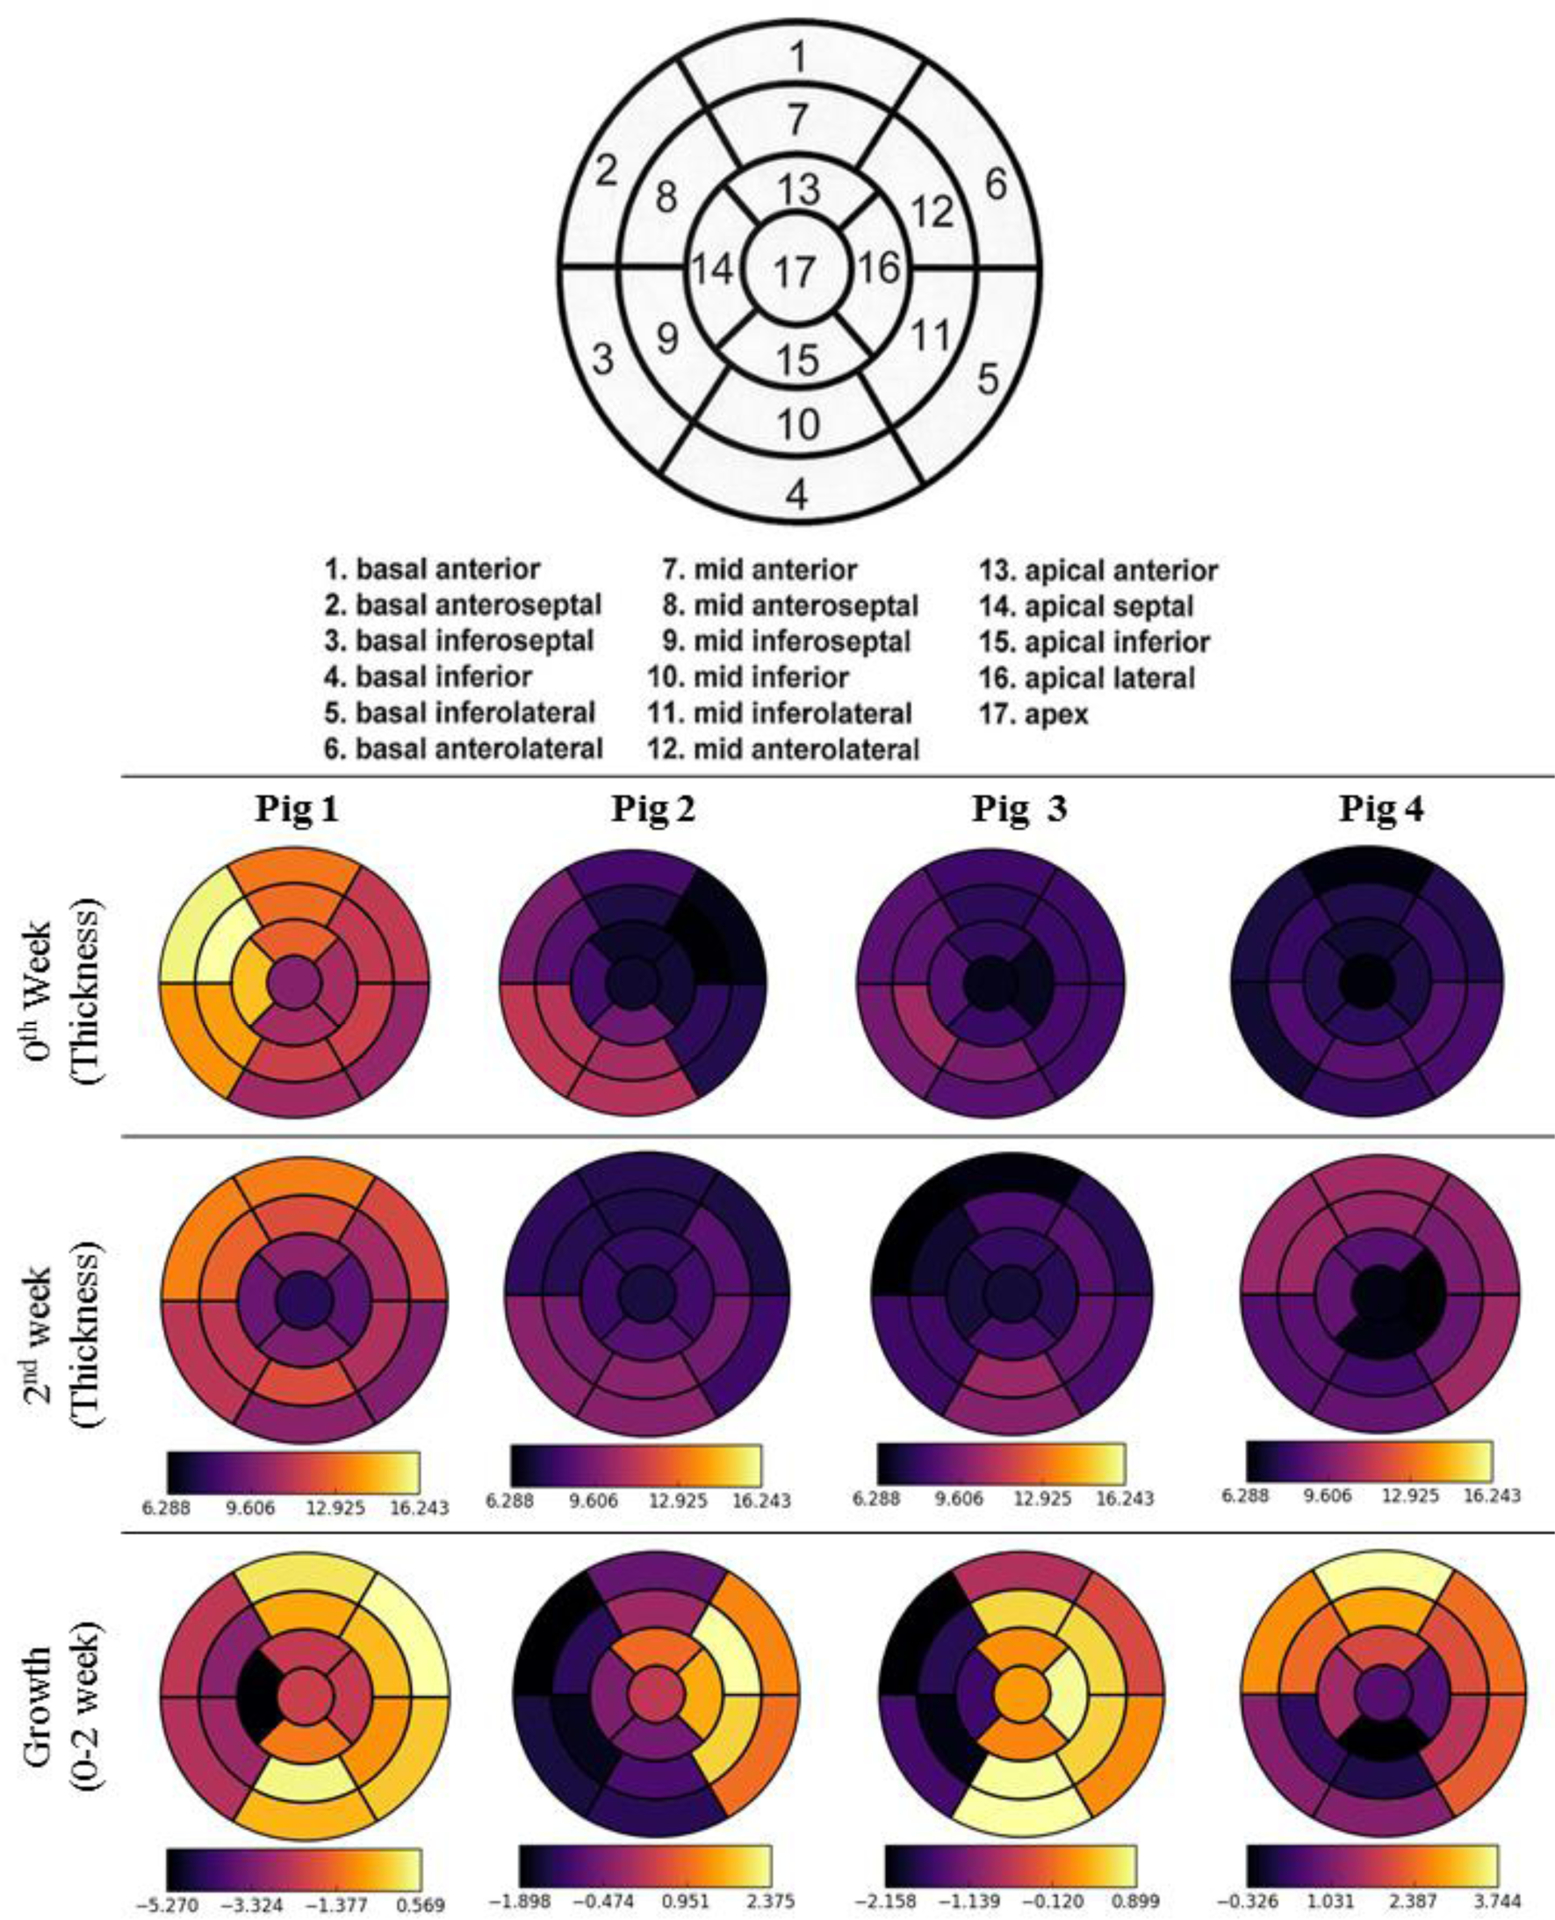
Regional measured wall thickness and growth of 4 pig models based on 17 AHA segmentation [30]. Unit in mm.
Calibration of Simulations
Model predictions of the baseline cases are in good agreement with the corresponding pressure and volume measurements. Specifically, the normalized root mean square error (RMSE) between model prediction and experimental measurement is 11.47 ± 5% for the pressure waveform and 29.6 ± 15.4% for the volume waveform (Figure 3a). Differences in stroke volume and ejection fraction between the baseline model prediction and experimental measurements are 0.5% and 0.85%, respectively. Representative pressure waveform (Figure 3b), volume waveform (Figure 3c) as well as PV loop (Figure 3d) are also presented for one pig. For the acute overload LV FE models, which were calibrated to match peak systolic pressure measured at 2 weeks after aortic constriction, the RMSE between model prediction and measurements of the pressure is 6 ± 6.1%. Model parameters associated with the baseline and acute overload simulation cases in each pig are given in Table 2 at Appendix B.
Figure 3:
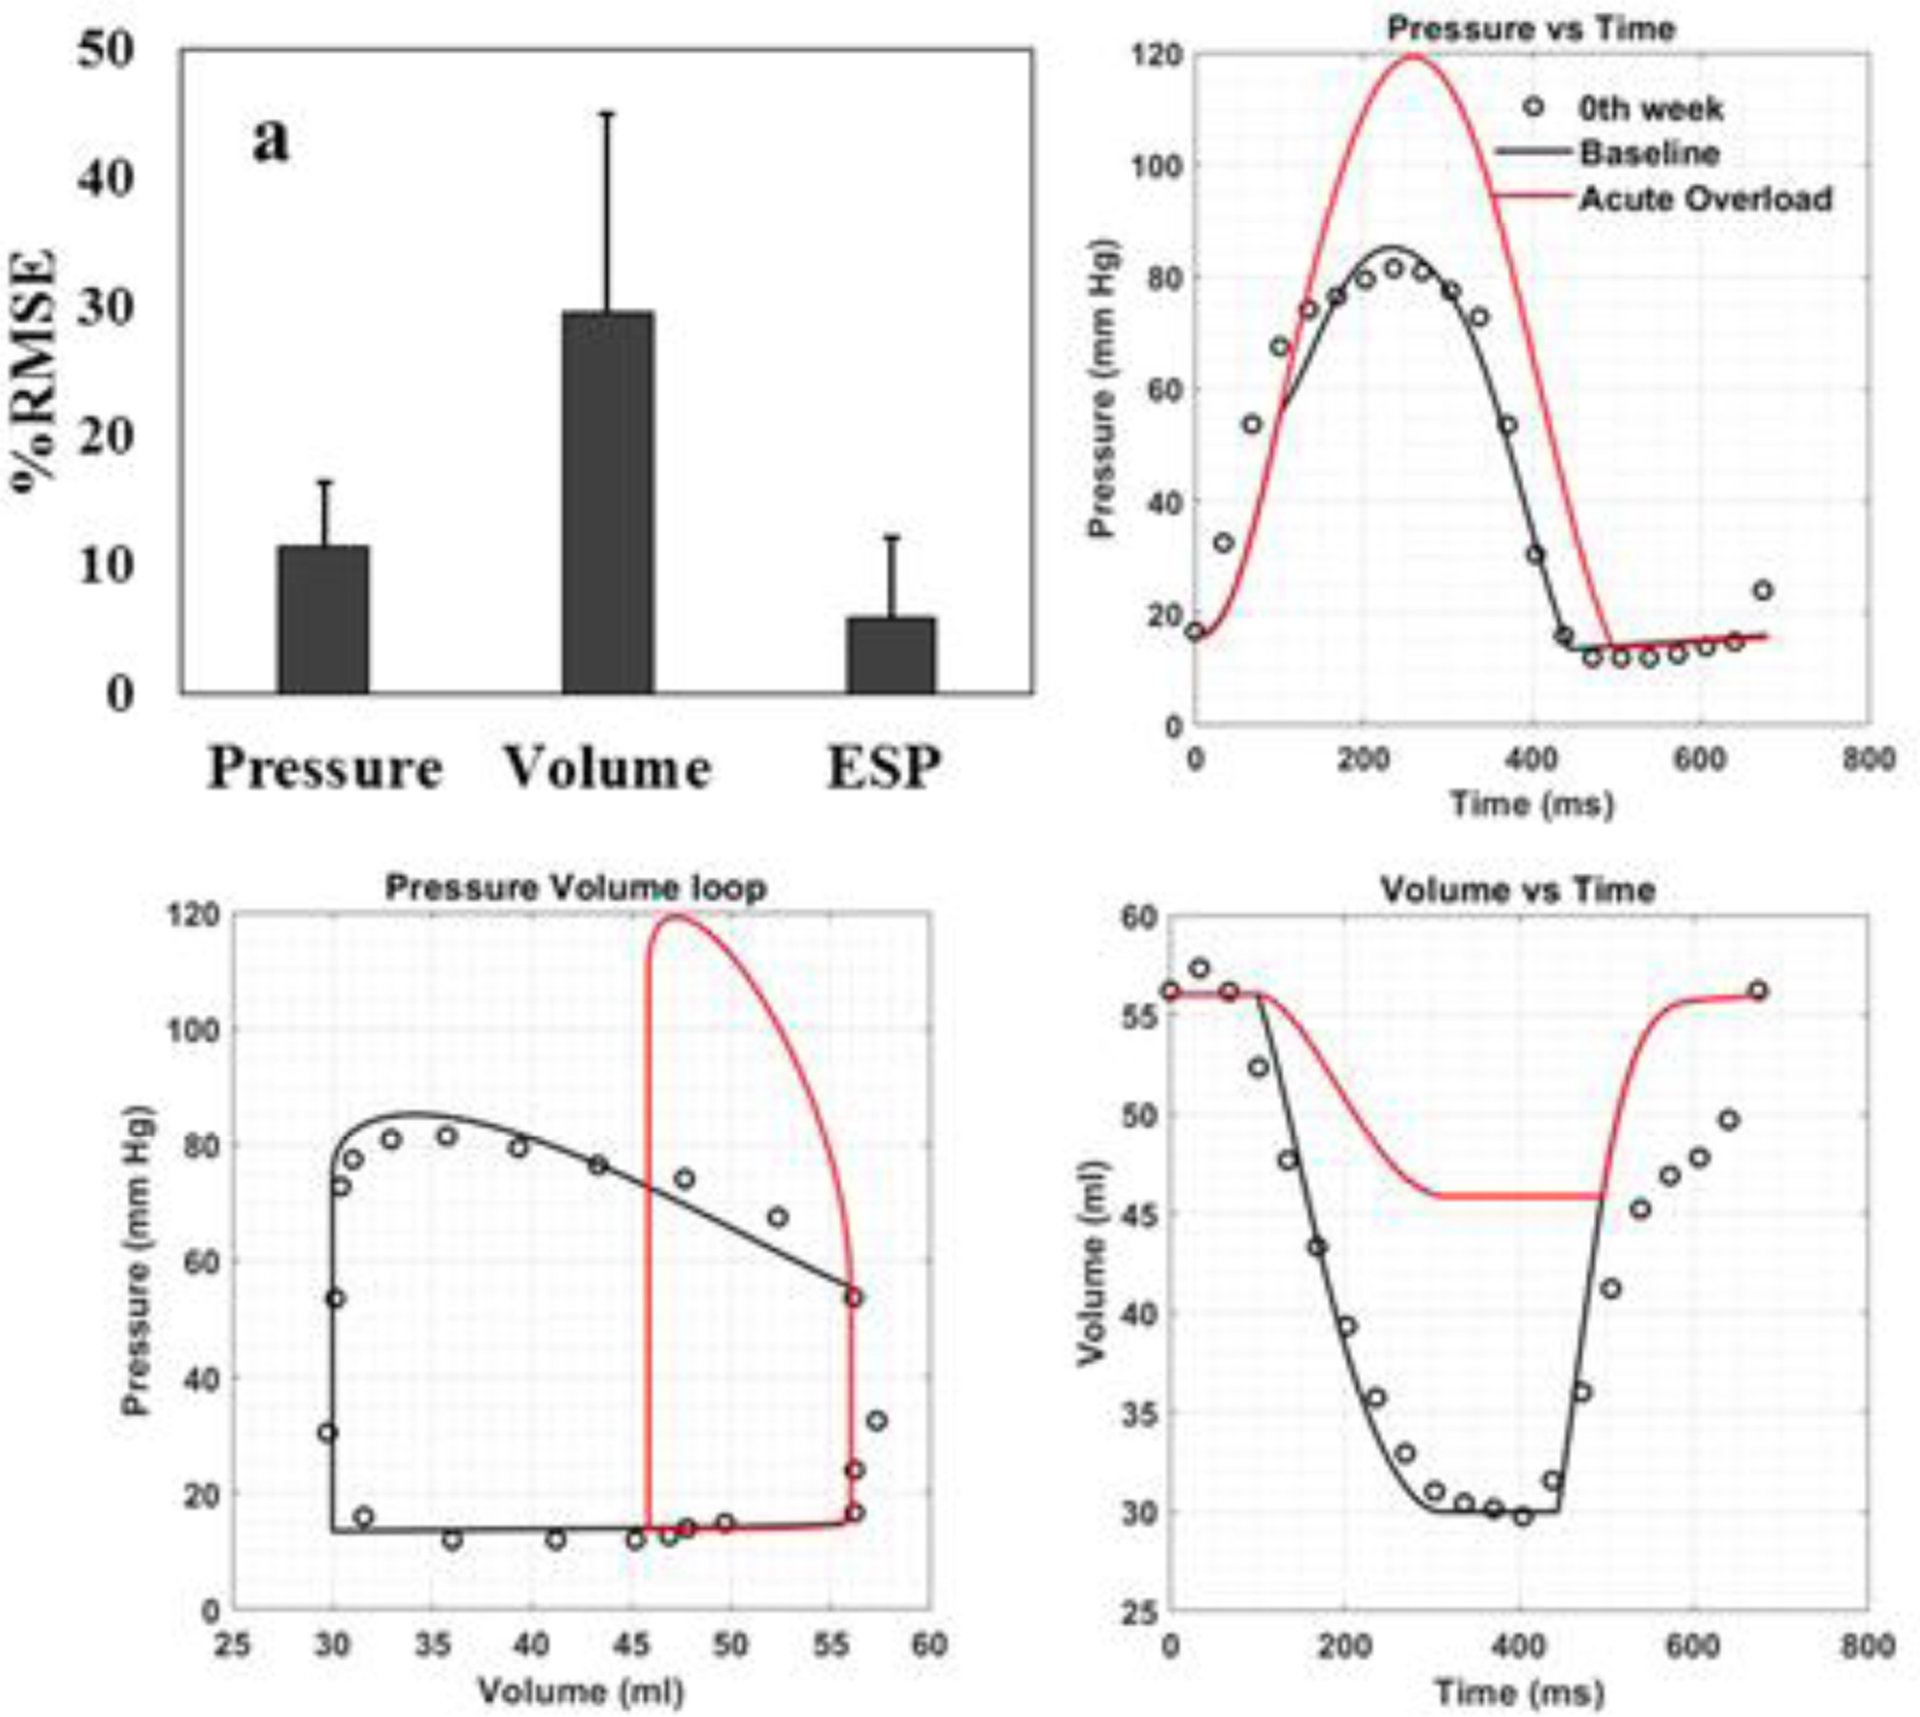
Comparison between model prediction and experimental measurements. (a) RMSE (expressed as mean ± SD) for pressure, volume waveforms and end systolic pressure over a cardiac cycle. (b) Temporal variation in pressure, (c) Pressure-volume relationship and (d) temporal variation in volume waveforms over a cardiac loop from one representative animal (Pig 2). Baseline simulation case (black line); experimental measurement (black dots); acute overload simulation case (red line). Note that there are no corresponding measurements for the acute overload simulation case (i.e., immediately after induction of pressure overload).
Comparison of stress and stretch between baseline and acute overload cases
Comparison of the spatially averaged normal stress and stretch in the fiber, sheet and sheet-normal directions between the baseline and acute overload cases reveals that the amount of normal stretch was reduced in all directions in the latter (Figure 4a–c). This corresponds to a reduction in end systolic volume (ESV) in the acute overload cases (Figure 3c). On the other hand, spatially averaged normal stress in all directions was increased in the acute overload cases (Figure 4d–f). Among the 3 stretch components, spatially averaged normal stretch in the sheet direction has the largest change (0.47 ± 0.194) associated with acute overload followed by that in the fiber (0.1 ± 0.041) and sheet-normal (0.086 ± 0.04) directions (Figure 4g). Conversely, spatially averaged myofiber stress has the largest change (10.66 ± 4.68 kPa) associated with acute overload followed by the sheet-normal (1.29 ± 0.82 kPa) and sheet stresses (0.48 ± 0.2 kPa) (Figure 4h).
Spatial correlation among growth and deviations
Pearson and Spearman rank correlation coefficients were computed to quantify the degree of correlation of growth with the change in maximum, mean and minimum in the 6 mechanical quantities over a cardiac cycle (18 coefficients in total) for each pig. Averaging the coefficients over the 4 pigs reveals that the changes in maximum fiber stress (0.5471) has the strongest correlation with growth, followed by the changes in the mean sheet-normal stress (0.5266) based on the Pearson correlation coefficient (Figure 5a). Based on the Spearman rank correlation coefficient, the changes in mean sheet normal stress (0.5256) and mean fiber stress (0.5204) show the strongest correlation with growth, followed by the changes in the maximum fiber stress (0.5111) (Figure 5b). On the other hand, none of the stretch components has a good correlation with growth with changes in the mean sheet-normal stretch showing the worst correlation with growth (Pearson = 0.02066, Spearman rank = 0.04267). Averaging the change in maximum fiber stress over the 4 pigs reveals that the largest increase occurs in the LV free wall, which also shows the greatest increase in wall thickness (Figure 5c). The regional changes associated with the mechanical quantities for each pig model are shown in Figure 8 in the Appendix C.
Figure 5: (a).
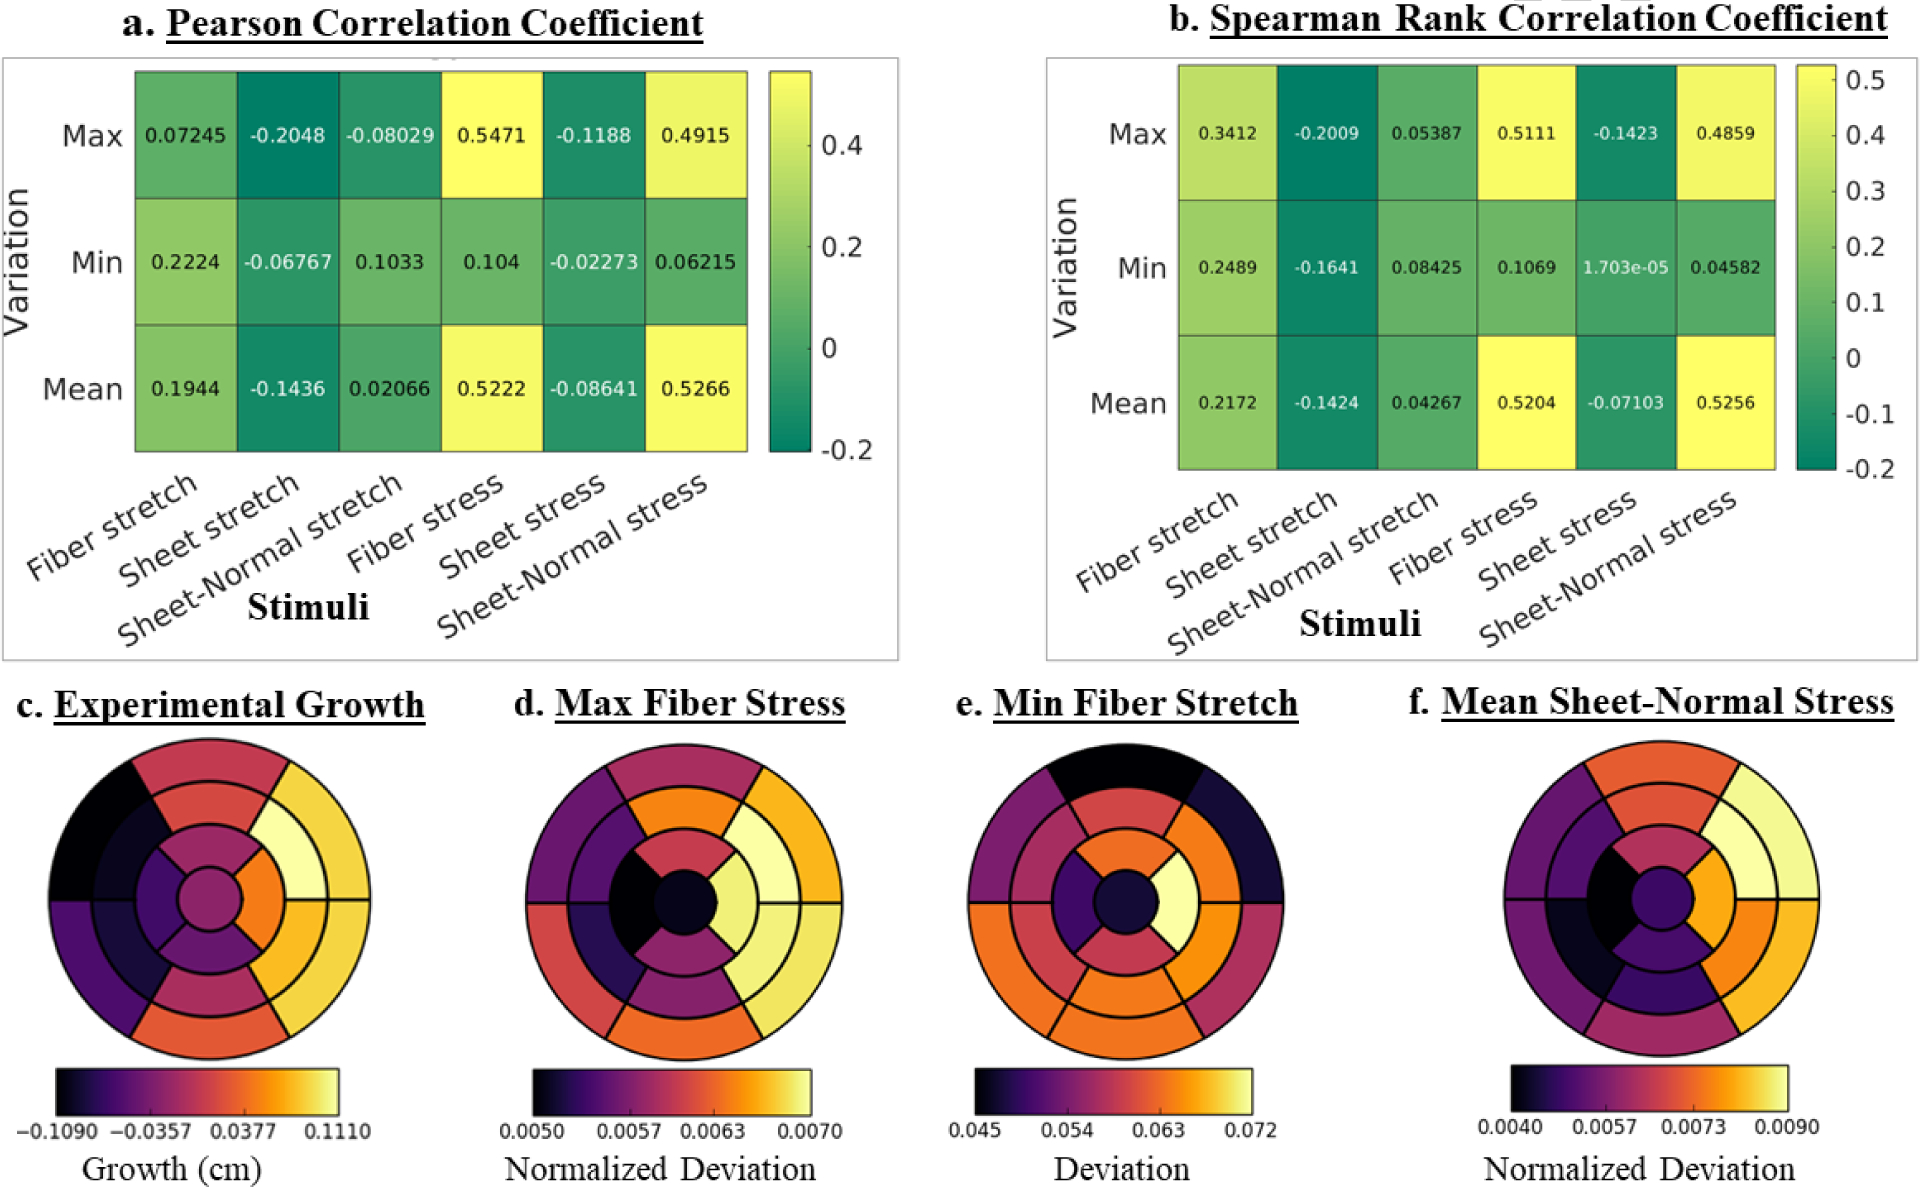
(a) Pearson, (b) Spearman rank correlation coefficients of growth with changes in maximum, minimum and mean stress and stretch over a cardiac cycle. (c) Regional growth measured experimentally. (d) – (f): Regional changes (arithmetic differences between acute overload and baseline cases) of the maximum fiber stress, minimum fiber stretch and mean sheet-normal stress. Quantities are averaged over 4 pigs. Regional changes in maximum fiber stress and mean sheet-normal stress are normalized by their corresponding magnitude from baseline.
Scatter plots of the local changes in maximum fiber, mean sheet-normal and mean fiber stresses (that have the best correlation) with local growth in the LV are shown in Figure 6 for a representative case. In this case, the changes in the maximum fiber stress (Pearson: 0.5471, Spearman: 0.5111) showed the strongest correlation with growth whereas changes in the minimum sheet-normal stretch (Pearson: 0.02066, Spearman: 0.04267) showed the worst correlation (see Figure 9 and 10 in Appendix C for correlation of each pig).
Figure 6.
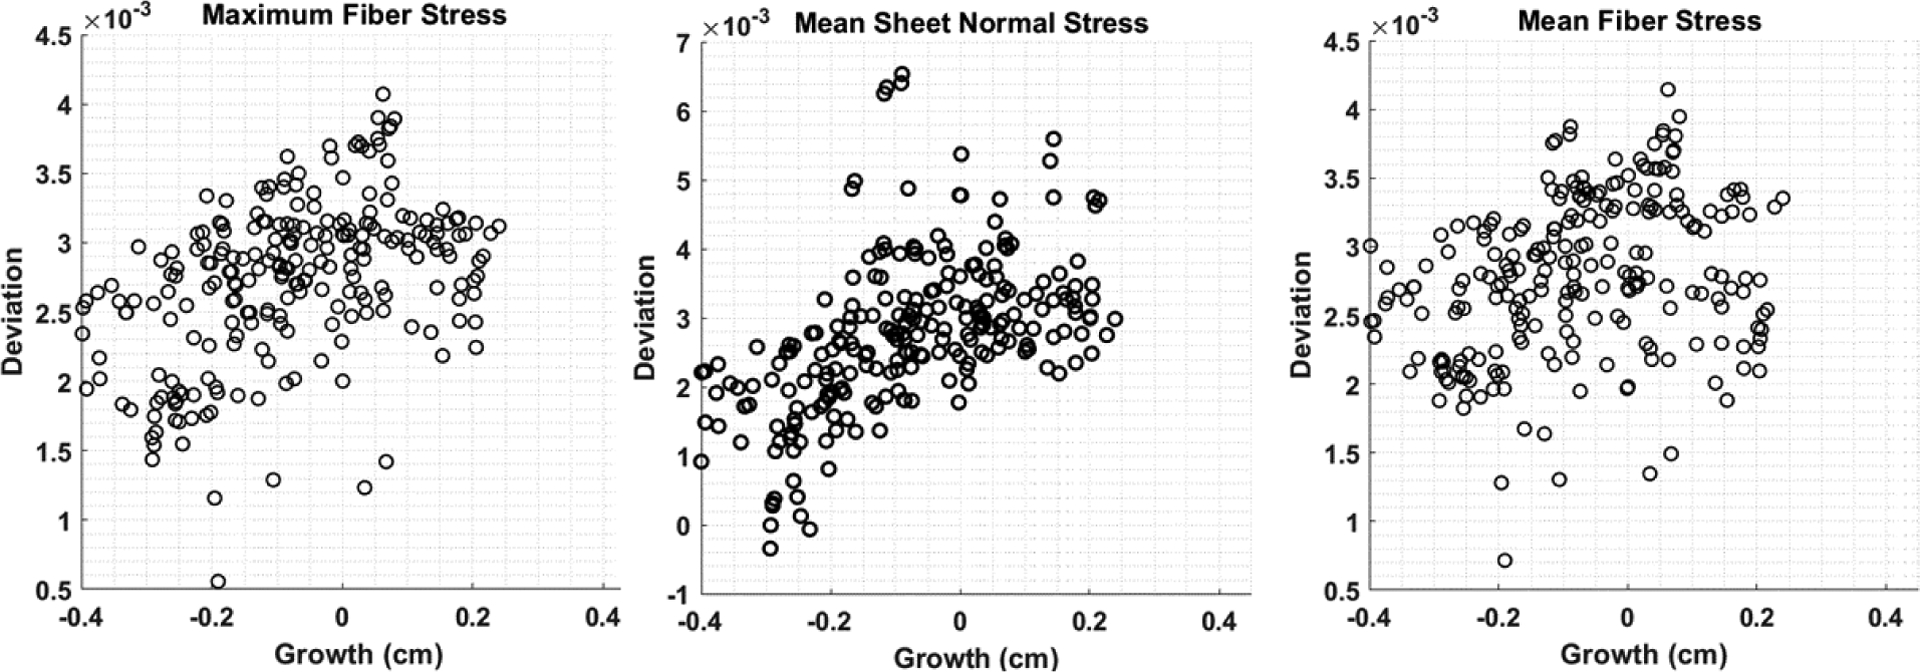
Scatter plots of the local growth with changes in stimuli in the LV of a representative case (pig 1). These three stimuli show best correlation with growth (see Figure 5a). Deviation of each stimulus (which correspond to a feature of the time-varying waveform over a cardiac cycle i.e., maximum and mean at a material point) is defined by its arithmetic differences between the acute overload and baseline cases.
DISCUSSION
The key finding of this study is that regional changes in LV wall thickness best correlates with acute regional changes in the maximum and mean myofiber stress followed by changes in the (mean) sheet-normal stress in the aortic banding pig model. The study, however, did not find any correlation between regional growth and acute changes of the myocardial stretches. Correspondingly, this study suggests myofiber stress as the likely stimulus for concentric hypertrophy caused by pressure overload.
The experimental results are consistent with previous studies of pressure overload using aortic constriction large animal (porcine and sheep) model, which reported an increase in systolic pressure (~27% vs. ~42% here), elevated aortic pressure gradient (~40 mmHg vs. ~31mmHg here), increase in LV diameter and EDV [31–34]. The increase in LVFW thickness found here is also consistent with a study, which reported an increase in posterior wall thickness (~31% vs. ~8% here) (and a reduction in ejection fraction (~12% vs. ~10% here) 2nd week after aortic constriction in a mouse model [35]. We note, however, that some experimental studies have reported a decrease in EDV (~31%) (over a longer time period of 4 weeks) in a swine model of severe aortic stenosis [36] and preserved ejection fraction [37].
As discussed in several reviews of tissue growth and remodeling [38–40], the fundamental question of whether stress or strain is the mechanical stimulus driving tissue growth remains elusive. The “systolic-stress-correction hypothesis” proposed by Grossman et al. [6, 9] (in one of the earliest work related to cardiac growth) suggests that ventricular wall thickens to normalize the systolic wall stress that would otherwise increase in the pressure overloaded heart. A number of FE-based computational modeling studies [17, 19, 20] have also shown that using myocardial stress as growth stimulus can reproduce features associated with concentric hypertrophy. Specifically, these studies have either used all components of the stress tensor [19] or the trace of stress tensor [17, 20]. Maksuti et al. also showed in a study based on a lumped parameter model that using stress as the growth stimulus can reproduce clinical measurements in patients with aortic stenosis [41]. Conversely, Kerckhoff et al. showed that a constitutive growth model with deviation of fiber and cross-fiber strain from their homeostatic set point as the stimuli can reproduce global remodeling features associated with pressure and volume overload [18].
Unlike the above-mentioned studies that prescribe a growth constitutive model a-priori to determine if the growth stimulus can reproduce experimental and clinical global features of pressure overload, we directly compare model predictions of the animal-specific regional (local) changes in the ventricular mechanics due immediately to pressure-overload with the corresponding regional (local) changes in wall thickness measured experimentally. By performing a correlation analysis of regional growth with regional changes in the mechanics of 4 aortic banding pigs, we found that the changes in maximum and mean fiber stress exhibits the strongest (positive) correlation with growth (Figure 5a), where regions that has the largest (smallest) changes in maximum and mean fiber stress correspond to regions that has the largest (smallest) increase in wall thickness (Figure 5b). These results support the “systolic stress-correction hypothesis” that had been applied in some growth constitutive model. Here we note that while our analysis, which is based on correlating the acute (immediate) mechanical changes of pressure overload with chronic changes in geometry, supports the hypothesis, it does not determine whether the maximum/mean fiber stress is normalized. In other words, our finding of an association between regional (maximum and mean) fiber stress and regional growth is not able to definitively prove the “systolic stress-correction” hypothesis, but only provide support that the myofiber stress could be a growth stimulus. To fully test the “systolic stress-correction hypothesis” will require an analysis of whether the maximum fiber stress is normalized within a reasonable time scale in future studies.
Interestingly, our result shows that regional (acute) changes in myocardial stretches are not correlated with the regional changes in LV wall thickness. This is despite our findings showing that the myocardial stretches change globally in response to pressure overload (Figure 4) in a manner that is consistent with clinical studies of aortic stenosis patients [42–44] and acute experimental studies of pressure overload in dogs [45] (where the amount of shortening in both the major and minor axes and the amount of thickening are reduced). Correspondingly, these results suggest that while using the changes in myocardial stretches as growth stimuli may be sufficient to describe changes in global features of remodeling, it may not be sufficient to reproduce regional changes in LV wall thickness associated with pressure overload. As suggested in our study, it is necessary to prescribe myofiber stresses as the local stimuli in the growth constitutive law in order to capture regional geometrical changes in the LV thickness associated with pressure overload.
The finding suggesting that myofiber stress is the driver for concentric hypertrophy at the continuum level can be connected to the cellular level mechanotransduction process, in which extracellular, intracellular and intercellular mechanical stimuli sensed by protein complexes are coupled to the cytoskeleton [46, 47]. In pressure overload hypertrophy (as well as dilated cardiomyopathy), muscle ankyrin repeat protein (MARP) expression level increases with increased mechanical load. It is hypothesized that this increment allows titin to sense and respond to mechanical stresses transmitted from the ECM and the T-cap/titin interaction at the Z-disc to be stabilized by Muscle LIM protein (MLP). On the other hand, the Adherens junctions, which are highly localized to the intercalated discs at the longitudinal borders of myocytes in the adult ventricle, sense mechanical loads transmitted primarily in the longitudinal direction that permits directional specificity in the mechanotransduction process. Bi-directional transmission of cytoskeletal tension between cells is also facilitated by Cadherins. Also the stress signal may be transduced by following the mitogen-activated protein kinases (MAPK) and the janus kinase / signal transducers and activators of transcription (JAK/STAT) pathways [48]. Further research on mechanotransduction of stress will be helpful to better understand the specific mechanisms in the development of cardiac hypertrophy.
LIMITATIONS
There are limitations associated with this study. First, we assume the elevated peak systolic pressure measured at 2 weeks after aortic banding is similar to that immediately after banding. We, however, do not expect this assumption to substantially affect our results given that pressure (a global quantity) only affects the magnitude of the mechanical quantities but have a small effect on their regional distribution. Second, we have focused largely on regional changes in LV wall thickness and did not take into account wall lengthening associated with the slight eccentric hypertrophy found in the experiments (i.e., slight increase in EDV). This is largely because local wall lengthening is difficult to measure from the experimental data as compared to local wall thickening. Future studies measuring local wall lengthening with the implantation of microbeads may address this issue. Third, our analysis based on the Pearson and Spearman correlation coefficients simply determine if there is an association between regional acute mechanical changes of pressure overload with regional chronic changes in geometry due to growth. Further analysis using growth model can ensure whether the mechanical quantities are normalized with growth to test the “systolic stress-correction” hypothesis. Fourth, the analysis can be improved by measuring immediate changes of local strain due to pressure overload, which can be applied to calibrate the model. Fifth, we have assumed a commonly used transmural distribution of fiber angle from +60° at endocardium to −60° at epicardium in all the simulations based on the findings by Streeter et al. [21]. Nevertheless, repeating the same analysis in a pig model based on different transmural distributions of the fiber angle measured reported by Streeter et al. [49] and Papadacci et. al. [50] does not change the study conclusion that regional changes in wall thickness are more strongly correlated with regional changes in fiber stress (Appendix D). Sixth, we have focused our investigations on mechanical stimulus of growth and did not include other neurological or biochemical stimuli in the study. Last, we did not consider any acute changes in the local electromechanical excitation-induced contraction mechanisms arising from pressure overload, and have assumed that the activation remains homogeneous.
CONCLUSION
Using a combination of experiments and FE modeling, we investigated the correlation between growth after aortic banding and the changes in different mechanical quantities – stress and stretch along 3 orthogonal material directions – immediately after aortic banding. The results show strong correlation between measured regional growth as indexed by a change in the local wall thickness and the local acute changes in maximum and mean fiber stress over cardiac cycle.
Acknowledgments
This work is supported by National Institutes of Health grants (R01 HL134841 and U01 HL133359) and AHA SDG (17SDG33370110) grant. The authors declare that they have no conflicts of interest. All applicable international, national and institutional guidelines for the care and use of animals were followed.
APPENDIX A. (MESH SENSITIVITY ANALYSIS)
Figure 7:
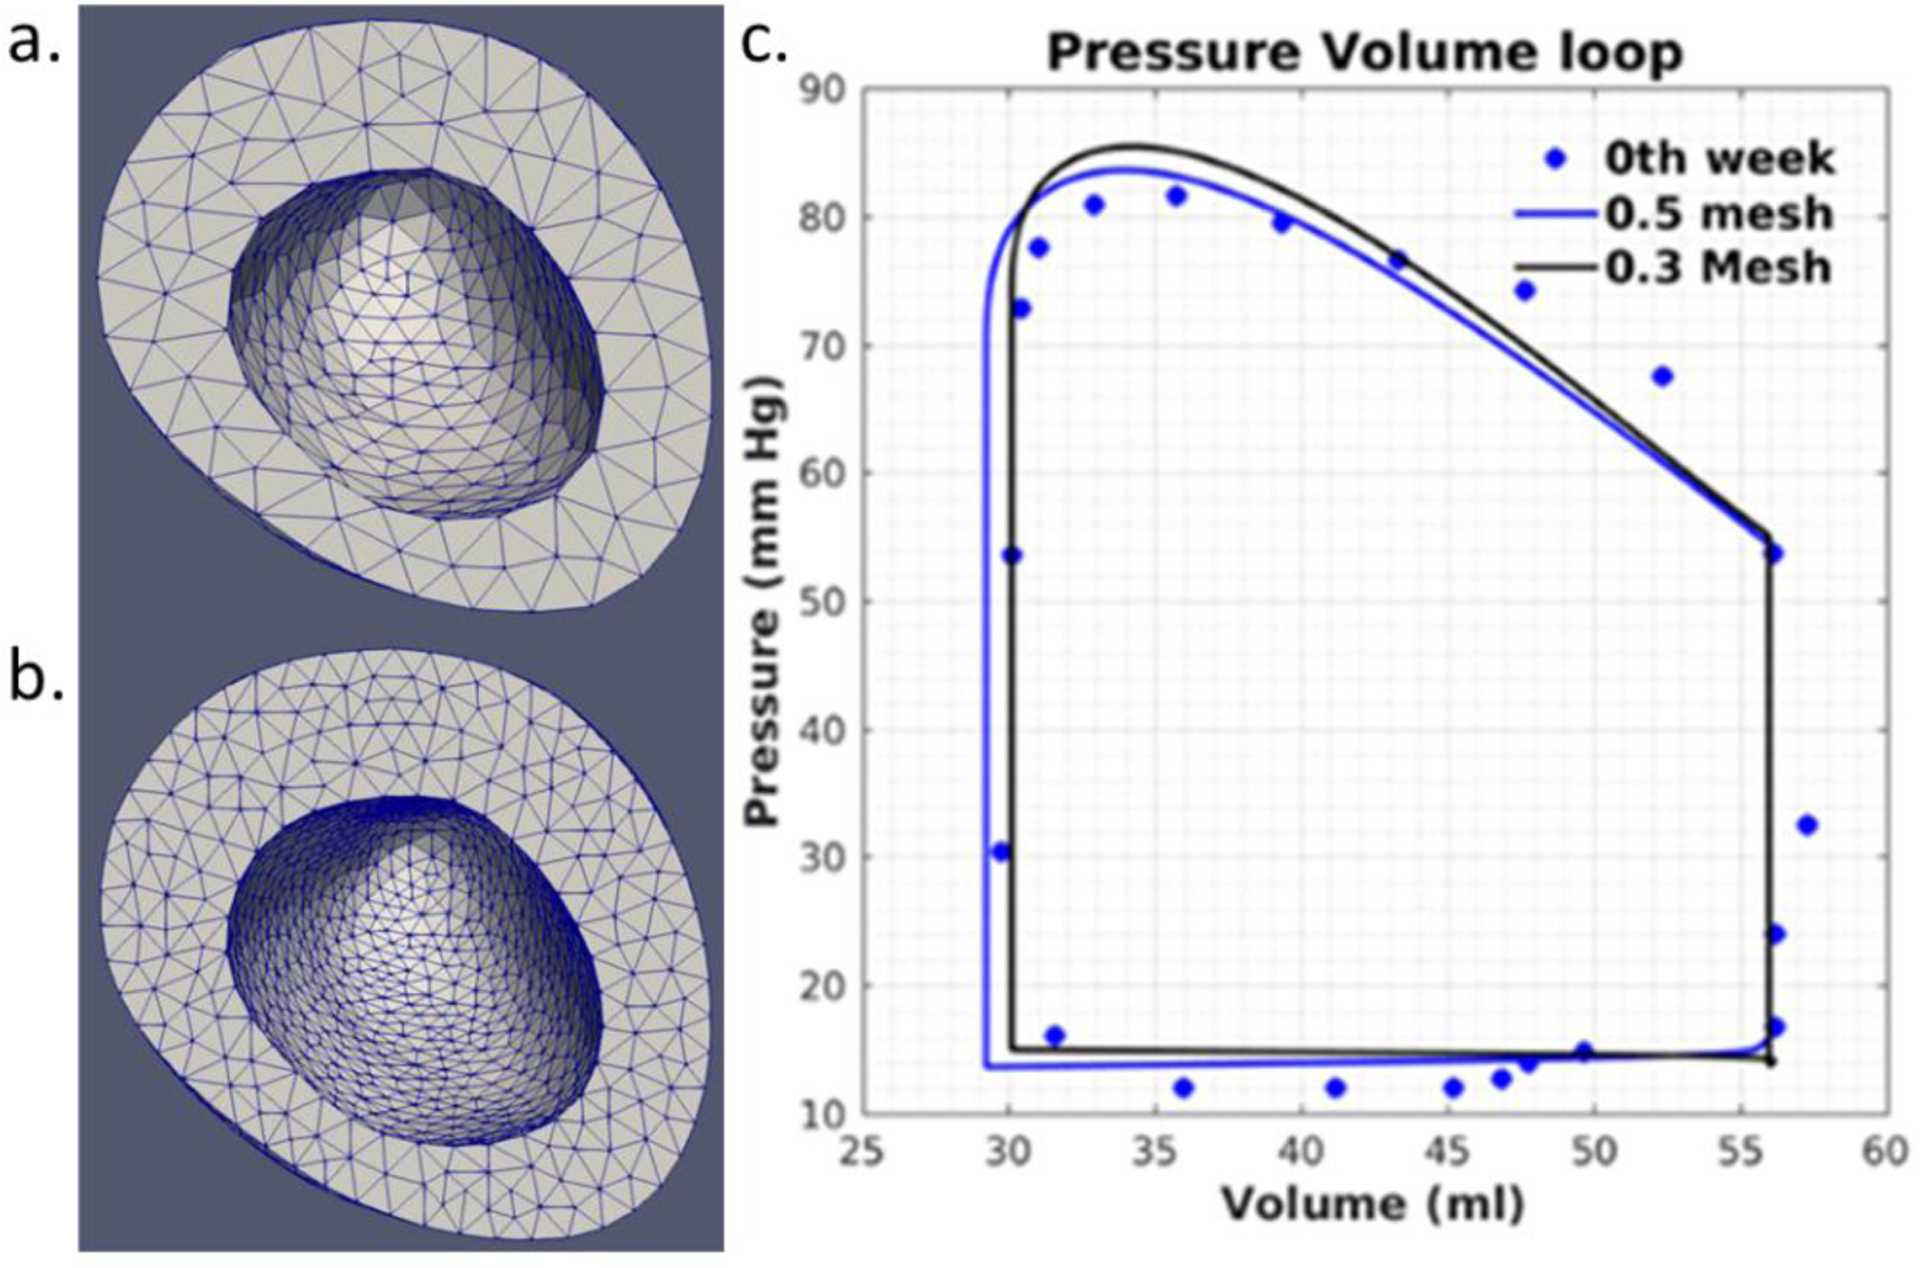
Mesh sensitivity analysis using two different element sizes for Pig 2. Mesh generated with a. ~4000 quadratic tetrahedral elements (element characteristic length ~0.55mm) and b. ~11550 quadratic tetrahedral elements (element characteristic length ~0.40mm). c. Pressure-volume loop for different element size.
APPENDIX B: CALIBRATED MODEL PARAMETERS
Table-2:
Model parameters for LV mechanics
| Description | Parameter | Pig 1 | Pig 2 | Pig 3 | Pig 4 |
|---|---|---|---|---|---|
| Material parameter, kPa | C | 0.077 | 0.06 | 0.0094 | 0.0054 |
| Material parameter | bff | 29.0 | 29.0 | 29.0 | 29.0 |
| Material parameter | bxx | 26.6 | 26.6 | 26.6 | 26.6 |
| Material parameter | bfs | 13.3 | 13.3 | 13.3 | 13.3 |
| Isometric tension under maximal activation, kPa | Tmax | 45 | 61.3 | 51.1 | 57.2 |
| Peak intracellular calcium concentration, μM | Ca0 | 4.35 | 4.35 | 4.35 | 4.35 |
| Maximum peak intracellular calcium concentration, μM | (Ca0)max | 4.35 | 4.35 | 4.35 | 4.35 |
| Governs shape of peak isometric tension-sarcomere length relation, μm−1 | B | 4.75 | 4.75 | 4.75 | 4.75 |
| Sarcomere length at which no active tension develops, μm | l0 | 1.58 | 1.58 | 1.58 | 1.58 |
| Time to peak tension, ms | t0 | 320 | 270 | 300 | 270 |
| Slope of linear relaxation duration-sarcomere length relation, ms μm−1 | m | 240 | 265 | 240 | 220 |
| Time-intercept of linear relaxation duration-sarcomere length relation, ms | b | −220 | −255 | −220 | −220 |
| Relaxed sarcomere length, μn | Ir | 1.85 | 1.85 | 1.85 | 1.85 |
| Windkessel Parameter | Baseline model | ||||
| Aortic valve compliance, ml Pa | ca | 0.0075 | 0.0025 | 0.0073 | 0.0035 |
| Peripheral resistance, Pa ms ml−1 | Rp | 170000 | 110500 | 48000 | 70000 |
| Aortic valve resistance, Pa ms ml−1 | Ra | 9000 | 0.000005 | 0.00005 | 1000 |
| Windkessel parameter | Acute overload model | ||||
| Aortic valve compliance, ml Pa | ca | 0.0055 | 0.0014 | 0.004 | 0.0028 |
| Peripheral resistance, Pa ms ml−1 | Rp | 12000000 | 37570000 | 18000000 | 23760000 |
| Aortic valve resistance, Pa ms ml−1 | Ra | 20000 | 50000 | 40000 | 17000 |
APPENDIX C: MODEL PREDICTION AND CORRELATION COEFFICIENTS OF EACH PIG MODEL
Figure 8:
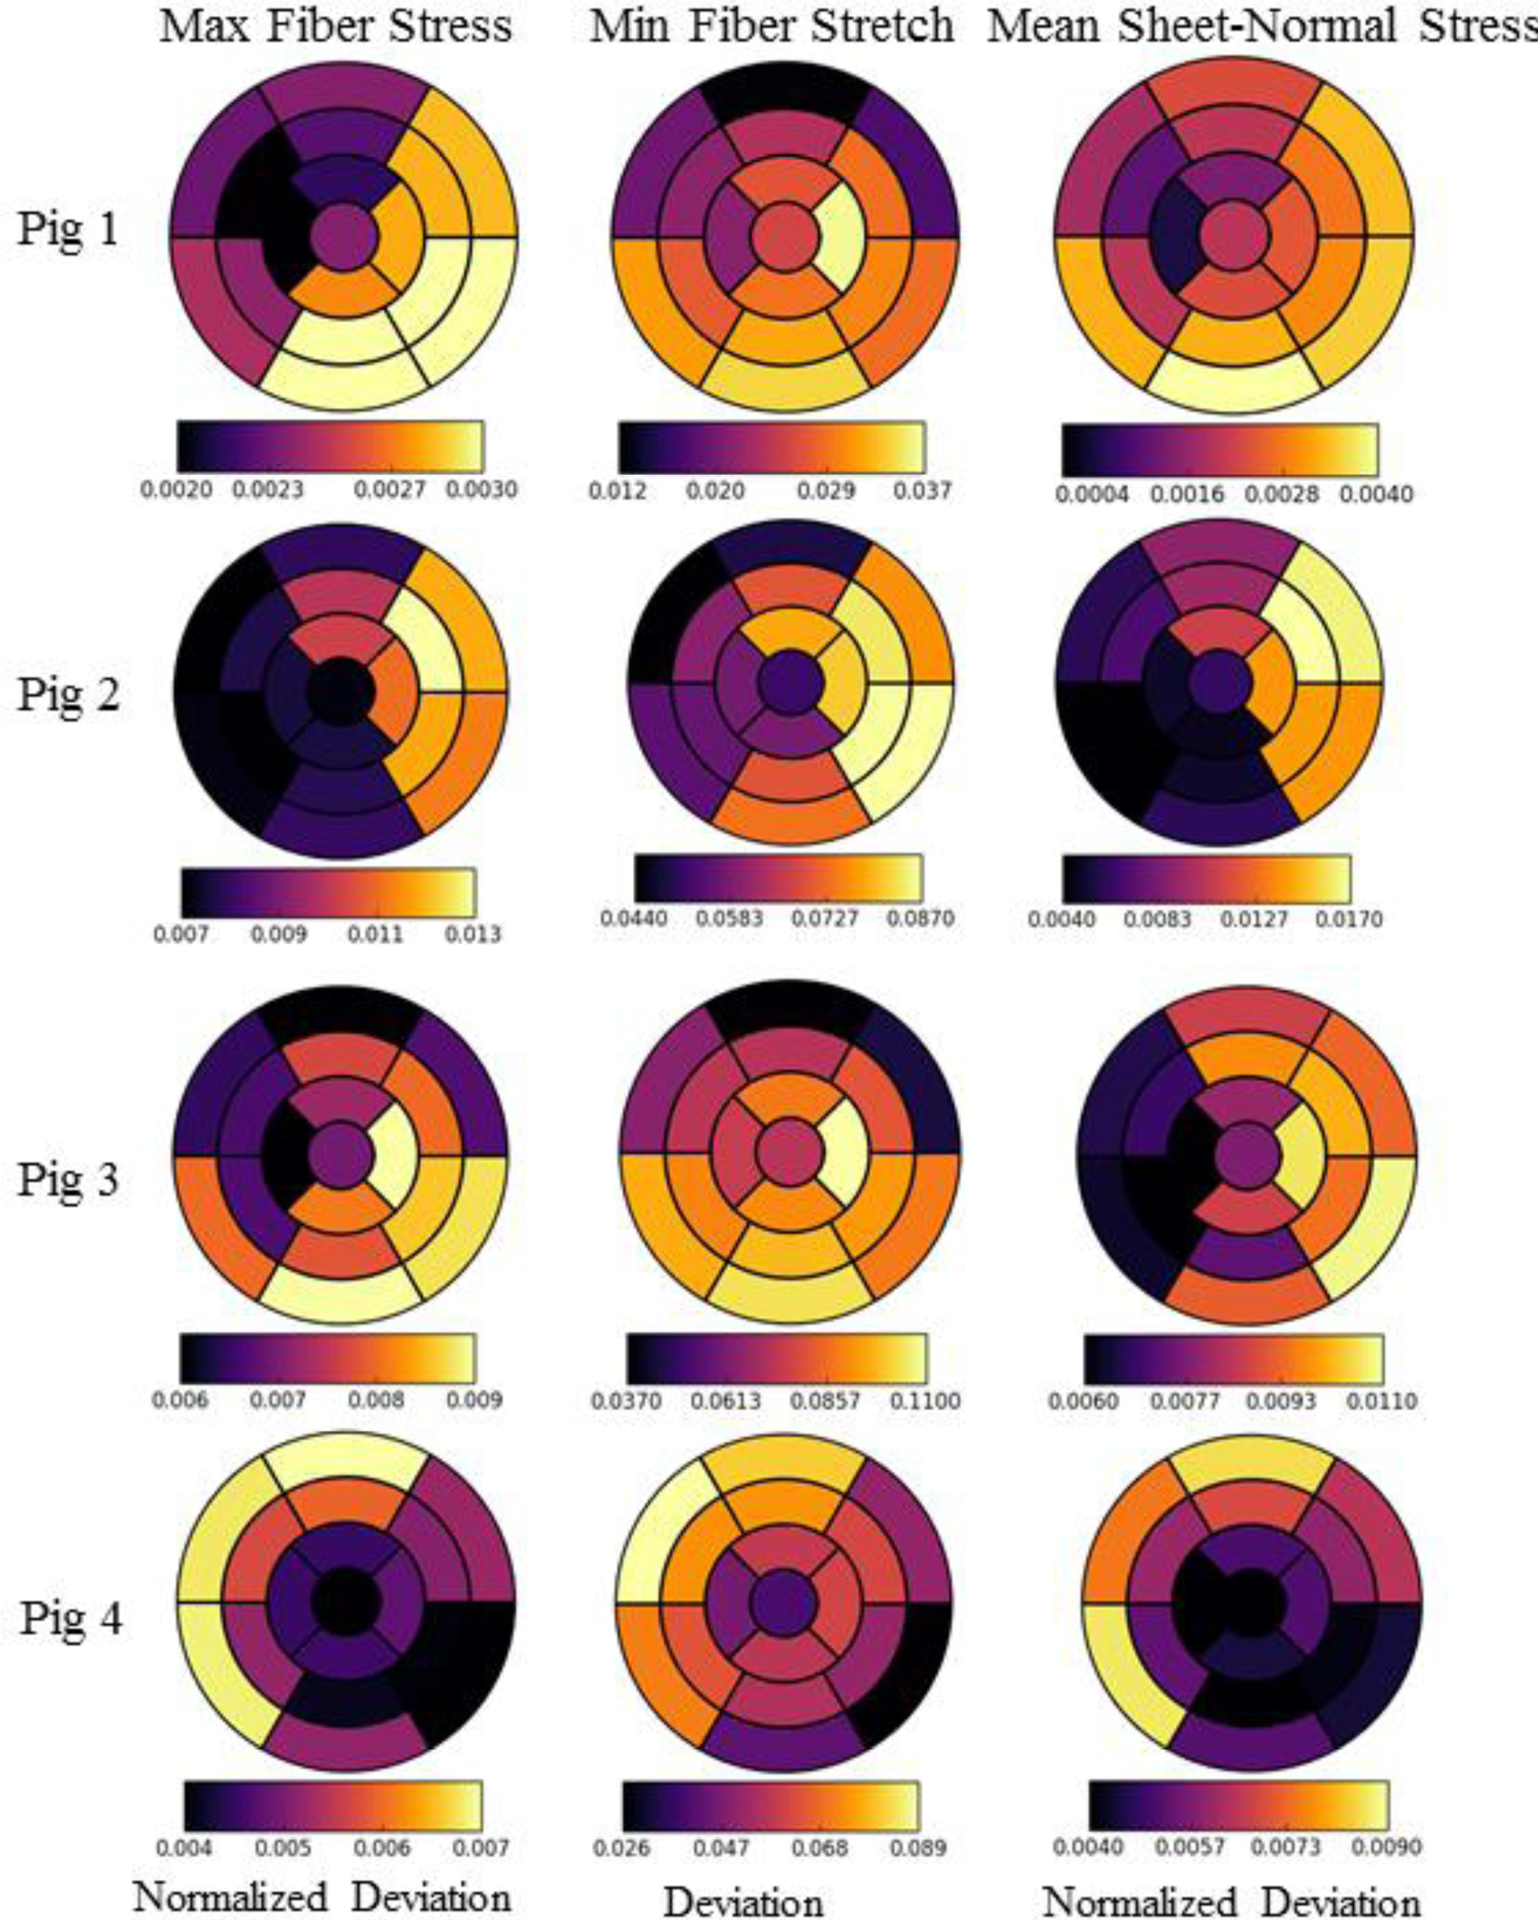
Regional changes in maximum, minimum and mean fiber stress, fiber stretch and sheet-normal stress, respectively, based on the AHA segmentation for the 4 pig models. Deviation in minimum fiber stretch refers to the arithmetic differences between baseline and the acute cases over a cardiac cycle. Normalized deviation in the maximum fiber and mean sheet-normal stresses refer to the arithmetic differences between baseline and the acute cases normalized by the absolute magnitude of the corresponding value of the baseline case.
Figure 9:
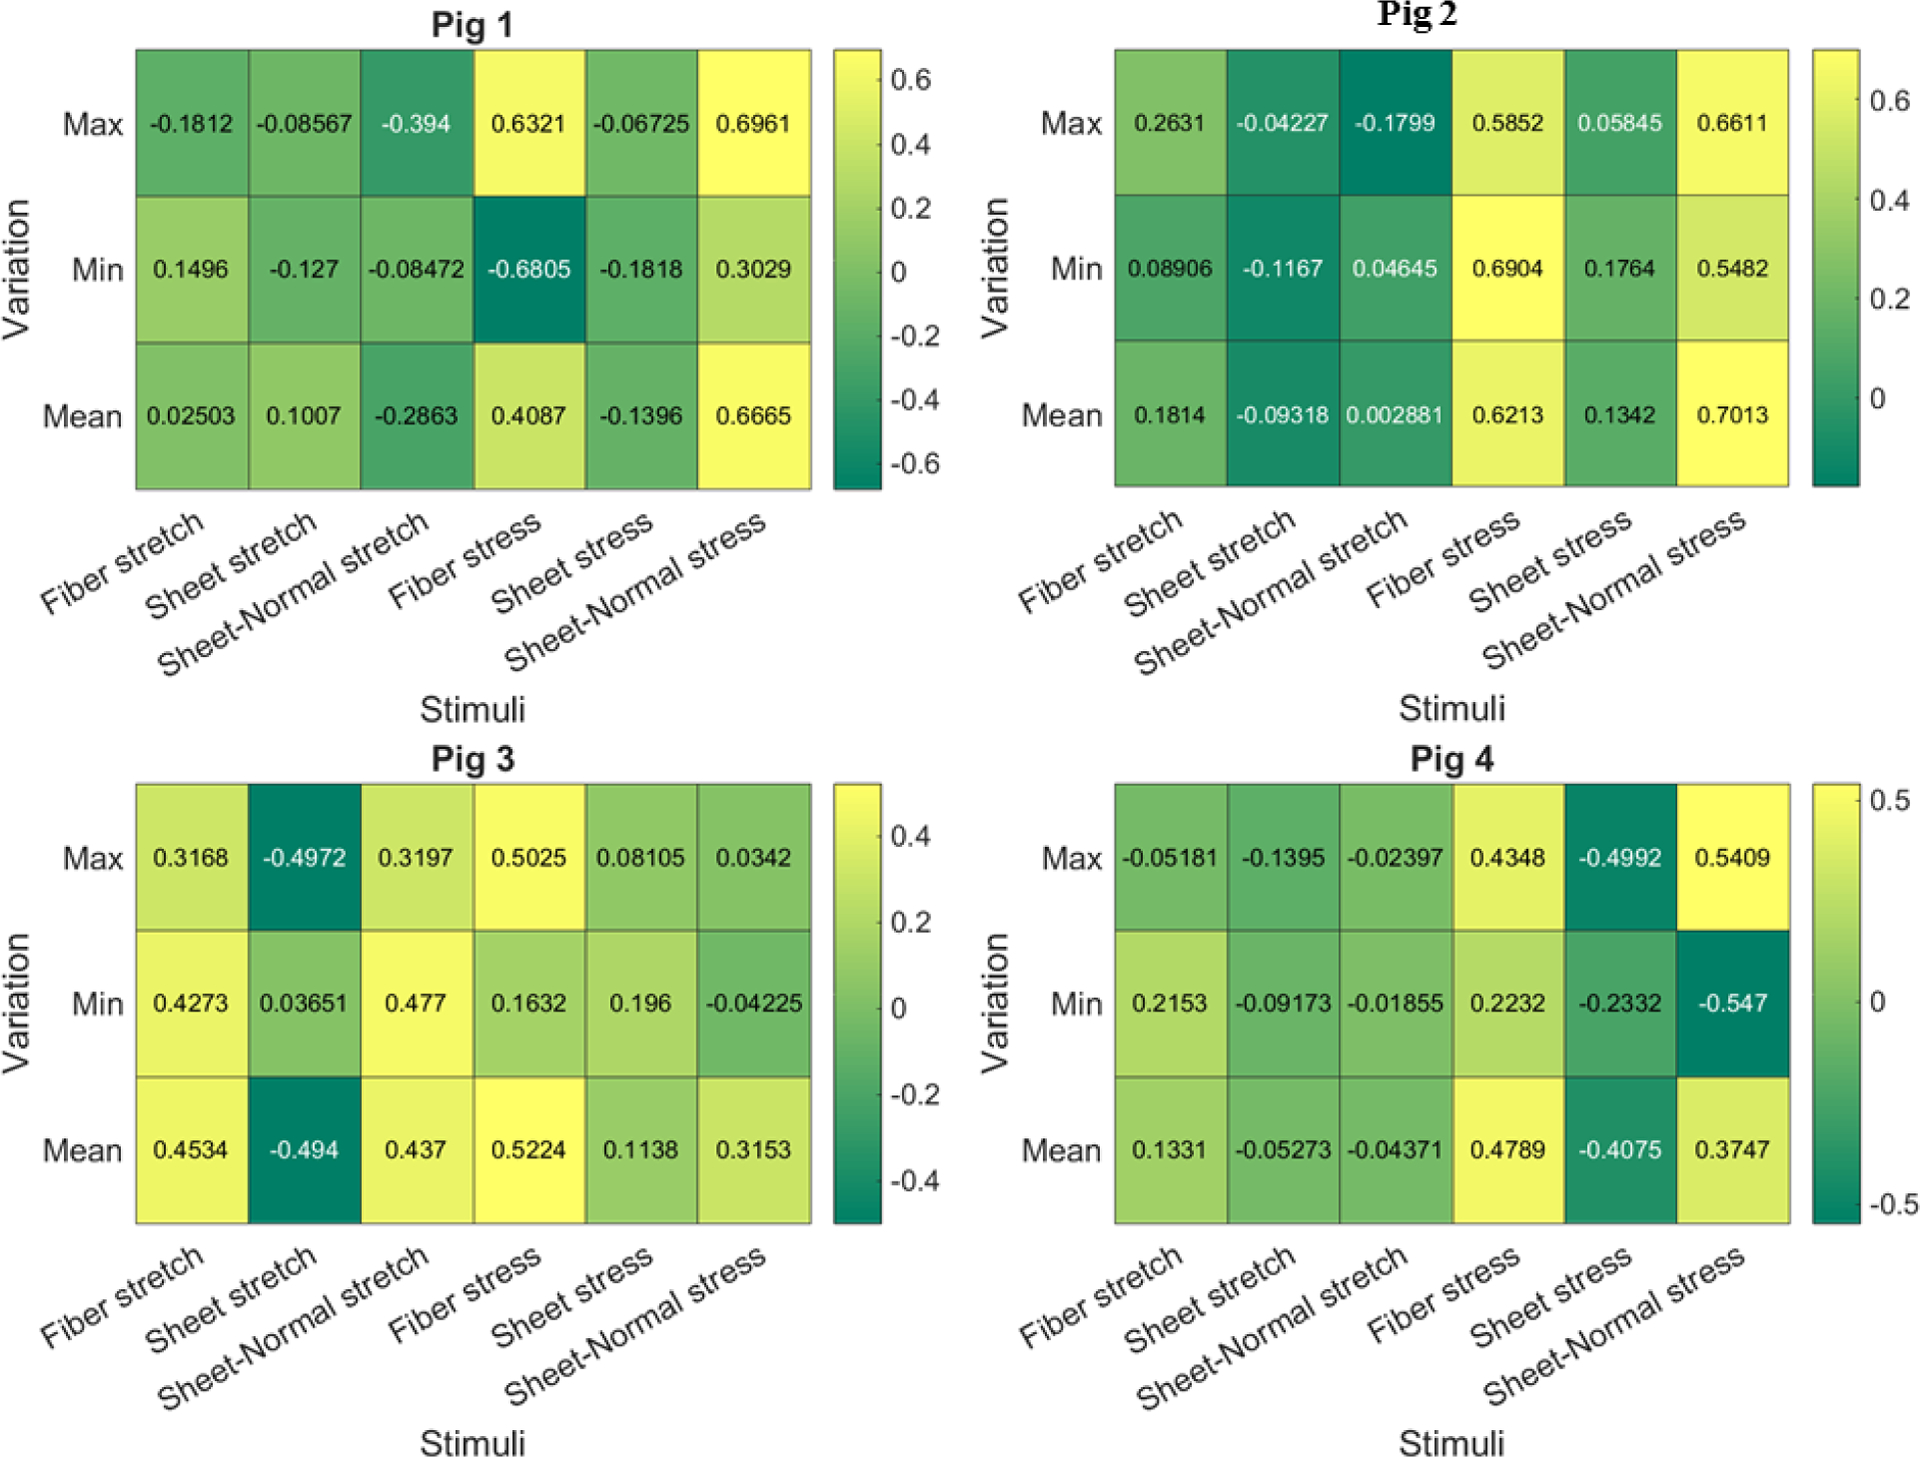
Pearson correlation coefficient of the 18 mechanical stimuli with growth for the 4 pig models. Value close to +1 or −1 indicates strong positive and negative correlation, respectively. Value close to 0 indicates no correlation.
Figure 10:
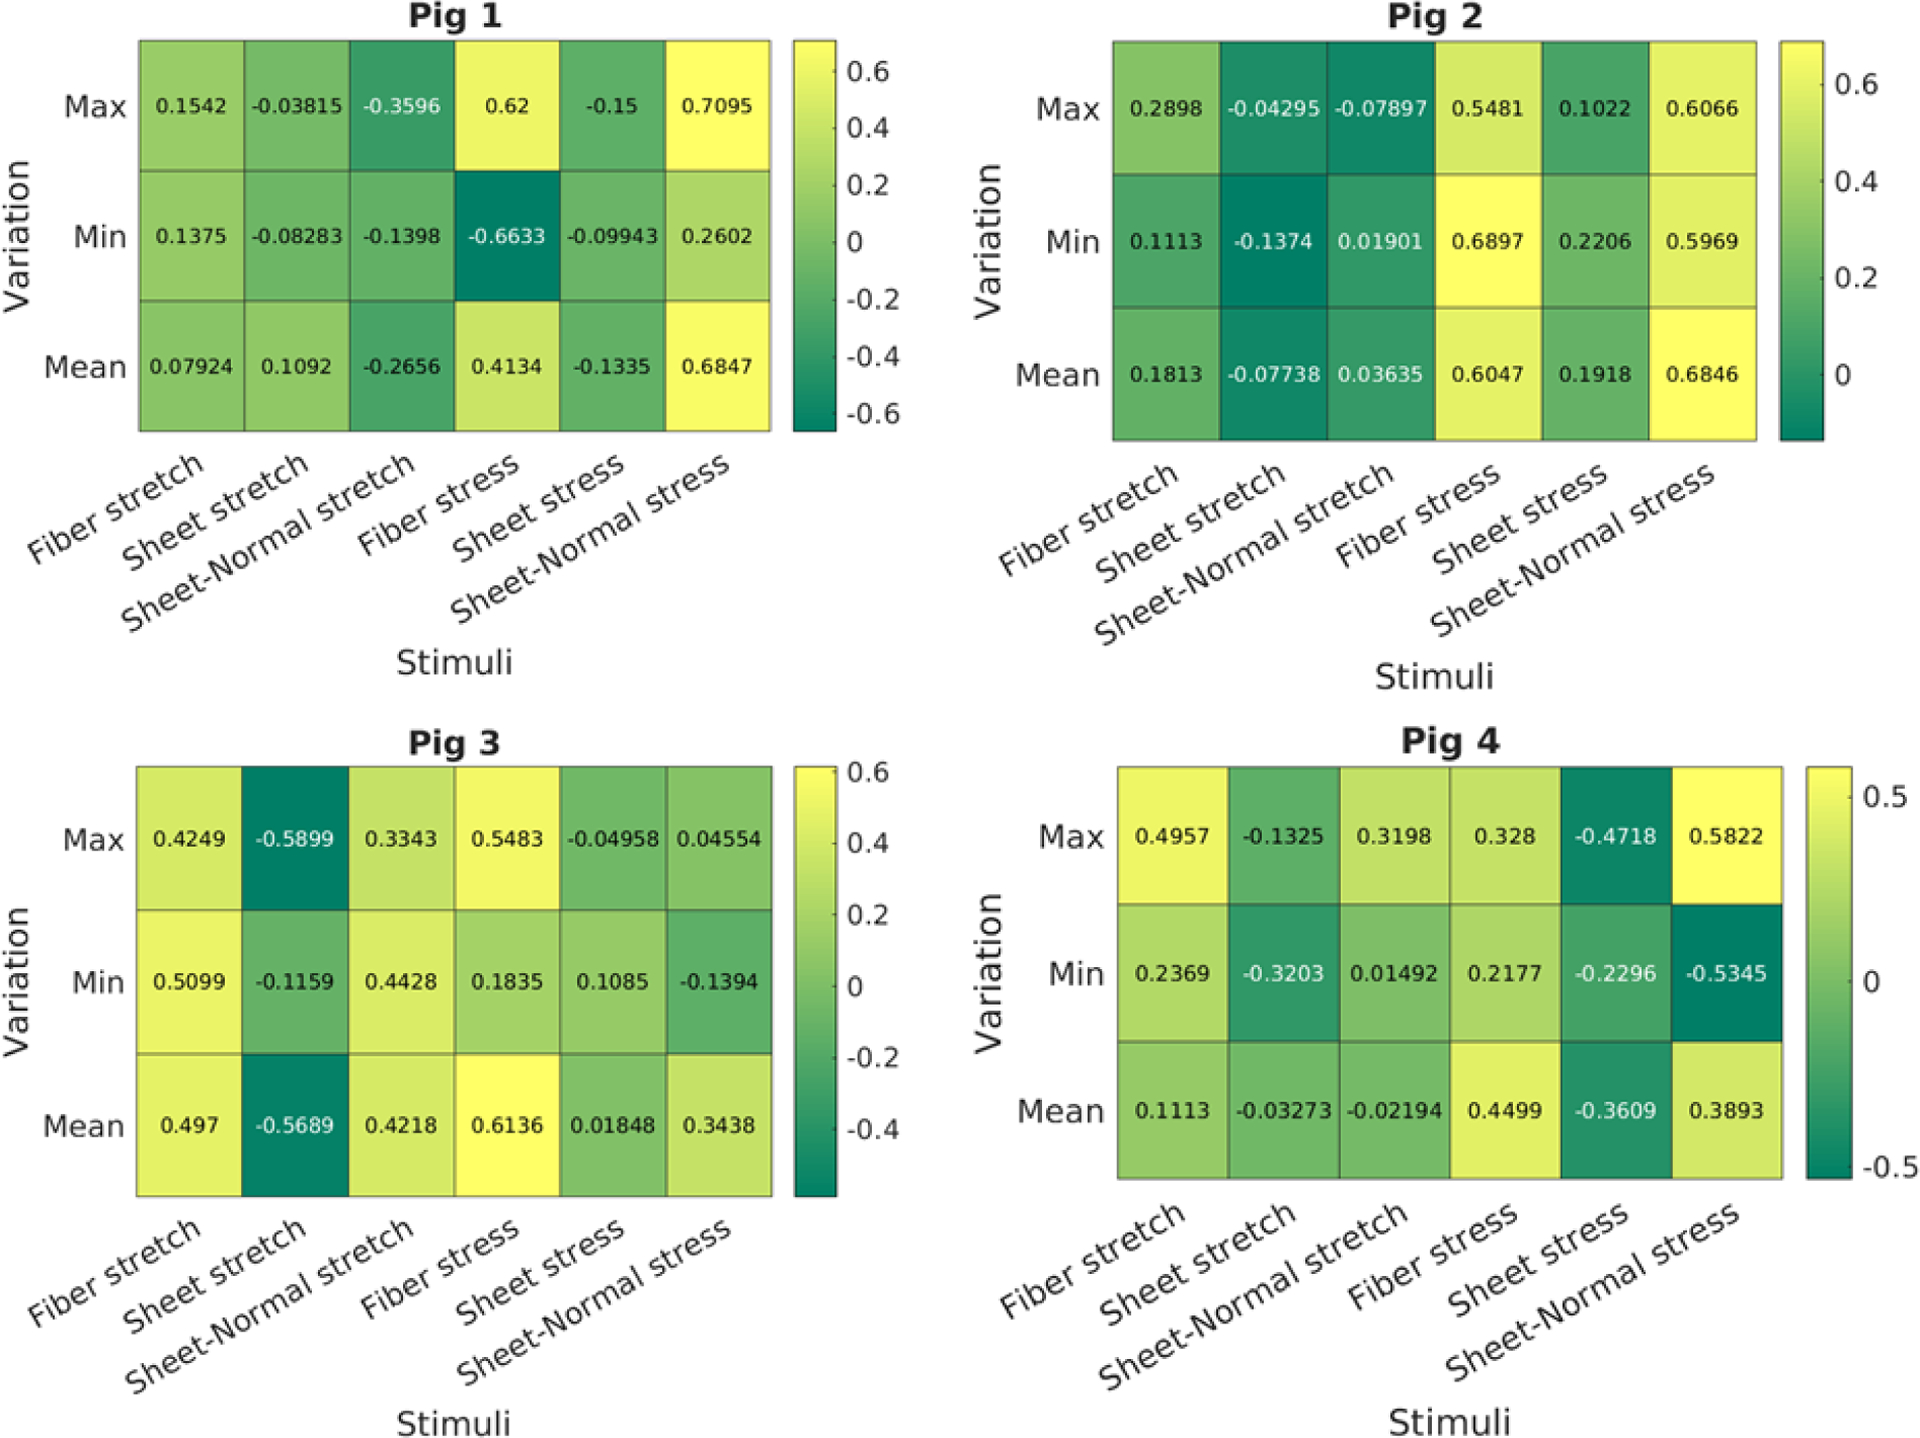
Spearman rank correlation coefficient of the 18 mechanical stimuli with growth for the 4 pig models. Value close to +1 or −1 indicates strong positive and negative correlation, respectively. Value close to 0 indicates no correlation.
APPENDIX D: SENSITIVITY ANALYSIS OF CHANGES IN FIBER ANGLES
Figure 11:
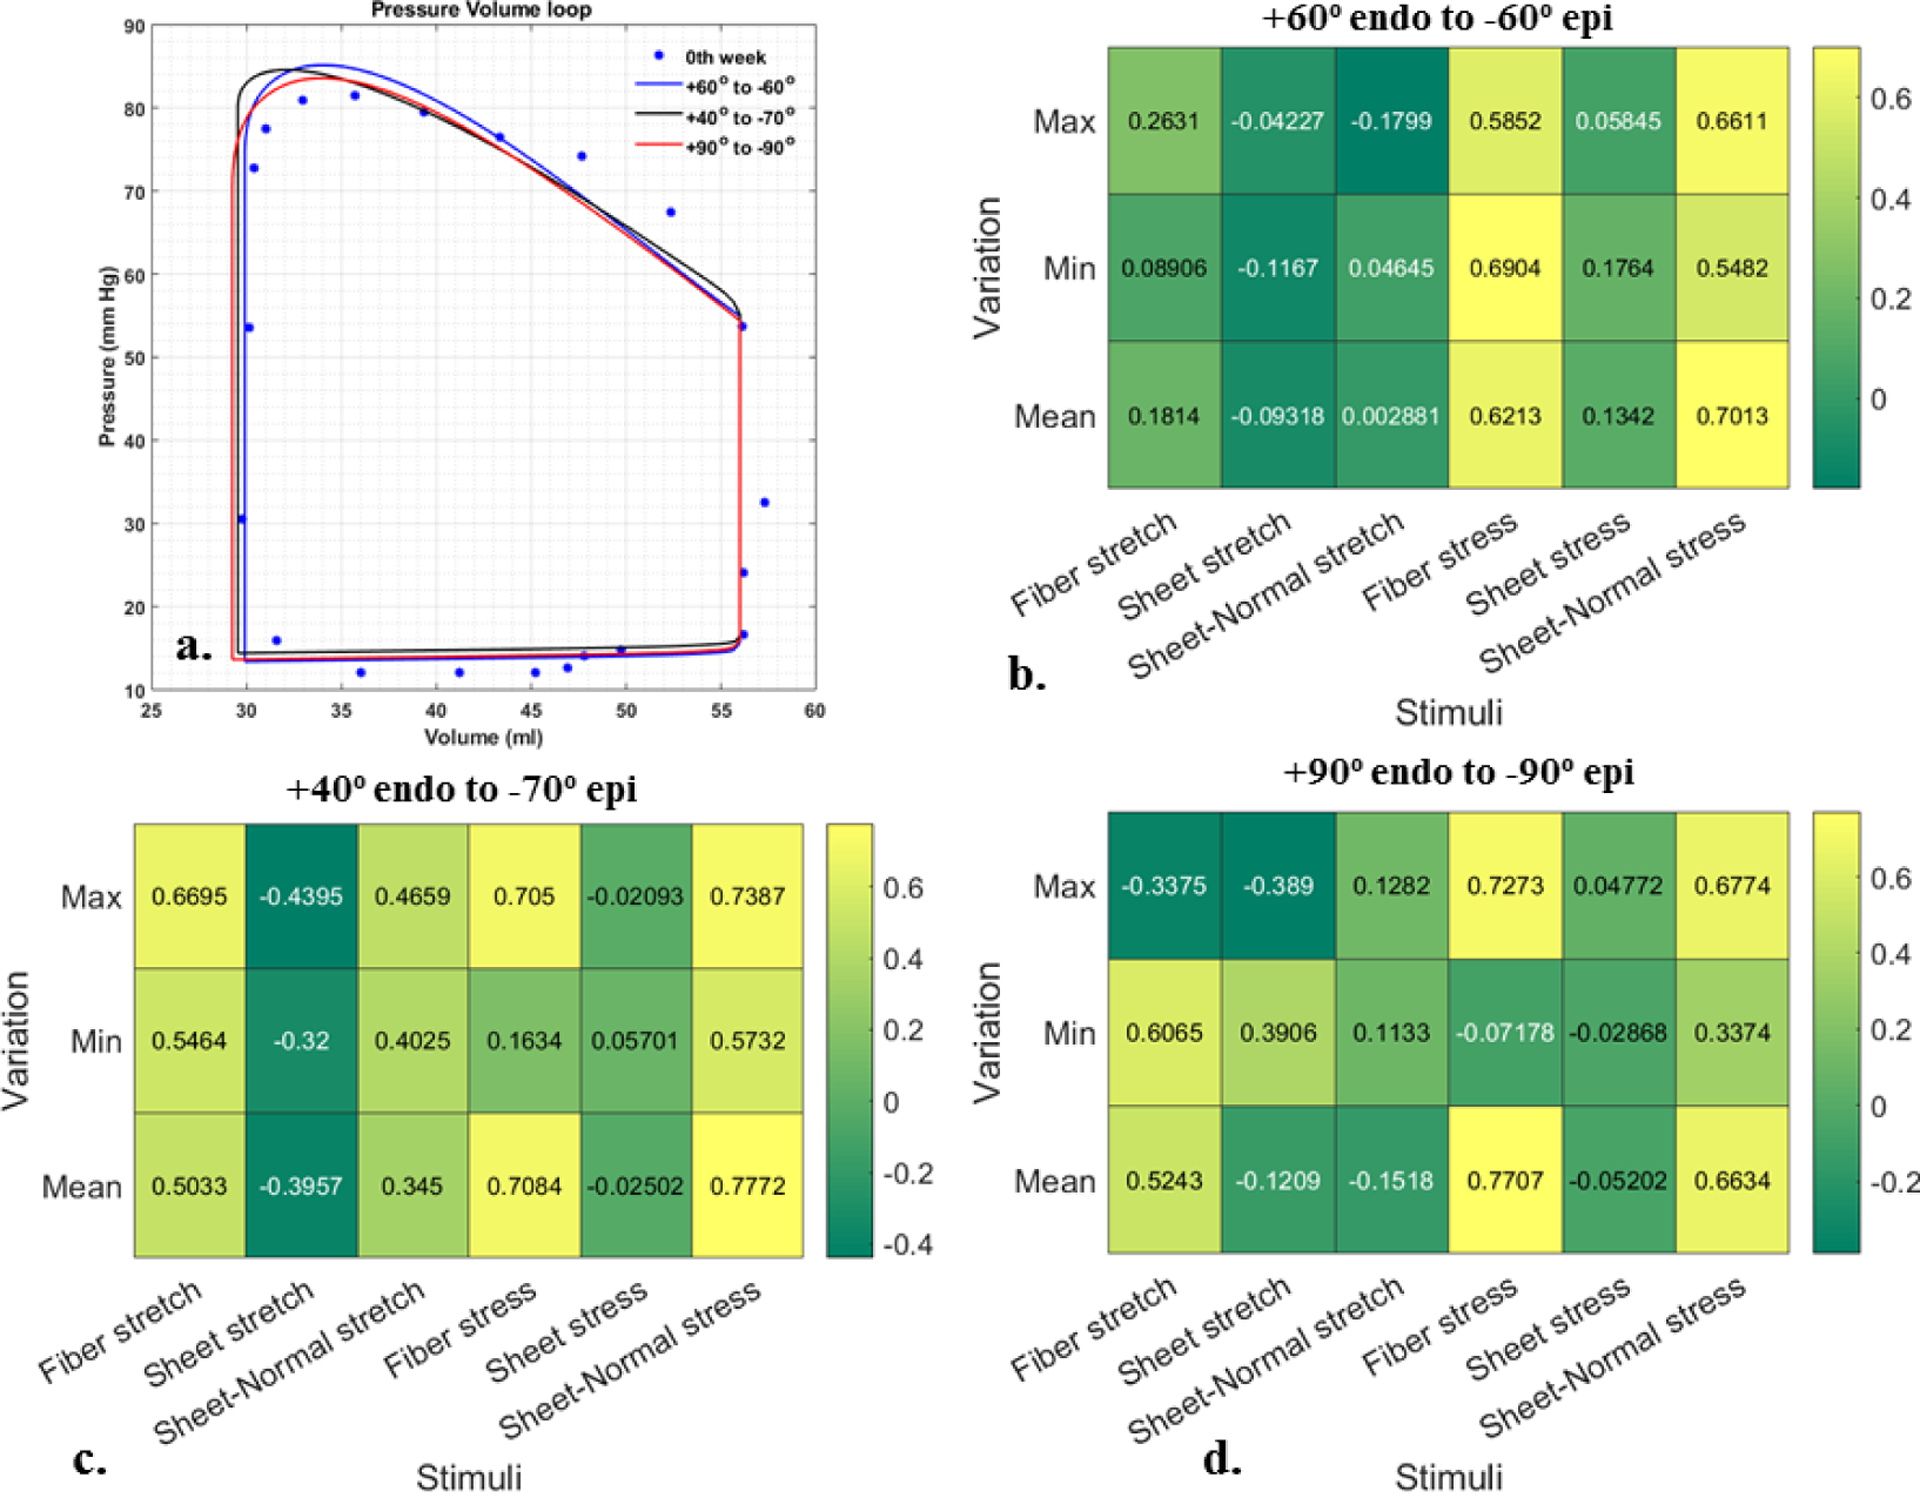
Sensitivity analysis using different fiber angles for Pig 2. a. Pressure-volume loop, b-d. Pearson correlation coefficient are shown among growth and 18 stimuli using different fiber angles along LV wall; Value close to +1 or −1 indicates strong positive and negative correlation, respectively. Value close to 0 indicates no correlation.
Footnotes
Publisher's Disclaimer: This Author Accepted Manuscript is a PDF file of a an unedited peer-reviewed manuscript that has been accepted for publication but has not been copyedited or corrected. The official version of record that is published in the journal is kept up to date and so may therefore differ from this version.
REFERENCES
- 1.Norton JM (2001) Toward consistent definitions for preload and afterload. Am. J. Physiol. - Adv. Physiol. Educ [DOI] [PubMed] [Google Scholar]
- 2.Otto CM (2006) Valvular Aortic Stenosis. Disease Severity and Timing of Intervention. J. Am. Coll. Cardiol [DOI] [PubMed] [Google Scholar]
- 3.Rosenhek R, Binder T, Porenta G, et al. (2000) Predictors of outcome in severe, asymptomatic aortic stenosis. N Engl J Med 10.1056/NEJM200008313430903 [DOI] [PubMed] [Google Scholar]
- 4.McCrossan ZA, Billeter R, White E (2004) Transmural changes in size, contractile and electrical properties of SHR left ventricular myocytes during compensated hypertrophy. Cardiovasc Res 10.1016/j.cardiores.2004.04.013 [DOI] [PubMed] [Google Scholar]
- 5.Sawada Kichi, Kawamura K (1991) Architecture of myocardial cells in human cardiac ventricles with concentric and eccentric hypertrophy as demonstrated by quantitative scanning electron microscopy. Heart Vessels 10.1007/BF02058278 [DOI] [PubMed] [Google Scholar]
- 6.Grossman W, Jones D, McLaurin LP (1975) Wall stress and patterns of hypertrophy in the human left ventricle. J Clin Invest 10.1172/JCI108079 [DOI] [PMC free article] [PubMed] [Google Scholar]
- 7.Pardo Mindán FJ, Panizo A (1993) Alterations in the extracellular matrix of the myocardium in essential hypertension. Eur Heart J [PubMed] [Google Scholar]
- 8.Carruth ED, McCulloch AD, Omens JH (2016) Transmural gradients of myocardial structure and mechanics: Implications for fiber stress and strain in pressure overload. Prog. Biophys. Mol. Biol [DOI] [PMC free article] [PubMed] [Google Scholar]
- 9.Grossman W (1980) Cardiac hypertrophy: Useful adaptation or pathologic process? Am. J. Med [DOI] [PubMed] [Google Scholar]
- 10.Tamura T, Onodera T, Said S, Gerdes AM (1998) Correlation of myocyte lengthening to chamber dilation in the spontaneously hypertensive heart failure (SHHF) rat. J Mol Cell Cardiol 10.1006/jmcc.1998.0775 [DOI] [PubMed] [Google Scholar]
- 11.Jalil JE, Doering CW, Janicki JS, et al. (1988) Structural vs. contractile protein remodeling and myocardial stiffness in hypertrophied rat left ventricle. J Mol Cell Cardiol 10.1016/0022-2828(88)90597-4 [DOI] [PubMed] [Google Scholar]
- 12.Yin FC (1981) Ventricular wall stress. Circ Res 49:829–842. 10.1161/01.RES.49.4.829 [DOI] [PubMed] [Google Scholar]
- 13.Shoucri RM (2000) Active and passive stresses in the myocardium. Am J Physiol - Hear Circ Physiol 10.1152/ajpheart.2000.279.5.h2519 [DOI] [PubMed] [Google Scholar]
- 14.Yang H, Schmidt LP, Wang Z, et al. (2016) Dynamic Myofibrillar Remodeling in Live Cardiomyocytes under Static Stretch. Sci Rep 10.1038/srep20674 [DOI] [PMC free article] [PubMed] [Google Scholar]
- 15.Göktepe S, Abilez OJ, Kuhl E (2010) A generic approach towards finite growth with examples of athlete’s heart, cardiac dilation, and cardiac wall thickening. J Mech Phys Solids 58:1661–1680. 10.1016/j.jmps.2010.07.003 [DOI] [Google Scholar]
- 16.Göktepe S, Abilez OJ, Parker KK, Kuhl E (2010) A multiscale model for eccentric and concentric cardiac growth through sarcomerogenesis. J Theor Biol 265:433–42. 10.1016/j.jtbi.2010.04.023 [DOI] [PubMed] [Google Scholar]
- 17.Rausch MK, Dam a., Göktepe S, et al. (2011) Computational modeling of growth: Systemic and pulmonary hypertension in the heart. Biomech Model Mechanobiol 10:799–811. 10.1007/s10237-010-0275-x [DOI] [PMC free article] [PubMed] [Google Scholar]
- 18.Kerckhoffs RCP, Omens J, McCulloch AD (2012) A single strain-based growth law predicts concentric and eccentric cardiac growth during pressure and volume overload. Mech Res Commun 42:40–50. 10.1016/j.mechrescom.2011.11.004 [DOI] [PMC free article] [PubMed] [Google Scholar]
- 19.Yoshida K, McCulloch AD, Omens JH, Holmes JW (2019) Predictions of hypertrophy and its regression in response to pressure overload. Biomech Model Mechanobiol 10.1007/s10237-019-01271-w [DOI] [PMC free article] [PubMed] [Google Scholar]
- 20.Finsberg H, Xi C, Tan J Le, et al. (2018) Efficient estimation of personalized biventricular mechanical function employing gradient-based optimization. Int j numer method biomed eng 34:. 10.1002/cnm.2982 [DOI] [PMC free article] [PubMed] [Google Scholar]
- 21.Streeter DD, Spotnitz HM, Patel DP, et al. (1969) Fiber orientation in the canine left ventricle during diastole and systole. Circ Res 24:339–347. 10.1161/01.RES.24.3.339 [DOI] [PubMed] [Google Scholar]
- 22.Bayer JD, Blake RC, Plank G, Trayanova NA (2012) A novel rule-based algorithm for assigning myocardial fiber orientation to computational heart models. Ann Biomed Eng 40:2243–2254. 10.1007/s10439-012-0593-5 [DOI] [PMC free article] [PubMed] [Google Scholar]
- 23.Westerhof N, Lankhaar JW, Westerhof BE (2009) The arterial windkessel. Med. Biol. Eng. Comput [DOI] [PubMed] [Google Scholar]
- 24.Guccione JM, McCulloch AD, Waldman LK (1991) Passive material properties of intact ventricular myocardium determined from a cylindrical model. J Biomech Eng 113:42–55 [DOI] [PubMed] [Google Scholar]
- 25.Guccione J, Mcculloch A (1993) Mechanics of Actiwe Contraction in Cardiac Muscle: Part I — Constitutive Relations for Fiber Stress That Describe Deactivation. J Biomech Eng 73–81 [DOI] [PubMed] [Google Scholar]
- 26.Guccione JM, Waldman LK, McCulloch AD (1993) Mechanics of Actiwe Contraction in Cardiac Muscle: Part II — Cylindrical Models of the Systolic Left Ventricle. J Biomech Eng 115:82–90 [DOI] [PubMed] [Google Scholar]
- 27.Arumugam J, Mojumder J, Kassab G, Lee LC (2019) Model of Anisotropic Reverse Cardiac Growth in Mechanical Dyssynchrony. Sci Rep 10.1038/s41598-019-48670-8 [DOI] [PMC free article] [PubMed] [Google Scholar]
- 28.Shavik SM, Jiang Z, Baek S, Lee LC (2018) High spatial resolution multi-organ finite element modeling of ventricular-arterial coupling. Front Physiol 9:. 10.3389/fphys.2018.00119 [DOI] [PMC free article] [PubMed] [Google Scholar]
- 29.Alnæs M, Blechta J, Hake J, et al. (2015) The FEniCS Project Version 1.5. Arch Numer Softw 3:. 10.11588/ANS.2015.100.20553 [DOI] [Google Scholar]
- 30.Cerqueira MD, Weissman NJ, Dilsizian V, et al. (2002) Standardized Myocardial Segmentation and Nomenclature for Tomographic Imaging of the Heart. J Cardiovasc Magn Reson 4:203–210. 10.1081/JCMR-120003946 [DOI] [PubMed] [Google Scholar]
- 31.Gyöngyösi M, Pavo N, Lukovic D, et al. (2017) Porcine model of progressive cardiac hypertrophy and fibrosis with secondary postcapillary pulmonary hypertension. J Transl Med 10.1186/s12967-017-1299-0 [DOI] [PMC free article] [PubMed] [Google Scholar]
- 32.Sorensen M, Hasenkam JM, Jensen H, Sloth E (2011) Subcoronary versus supracoronary aortic stenosis. An experimental evaluation. J Cardiothorac Surg 10.1186/1749-8090-6-100 [DOI] [PMC free article] [PubMed] [Google Scholar]
- 33.Aoyagi T, Mirsky I, Flanagan MF, et al. (1992) Myocardial function in immature and mature sheep with pressure-overload hypertrophy. Am J Physiol 262:H1036–H1048 [DOI] [PubMed] [Google Scholar]
- 34.Aoyagi T, Fujii AM, Flanagan MF, et al. (1993) Transition from compensated hypertrophy to intrinsic myocardial dysfunction during development of left ventricular pressure-overload hypertrophy in conscious sheep: Systolic dysfunction precedes diastolic dysfunction. Circulation 10.1161/01.CIR.88.5.2415 [DOI] [PubMed] [Google Scholar]
- 35.Merino D, Gil A, Gómez J, et al. (2018) Experimental modelling of cardiac pressure overload hypertrophy: Modified technique for precise, reproducible, safe and easy aortic arch banding-debanding in mice. Sci Rep 10.1038/s41598-018-21548-x [DOI] [PMC free article] [PubMed] [Google Scholar]
- 36.Ishikawa K, Aguero J, Oh JG, et al. (2015) Increased stiffness is the major early abnormality in a pig model of severe aortic stenosis and predisposes to congestive heart failure in the absence of systolic dysfunction. J Am Heart Assoc 4:. 10.1161/JAHA.115.001925 [DOI] [PMC free article] [PubMed] [Google Scholar]
- 37.Charles CJ, Lee P, Li RR, et al. (2020) A porcine model of heart failure with preserved ejection fraction: magnetic resonance imaging and metabolic energetics. ESC Hear Fail 10.1002/ehf2.12536 [DOI] [PMC free article] [PubMed] [Google Scholar]
- 38.Lee LC, Kassab GS, Guccione JM (2016) Mathematical modeling of cardiac growth and remodeling. Wiley Interdiscip Rev Syst Biol Med 8:211–226. 10.1002/wsbm.1330 [DOI] [PMC free article] [PubMed] [Google Scholar]
- 39.Ambrosi D, Ateshian G a, Arruda EM, et al. (2011) Perspectives on biological growth and remodeling. J Mech Phys Solids 59:863–883. 10.1016/j.jmps.2010.12.011 [DOI] [PMC free article] [PubMed] [Google Scholar]
- 40.Cowin SC (2004) Tissue Growth and Remodeling. Annu Rev Biomed Eng 10.1146/annurev.bioeng.6.040803.140250 [DOI] [PubMed] [Google Scholar]
- 41.Maksuti E, Westerhof BE, Ugander M, et al. (2019) Cardiac remodeling in aortic and mitral valve disease: a simulation study with clinical validation. J Appl Physiol 126:1377–1389. 10.1152/japplphysiol.00791.2018 [DOI] [PubMed] [Google Scholar]
- 42.Carasso S, Cohen O, Mutlak D, et al. (2009) Differential effects of afterload on left ventricular long- and short-axis function: Insights from a clinical model of patients with aortic valve stenosis undergoing aortic valve replacement. Am Heart J 158:540–545. 10.1016/j.ahj.2009.07.008 [DOI] [PubMed] [Google Scholar]
- 43.Leonardi B, Margossian R, Sanders SP, et al. (2014) Ventricular mechanics in patients with aortic valve disease: Longitudinal, radial, and circumferential components. Cardiol Young 10.1017/S1047951112002326 [DOI] [PubMed] [Google Scholar]
- 44.Ozkan A, Kapadia S, Tuzcu M, Marwick TH (2011) Assessment of left ventricular function in aortic stenosis. Nat Rev Cardiol 8:494–501. 10.1038/nrcardio.2011.80 [DOI] [PubMed] [Google Scholar]
- 45.Crozatier B, Caillet D, Bical O (1984) Left ventricular adaptation to sustained pressure overload in the conscious dog. Circ Res 10.1161/01.RES.54.1.21 [DOI] [PubMed] [Google Scholar]
- 46.McCain ML, Parker KK (2011) Mechanotransduction: the role of mechanical stress, myocyte shape, and cytoskeletal architecture on cardiac function. Pflugers Arch 462:89–104. 10.1007/s00424-011-0951-4 [DOI] [PubMed] [Google Scholar]
- 47.Lyon RC, Zanella F, Omens JH, Sheikh F (2015) Mechanotransduction in cardiac hypertrophy and failure. Circ Res 116:1462–1476. 10.1161/CIRCRESAHA.116.304937 [DOI] [PMC free article] [PubMed] [Google Scholar]
- 48.Ruwhof C, Van Der Laarse A (2000) Mechanical stress-induced cardiac hypertrophy: Mechanisms and signal transduction pathways. Cardiovasc. Res [DOI] [PubMed] [Google Scholar]
- 49.Streeter DD, & Bassett DL (1966). An engineering analysis of myocardial fiber orientation in pig’s left ventricle in systole. The Anatomical Record, 155(4), 503–511. 10.1002/ar.1091550403 [DOI] [Google Scholar]
- 50.Papadacci C, Finel V, Provost J, Villemain O, Bruneval P, Gennisson JL, … Pernot M (2017). Imaging the dynamics of cardiac fiber orientation in vivo using 3D Ultrasound Backscatter Tensor Imaging. Scientific Reports, 7(1). 10.1038/s41598-017-00946-7 [DOI] [PMC free article] [PubMed] [Google Scholar]


