Abstract
Autosomal dominant polycystic kidney disease (ADPKD) is the most common hereditary renal disease, characterized by cyst formation and growth. Hyperproliferation is a major contributor to cyst growth. At the nexus of regulating proliferation, is 4E-BP1. We demonstrate that ADPKD mouse and rat models, ADPKD patient renal biopsies and PKD1−/− cells exhibited hyperphosphorylated 4E-BP1, a biomarker of increased translation and proliferation. We hypothesized that expression of constitutively active 4E-BP1 constructs (4E-BP1F113A and 4E-BP1R13AF113A) would decrease proliferation and reduce cyst expansion. Utilizing the Pkd1RC/RC mouse, we determined the effect of 4E-BP1F113A on PKD. Unexpectedly, 4E-BP1F113A resulted in increased cyst burden and suppressed apoptosis markers, increased anti-apoptotic Bcl-2 protein and increased mitochondrial proteins. Exogenous 4E-BP1 enhanced proliferation, decreased apoptosis, increased anti-apoptotic Bcl-2 protein, impaired NADPH oxidoreductase activity, increased mitochondrial proteins and increased superoxide production in PKD patient-derived renal epithelial cells. Reduced 4E-BP1 expression suppressed proliferation, restored apoptosis and improved cellular metabolism. These findings provide insight into how cyst-lining cells respond to 4E-BP1.
Keywords: 4E-BP1, polycystic kidney disease, proliferation, apoptosis, mitochondrial proteins
Introduction
Autosomal dominant polycystic kidney disease (ADPKD) is characterized by cyst formation and growth which can be driven by abnormal proliferation of tubular epithelial cells (1). Aberrant cellular proliferation is a striking commonality between ADPKD and cancer. Relevant to their shared pathobiology, sustained proliferative signaling (2–4), replicative immortality (2,5,6) and deregulated cellular energetics (2,7,8) are some of the major signaling pathways dysregulated in both PKD and cancer. Further, in PKD and cancer augmented protein synthesis is a hallmark of sustained proliferation independent of genetic insult or precipitating offence (9).
Eukaryotic translation initiation factor 4E-binding protein 1 (4E-BP1) is a crucial checkpoint in protein synthesis. Hypophosphorylated 4E-BP1 strongly associates with eIF4E (10), inhibiting translation and thus inhibiting proliferation (11). For example, overexpression of 4E-BP1 can partially reverse the phenotype of cells transformed with oncogenes Src and Ras (10). Further, constitutively active 4E-BP1 which binds eIF4E avidly can lead to cell cycle arrest, inhibit proliferation of breast cancer cells (12), block lymphocyte growth and proliferation (13) and reduce cell size (14). 4E-BP1 hyperphosphorylation retards this interaction, releasing eIF4E, promoting proliferation. Thus, based on the growing evidence for 4E-BP1 dysregulation in cancer, and the overlapping pathobiology of PKD and oncology, we developed the hypothesis that there is hyperphosphorylation of 4E-BP1 in in vivo and in vitro PKD models, supporting epithelial proliferation and cyst expansion.
Phosphorylation of 4E-BP1 (p4E-BP1) can be carried out by numerous kinases through 4E-BP1’s two kinase recognition domains (KRDs), RAIP (15,16) and FEMDI (14). A wealth of evidence indicates that mTOR, through FEMDI (17), phosphorylates 4E-BP1 thereby serving as a major factor in releasing 4E-BP1 from eIF4E and thus promoting protein translation and proliferation (18–20). Mutation of essential residues within FEMDI (e.g. Phe to Ala, F113A) eliminates phosphorylation of 4E-BP1 by mTOR at Thr37 and Thr46 (21). We hypothesized that preventing mTOR from initiating phosphorylation of 4E-BP1 with FEMDI mutant, F113A, would reduce proliferation in hyperproliferative cystic epithelial cells. This mechanism has precedent, as both constitutively active 4E-BP1 and FEMDI mutation constructs are insensitive to insulin-mediated release of 4E-BP1 from eIF4E (14,16).
Thus, our aims were to characterize p4E-BP1 in vivo and in vitro models of PKD and to assess the effect of expressing 4E-BP1 KRD mutants in a clinically relevant rodent model, the Pkd1RC/RC mouse and the ADPKD patient-derived cystic epithelial cells.
It is known that mTORC1 controls mitochondrial activity and biogenesis through 4E-BP-dependent translational regulation (22). 4E-BPs mediated the stimulatory effect of mTORC1 on the translation of mitochondria-related mRNAs, mitochondrial respiration and biogenesis and ATP production in vitro and in vivo (22). At the molecular level, this was explained by preferential inhibition of translation of a subset of cellular mRNAs that encode for essential nucleus-encoded mitochondrial proteins including the components of complex V and TFAM (transcription factor a, mitochondrial). Also, 4E-BP1 regulates mitochondrial activity and biogenesis in skeletal muscle (23). Thus, a further aim of the study was to determine the effect of 4E-BP1 on mitochondrial activity and biogenesis in PKD models.
Results
Increased phosphoregulation of 4E-BP1 is present in mice, rats and patient-derived PKD models in vivo and in vitro
4E-BP1 has multiple phospho-sites (17), with a hierarchy of phosphorylation (I: Thr37/Thr46, II: Thr70 and III: Ser65) in order to release eIF4E. The initial phospho-event is thought to be at Thr37 and Thr46 and caused by numerous kinases (17). For this reason, we screened rodent models of ADPKD for the presence of the initial phospho-primed p4E-BP1 (Thr37/Thr46). In Pkd1RC/RC mice and Cy/+ rat renal cortical tissues, p4E-BP1 (Thr37/Thr46) was elevated in both non-cystic and cystic tissues in contrast to age-matched wild-type (WT) controls (Fig. 1A and B). To characterize p4E-BP1 in patient tissues, we screened ADPKD patient biopsies for p4E-BP1 species by immunohistochemistry (Fig. 1C). All samples were positive for Thr37/Thr46, Thr70 and Ser65 p4E-BP1. Lastly, p4E-BP1 was present and elevated in the PKD patient-derived renal epithelial immortalized cell line (9–12, PKD1−/−) in contrast to the renal tubular epithelial control immortalized cell line (RCTE, PKD1+/+) (Fig. 1D). Total 4E-BP1 was not different between groups (Fig. 1D). In line with this observation, and consistent with previously published data (24), a variety of kinases known to have the potential to phosphorylate 4E-BP1 were increased in the phosphorylated state in PKD1−/− in contrast to PKD1+/+ cells, including ERK, mTOR and JNK (Supplementary Material, Fig. S1A). PKD1−/− cells also exhibited increased cleaved caspase-3 (Supplementary Material, Fig. S1B), Ki-67 positivity and metabolic correlate NADPH oxidoreductase activity (MTT), in contrast to PKD1+/+ (Supplementary Material, Fig. S1C and D). Thus, p4E-BP1 is present and elevated in PKD rodent and patient renal tissues. Additionally, in vitro PKD1−/− cells exhibit hyperphosphorylated 4E-BP1 in the presence of multiple activated kinases, increased proliferation and increased metabolic activity.
Figure 1.
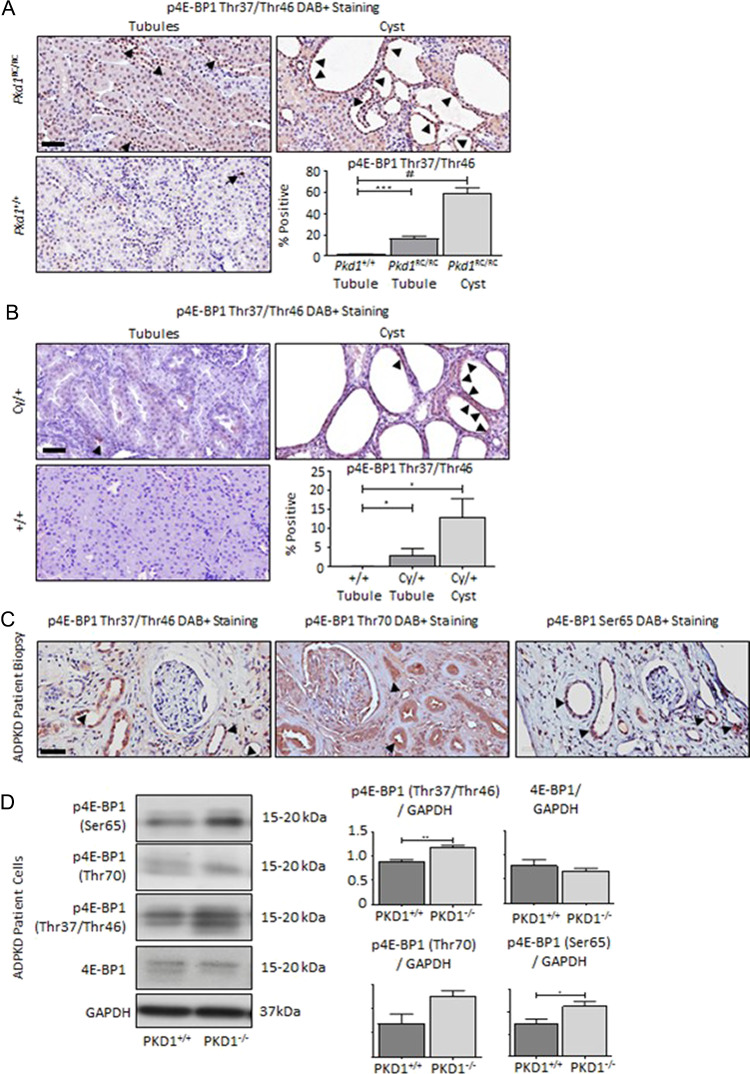
Increased phosphorylated 4E-BP1 in PKD rodent and patient tissues. (A) Pkd1RC/RC mice and (B) Cy/+ rats relative to age-matched strain controls (+/+) demonstrated increased p4E-BP1 (Thr37/46) in non-cystic tubules and stained positively in cells lining cysts. (C) End-stage renal biopsies indicated DAB positivity for p4E-BP1 (Thr37/Thr46, Thr70 and Ser65) by immunohistochemistry. Quantification is expressed as percent of cells staining positive per 100-μm2 area. Black arrows indicate DAB+ staining. Scale bar = 50 μm (D) PKD1−/− cells exhibit increased expression of p4E-BP1 (Thr37/Thr46, Thr70 and Ser65) in contrast to the PKD1+/+ renal epithelial cell line. Total 4E-BP1 was not different between groups. RDU, relative densitometry units. N = 4–5 per group. Multiple-group comparisons are performed using analysis of variance (ANOVA) with posttest according to Newman–Keuls. Single comparisons were made using Student’s T test. A P value of < 0.05 was considered statistically significant. Values are expressed as the mean ± SEM. *P < 0.05, **P < 0.01, ***P < 0.001, #P < 0.0001.
Exogenous 4E-BP1 increases cyst burden
In order to determine the effect of phospho-4E-BP1 in vivo, we generated and delivered FEMDI, Phe to Ala, 4E-BP1F113A-expressing vectors (Fig. 2A) to WT pups in an acute tolerability and bio-distribution experiment (Fig. 2B). All treated animals were aged to study termination without weight loss or obvious pathology. To determine the biodistribution of intraperitoneal administered vectors, AAV genomes were detected in cardiac, hepatic and renal whole tissues (Fig. 2C). Endogenous 4E-BP1 transcripts were quantified and shown to be unaffected by expression vectors (data not shown). Exogenous, AAV-mediated murine codon-optimized 4E-BP1F113A transcripts (Fig. 2D) were detected in cardiac, renal and hepatic tissues of treated animals and not observed in littermates receiving control TdTomato expression vectors (Fig. 2D). Total cumulative 4E-BP1 expression in whole kidneys of treated and control animals confirmed elevated total 4E-BP1 expression with delivery of 4E-BP1F113A, in contrast to littermate controls (Fig. 2E). In summary, acute exposure to 4E-BP1F113A was well tolerated, associated with no morbidity or developmental pathology and resulted in detectable 4E-BP1F113A transcripts and modestly augmented 4E-BP1 protein in the kidneys of treated mice in contrast to control vector-treated littermates.
Figure 2.
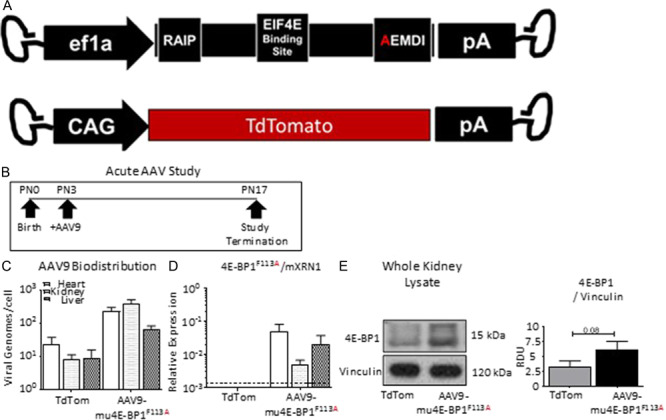
Acute exposure to 4E-BP1 FEMDI mutant in vivo. (A) Diagrams of AAV9-4E-BP1F113A (F113A, N = 12) and AAV9-TdTomato (TdTom, N = 3) AAV vector genomes. (B) Study schematic. (C) Vector biodistribution in whole heart, kidney and liver homogenates. (D) Quantification of 4E-BP1F113A expression in whole heart, kidney and liver homogenates. (E) Quantification and representative immunoblot of total 4E-BP1 protein in whole kidney homogenates corrected for by loading control vinculin. Single comparisons were made using Student’s T test. Values are expressed as the mean ± SEM.
To determine the effect of 4E-BP1 expression on cyst burden, Pkd1RC/RC were treated with AAV9-4E-BP1F113A or AAV9-TdTomato (Fig. 3A) at post-natal (PN) Day 3 and aged to PN120 (Fig. 3B). As in the acute study, vector genomes were detected in cardiac, renal and hepatic tissues (Fig. 3C) at study termination. Further, 4E-BP1F113A transcripts (Fig. 3D) were detected, and 4E-BP1 expression (Fig. 3E) was increased, relative to loading control vinculin in treated mice.
Figure 3.
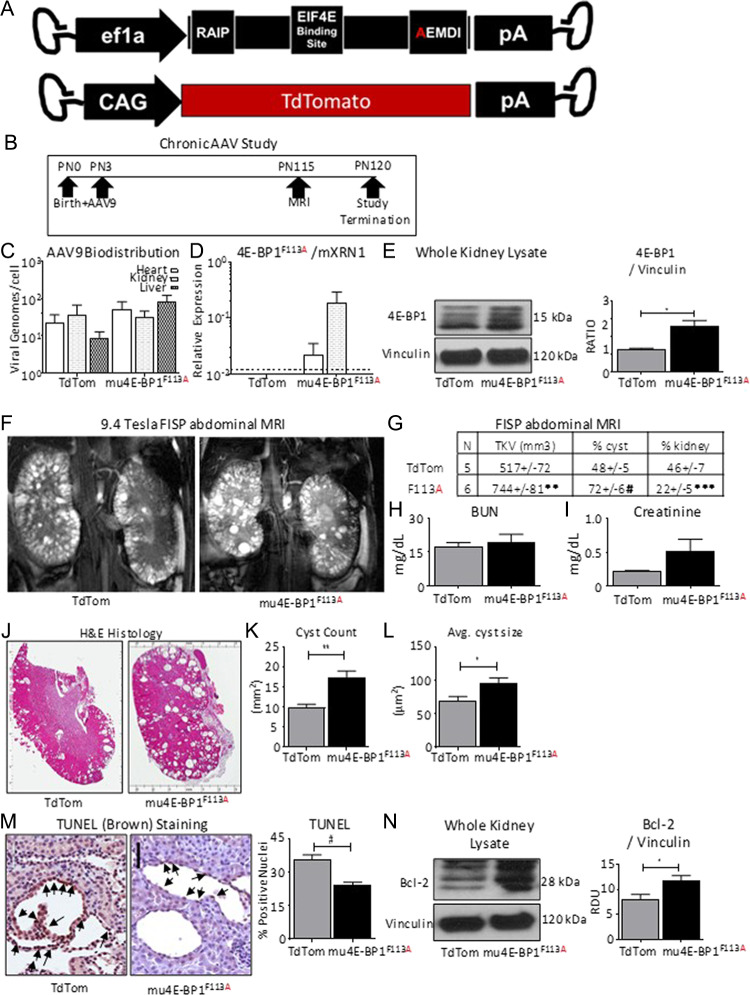
Chronic exposure to 4E-BP1 FEMDI mutant increases cyst burden in vivo. (A) Diagrams of AAV9-4E-BP1F113A (F113A, N = 6) and AAV9-TdTomato (TdTom, N = 5). (B) Study schematic. (C) AAV biodistribution in whole heart, kidney and liver homogenates. (D) Quantification of 4E-BP1F113A expression in whole heart, kidney and liver homogenates. (E) Quantification and representative immunoblot of total 4E-BP1 and loading control vinculin protein levels in whole kidney homogenates. (F) Representative FISP abdominal MRIs of 4E-BP1F113A and TdTom treated Pkd1RC/RC. (G) Quantification of total kidney volume (TKV), % of the kidney determined to be cystic by MRI (% cyst) or functional by MRI (% kidney). (H) Blood urea nitrogen (BUN), and (I) serum creatinine measurements of 4E-BP1F113A (F113A, N = 6) and TdTomato (TdTom, N = 5) treated mice. (J) Representative hematoxylin & eosin (H&E) stained sections and (K) cystic indices quantified, such as Cyst count, and (L) average cyst size. (M) Immunohistochemistry staining of apoptosis marker, TUNEL, quantification specific to cells lining the cysts, and (N) immunoblotting of anti-apoptotic marker, Bcl-2, in whole kidney homogenates of treated and control Pkd1RC/RC kidneys. Quantification of TUNEL is expressed as percent of nuclei staining positive per cyst. Black arrows indicate DAB+ staining. Scale bar = 50 μm. Single comparisons were made using Student’s T test. Values are expressed as the mean ± SEM. *P < 0.05, **P < 0.01, ***P < 0.001, #P < 0.0001.
Unexpectedly, long-term exposure to 4E-BP1F113A resulted in significantly worsened PKD burden in Pkd1RC/RC, as indicated by fast imaging with steady-state procession (FISP) abdominal MRIs (Fig. 3F). Total kidney volume (TKV) and the percentage of cystic renal tissue were significantly increased, indicating exacerbated disease in association with 4E-BP1F113A (Fig. 3G). Inversely, the percentage of remaining functional parenchyma was significantly reduced with 4E-BP1F113A (Fig. 3G). Blood urea nitrogen (Fig. 3H) and serum creatinine (Fig. 3I) were not significantly altered by 4E-BP1F113A. Examination of renal tissues by H&E staining revealed significant increases in both the number of cysts and the average cyst size in the kidneys of 4E-BP1F113A-treated animals (Fig. 3J–L). Immunohistochemistry of renal sections demonstrated reduced TUNEL-positive cyst-lining cells (Fig. 3M) and elevated Bcl-2 expression in the whole kidney homogenates of 4E-BP1F113A-treated animals in contrast to littermate controls (Fig. 3N).
To determine whether the 4E-BP1F113A mutant had effects in other organs, cleaved caspase-3 (CC3), a marker of apoptosis, Bcl-2 and PCNA, a marker of proliferation, were measured in the heart and liver. In the liver, as in the kidney, there was a decrease in CC3 in the 4E-BP1F113A -treated in contrast to control mice, but Bcl-2 that was increased in the kidney was decreased in the liver in the 4E-BP1F113A-treated mice and PCNA was unchanged (Supplementary Material, Fig. S2A). In the heart, there were no changes in Bcl-2 or PCNA and CC3 was undetectable in 4E-BP1F113A-treated in contrast to control mice (Supplementary Material, Fig. S2B).
In summary, short-term exposure to 4E-BP1F113A in WT mouse pups was found to be benign and resulted in vector genomes, vector-mediated 4E-BP1F113A RNA and elevated 4E-BP1 protein within the kidneys of treated animals. Long-term studies in PKD animals achieved the same readouts: broad vector distribution, detectable vector-mediated RNA and elevated 4E-BP1 protein. However, long-term expression of 4E-BP1 FEMDI mutant, 4E-BP1F113A, resulted in the worsening of PKD, a sizeable decline in the remaining functional parenchyma and elevated TKV. Increased disease burden was associated with increased cyst number and size, reduced TUNEL-positive cyst-lining cells and increased expression of the anti-apoptotic protein, Bcl-2, in whole kidneys of 4E-BP1F113A-treated Pkd1RC/RC mice.
4E-BP1 F113A in in vitro ADPKD patient cell lines shifts cellular translation, increases proliferation and decreases apoptosis
Next, we examined the effect of HA-tagged 4E-BP1F113A expression (Supplementary Material, Fig. S3A, HA-4E-BP1) in PKD1+/+, PKD1−/− and two patient cyst-lining cells, Cyst 5 and Cyst 9. 4E-BP1F113A expression resulted in both total and phosphorylated mTOR protein elevation (Fig. 4A) in the presence of 4E-BP1F113A across genotype. However, the ratio of phosphorylated mTOR to total mTOR was not significantly elevated by densitometry (Fig. 4B). Further, a decrease in phosphorylated 4E-BP1 isoforms (Thr70, Thr37/Thr46 and Ser65) relative to total 4E-BP1 abundance was uniquely evident in PKD patient-derived cell lines with 4E-BP1F113A expression (Fig. 4B). In addition, proliferation marker, Ki-67, staining was significantly elevated in PKD patient-derived cell lines with 4E-BP1F113A expression (Fig. 4C). Conversely, apoptosis marker, Apopxin, was significantly suppressed with 4E-BP1F113A expression relative to control transduced PKD1−/−, Cyst 5 and 9 cell lines (Fig. 4D). Apopxin staining in WT PKD1+/+ was uninfluenced by 4E-BP1F113A. Similarly, apoptosis indicated by Apopxin staining in PKD patient-derived cell lines trended to be elevated in contrast to PKD1+/+. Anti-apoptotic protein Bcl-2 and phosphorylation of GSK-3β, a posttranslational modification associated with suppressed apoptosis (25,26), were both substantially augmented with 4E-BP1F113A expression in vitro (Fig. 4E). There was an increase in both phospho and total S6K, confirming that mTOR activity was not increased (Fig. 4F).
Figure 4.
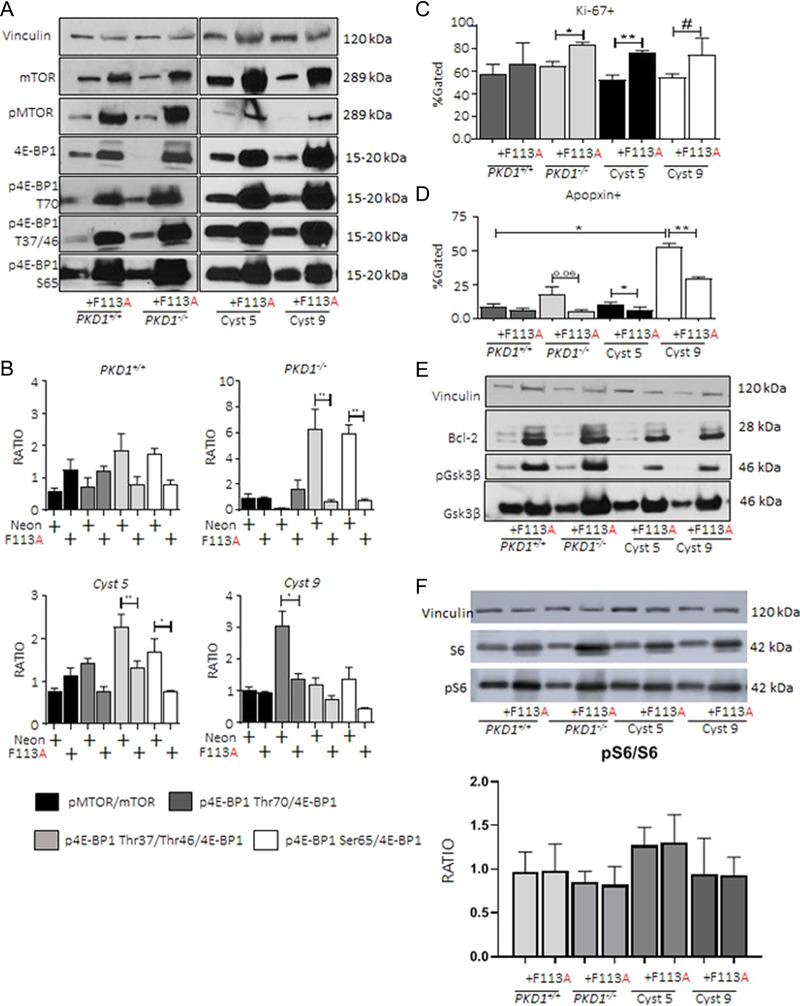
4E-BP1F113Ain vitro promotes proliferation and retards apoptosis. PKD1+/+, PKD1−/− and Human Cyst 5 and 9 were transduced with either control neon-expressing, or HA-tagged 4E-BP1F113A constructs as described. (A) Loading control vinculin, total and phosphorylated mTOR and total and phosphorylated 4E-BP1 (Thr70, Thr37/Thr46 and Ser65) were detected and quantified (B) as the ratio of densitometry units for phosphorylated to total substrate abundance. (C) Proliferation marker (Ki-67), and (D) apoptosis marker (Apopxin) were assayed by flow cytometry. (E) Immunoblotting of anti-apoptotic proteins; Bcl-2, GSK3β (total, and phospho) were augmented in 4E-BP1F113A-transduced cell lines. (F) Increase in both phospho and total S6K. Representative immunoblots reflect a minimum of six independent protein isolations from successive passages. Multiple comparisons were made using two-way ANOVA. Values are expressed as the mean ± SEM. *P < 0.05, **P < 0.01, ***P < 0.001, #P < 0.0001.
These data indicate that 4E-BP1F113A reduced the accumulation of different phosphorylated 4E-BP1 isoforms (relative to total 4E-BP1 expression) in PKD patient-derived cell lines. Further, 4E-BP1F113A expression increased proliferation and substantially suppressed apoptosis signals in a genotype-dependent manner, mediating milder and largely insignificant changes to proliferation, and apoptosis in WT non-PKD cells, PKD1+/+.
4E-BP1F113Ain vitro disrupts NADPH oxidoreductase activity and increases mitochondrial superoxide production
To determine the mechanism through which 4E-BP1F113A supported proliferation, we assessed NADPH oxidoreductase activity by MTT assay, a marker of cellular metabolism (27). 4E-BP1F113A expression significantly suppressed NADPH flux in PKD patient-derived cell lines, PKD1−/− and Cyst 5 (Fig. 5A). As suppressed NADPH oxidoreductase activity can be linked to decreased mitochondrial number or function (28), we quantified mitochondrial genomes. As anticipated, there were significantly decreased mitochondrial genomes present in PKD1−/− cell lines relative to PKD1+/+ cell lines, as previously demonstrated (29). Secondly, 4E-BP1F113A expression significantly increased mitochondrial biogenesis in PKD patient-derived cell lines (Fig. 5B), insignificantly augmenting the WT cell line, PKD1+/+. Subsequently, we measured mitochondrial derived superoxide (O2−) production (MitoSOX), to assess oxidative stress secondary to mitochondrial function (30). MitoSOX measurements on PKD1+/+, PKD1−/− and Cyst 5 cell lines confirmed enhanced O2− production in association with 4E-BP1 F113A expression (Fig. 5C). Lastly, we further interrogated the 4E-BP1F113Ain vivo study, specifically total kidney homogenates by proteomics, to determine if 4E-BP1F113A affected metabolic pathways, as seen in the in vitro experiments (MTT, MitoSOX). A subset of kidneys from the chronic Pkd1RC/RC 4E-BP1F113A-treated animals was submitted for proteomic analysis. The proteomic dataset generated revealed the top dysregulated proteins in whole kidney homogenates of 4E-BP1 F113A-treated Pkd1RC/RC (F113A) to be enriched for mitochondrial proteins, relative to control treated (TdTom) littermates (Supplementary Material, Fig. S4A and B).
Figure 5.
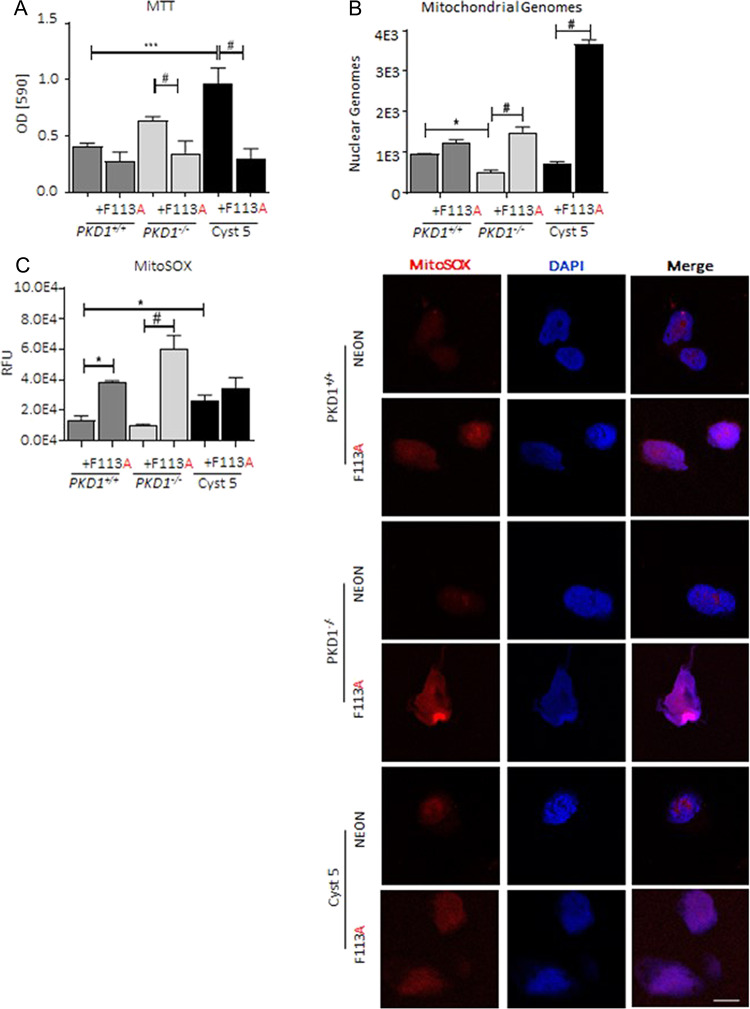
4E-BP1F113A impairs cellular metabolism and increases mitochondrial stress in vitro. (A) MTT in control and FEMDI mutant 4E-BP1F113A transduced cell lines were measured in a minimum of three separate assays with each transduced cell line plated in replicates of 8. (B) Mitochondrial genomes were quantified by qPCR of 4E-BP1F113A and control transduced cell lines. Data graphed is mitochondrial encoded MT-TL1 DNA copy number, relative to nuclear encoded B2μGLBN DNA copy number. (C) Quantification and representative images of mitochondrial O2− (MitoSOX, Red, Nuclear co-stain, DAPI, Blue) in neon control and 4E-BP1F113A-transduced cell lines. Relative fluorescent unit (RFU) of MitoSOX staining. Scale bar (white): 20 μm. Multiple comparisons were made using two-way ANOVA. Values are expressed as the mean ± SEM. *P < 0.05, **P < 0.01, ***P < 0.001, #P < 0.0001.
Immunoblot analysis of PKD1+/+, PKD1−/− and two patient cyst-lining cells, Cyst 5 and Cyst 9, was performed for the top mitochondrial proteins that were increased in 4E-BP1 F113A-treated Pkd1RC/RC mouse kidneys. The mitochondrial proteins that were increased in 4E-BP1 F113A-treated Pkd1RC/RC mouse kidneys (Supplementary Material, Fig. S4) were also increased in ADPKD patient-derived cells (Supplementary Material, Fig. S5).
These data indicate that 4E-BP1F113A expression in PKD cell lines impacts metabolic activity, enhances mitochondrial biogenesis and significantly increases mitochondrial-derived O2− production. Further, 4E-BP1F113A expression in vivo substantially increased PKD disease burden in association with substantially increased mitochondrial protein abundance within whole kidney homogenates, as demonstrated by the proteomics dataset.
mTOR does not drive proliferation or NADPH oxidoreductase activity in patient-derived cystic epithelial cells
The FEMDI motif, also known as TOS (mTOR recognition Sequence), is required for successful 4E-BP1-mTOR binding (16). To rule out mTOR as a mediator of 4E-BP1F113A-promoted proliferation, suppressed apoptosis and reduced NADPH oxidoreductase, cells were exposed to an mTOR inhibitor, sirolimus. Sirolimus reduced phosphorylation of mTOR and total mTOR abundance (Fig. 6A) regardless of cell line genotype. Proliferation in PKD cell lines with 4E-BP1F113A expression was insensitive to sirolimus treatment (Fig. 6B). Importantly, while mTOR activation and signaling was ablated, sirolimus was unable to rescue suppressed NADPH oxidoreductase activity, as assayed by MTT (Fig. 6C), in PKD patient-derived cells with 4E-BP1F113A expression. These data demonstrate that 4E-BP1F113A mediates an increase in proliferation marker, Ki-67, staining and suppresses NADPH oxidoreductase activity (MTT) independent of mTOR kinase activity in PKD1−/− cells.
Figure 6.
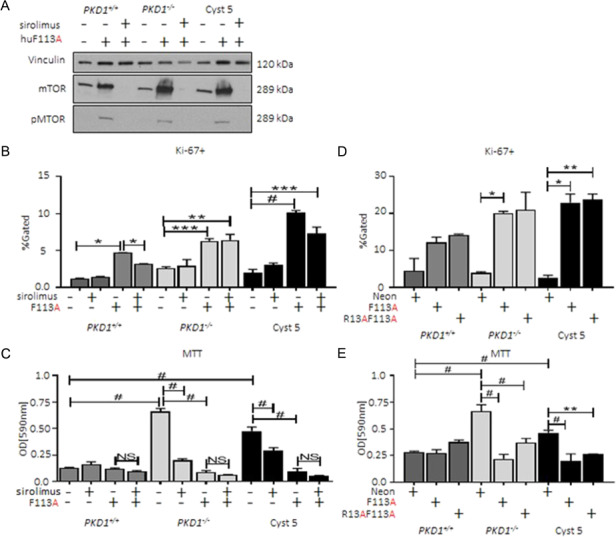
4E-BP1 promoted proliferation and impaired cellular metabolism is kinase-independent in ADPKD patient-derived cystic epithelial cells. (A) 4E-BP1F113A and control transduction cells were exposed to sirolimus and assayed by immunoblot for total and phosphorylated mTOR (Ser2448) and loading control vinculin. Under the same conditions (B) Ki-67+ and (C) MTT were assayed. Expression of pan-kinase blind 4E-BP1 (4E-BP1R13AF113A) mirrored the results of 4E-BP1F113A-transduced cell lines as demonstrated by (D) Ki-67+ and (E) MTT assays. MTT data is a minimum of three separate assays with each transduced cell line plated in replicates of 8. Flow data is a minimum of three independent experiments in duplicate. Multiple-group comparisons were performed using analysis of variance (ANOVA) with posttest according to Newman–Keuls. Values are expressed as the mean ± SEM. *P < 0.05, **P < 0.01, ***P < 0.001, #P < 0.0001.
As 4E-BP1F113A maintains a functional RAIP motif, in order to rule out the involvement of 4E-BP1 regulation by RAIP-specific kinase activity, a pan-kinase-blind 4E-BP1 (4E-BP1R13AF113A) was generated. 4E-BP1R13AF113A expression in PKD1+/+, PKD1−/− and Cyst 5 cell lines (Supplementary Material, Fig. S3B, HA-4E-BP1) resulted in elevated Ki-67 staining of PKD patient-derived cell lines (Fig. 6D) similar to 4E-BP1F113A levels. Further, 4E-BP1R13AF113A suppressed NADPH oxidoreductase activity similar to 4E-BP1F113A, as assessed by MTT, relative to control transduction cell lines (Fig. 6E). Again, exogenous 4E-BP1 construct-mediated changes were genotype-specific; WT PKD1+/+ cells exhibited no significant augmentation to proliferation or metabolic activity in the presence of 4E-BP1R13AF113A expression.
These data indicate that expression of 4E-BP1 constructs, with one or both KRDs mutated in PKD1−/− patient-derived cyst-lining cell lines, increases Ki-67 staining and suppresses NADPH oxidoreductase activity. Therefore, 4E-BP1, independent of kinase regulation, stimulates proliferation and suppresses apoptosis signaling in PKD renal epithelial cell lines.
4E-BP1 suppression reduces proliferation signals, NADPH oxidoreductase activity dysregulation, and mitochondrial superoxide production in patient-derived cystic epithelial cells
We determined the effect of reduced endogenous 4E-BP1 expression in PKD1−/− and PKD1+/+ cells. shRNA targeting 4E-BP1 reduced total protein expression relative to control-transduced cell lines (Supplementary Material Fig. S3C, 4E-BP1shRNA). Proliferation marker, Ki-67, staining was significantly reduced (Fig. 7A), and apoptosis marker, Annexin V (Fig. 7B), was elevated in PKD patient cyst-lining cell-derived lines (PKD1−/− and Cyst 5) transduced with 4E-BP1shRNA relative to 4E-BP1F113A transduction. Further, NADPH oxidoreductase activity, as assessed by MTT, was restored in 4E-BP1shRNA PKD cell lines PKD1−/− and Cyst 5 (Fig. 7C).
Figure 7.
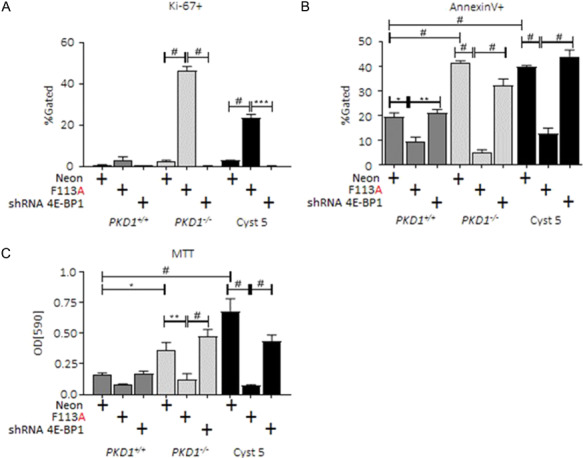
Reduced 4E-BP1 expression restores cellular metabolism, suppresses proliferation and restores apoptosis signaling in ADPKD in vitro models. PKD1+/+, PKD1−/− and Human Cyst 5 were transduced with 4E-BP1 targeting shRNA. (A) Proliferation marker, Ki-67+, (B) apoptosis marker, Annexin V+, and (C) MTT assays were performed as described. Flow and luciferase expression data was generated in a minimum of three experiments. Multiple-group comparisons are performed using ANOVA with posttest according to Newman–Keuls. Values are expressed as the mean ± SEM. *P < 0.05, **P < 0.01, ***P < 0.001, #P < 0.0001. Not significant, NS.
Relative to 4E-BP1F113A-transduced cell lines, 4E-BP1shRNA significantly reduced mitochondrial O2− production (Fig. 8A) from the elevated production present in 4E-BP1F113A-transduced cell lines. Further, 4E-BP1shRNA restored the number of mitochondria present in transduced cells, relative to control transduction cell lines, as quantified by mitochondrial protein ACAA2 in PKD1−/− and PKD1+/+ (Fig. 8B).
Figure 8.
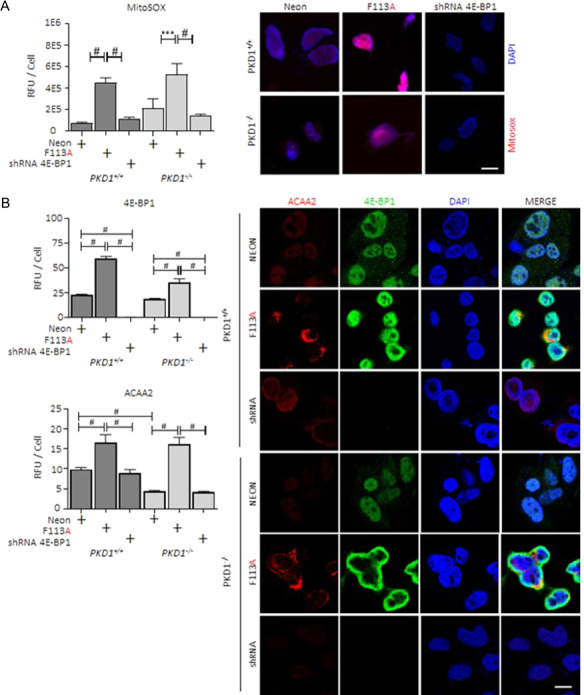
Reduced 4E-BP1 expression reduces mitochondrial superoxide production and mitochondrial biogenesis in ADPKD in vitro models. PKD1+/+, PKD1−/− and Human Cyst 5 were transduced with 4E-BP1 targeting shRNA as described. (A) Mitochondrial O2− production (MitoSOX, Red, Nuclear co-stain DAPI, Blue) and (B) mitochondria quantification (ACAA2, Red; 4E-BP1, Green; Nuclear co-stain DAPI, Blue) were determined in neon, 4E-BP1F113A and 4E-BP1shRNA-transduced cell lines. Relative fluorescent unit (RFU). Scale bar (white): 20 μm. MitoSOX data was generated in a minimum of three experiments. Multiple-group comparisons are performed ANOVA with posttest according to Newman–Keuls. Values are expressed as the mean ± SEM. *P < 0.05, **P < 0.01, ***P < 0.001, #P < 0.0001. Not significant, NS.
These data indicate that PKD cyst-lining cells may have a narrow range of tolerating 4E-BP1 expression, influencing proliferation, apoptosis, mitochondrial function and metabolic processes.
eIF4e suppression reduces NADPH oxidoreductase activity dysregulation and decreases protein synthesis in PKD1−/− cells
We determined the effect of reduced endogenous eIF4e expression in PKD1−/− cells. The siRNA targeting eIF4e reduced eIF4e protein expression (Supplementary Material, Fig. S6). The reduced NADPH oxidoreductase activity, as assessed by MTT, which was seen in 4E-BP1F113A-transduced cell lines was restored in PKD cell lines treated with the eIF4e siRNA (Supplementary Material, Fig. S7).
Protein synthesis was increased in PKD1−/− cells in contrast to PKD+/+ cells (Fig. 9). Both the 4E-BP1F113A and the eIF4e siRNA resulted in a significant decrease in protein synthesis in PKD1−/− cells (Fig. 9).
Figure 9.
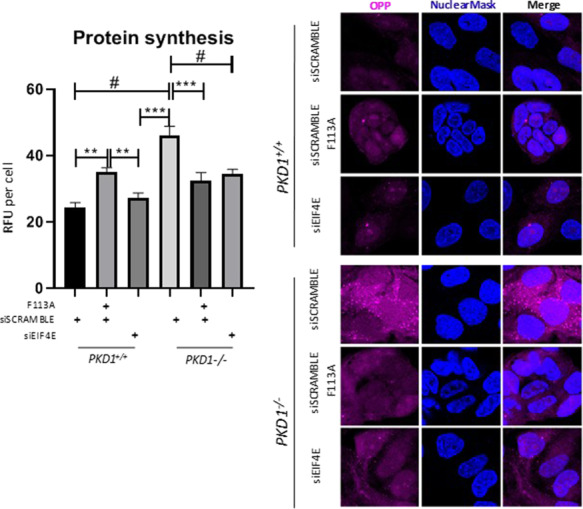
Protein synthesis was increased in PKD1−/− cells in contrast to PKD+/+ cells. Both the 4E-BP1F113A and the eIF4e siRNA resulted in a significant decrease in protein synthesis in PKD1−/− cells. PKD+/+ and PKD1−/− cells were transduced with the 4E-BP1F113A mutant or the eIF4e siRNA. Protein synthesis was measured using O-propargyl-puromycin (OPP)-based protein synthesis assay kit as described in the Methods section. Protein synthesis (OPP, purple; Nuclear co-stain DAPI, Blue) was determined in control (siScramble), 4E-BP1F113A and eIF4e siRNA-transduced cell lines. Relative fluorescent unit (RFU). Multiple-group comparisons are performed ANOVA with posttest according to Newman–Keuls. Values are expressed as the mean ± SEM. **P < 0.01, ***P < 0.001, #P < 0.0001.
Discussion
There is a relationship between polycystin1/2, mTOR and 4E-BP1. The carboxy terminal tail of PC-1 regulates mTOR signaling by altering the subcellular localization of tuberous sclerosis complex 2 (TSC2) tumor suppressor, a gatekeeper of mTOR activity, and deficiency of PC1 has been shown to activate mTOR (31). Thus, PC1 controls the mTOR/S6/4E-BP1 pathway in a TSC-2-dependent manner (32). Overexpression of PC1 in renal epithelial cells downregulates mTOR and decreases phosphorylation of 4E-BP1 (32). In Pkd1−/−, but not pkd2−/− mouse embryonic fibroblasts (MEFs), there is upregulation of mTOR and phosphorylation of 4E-BP1 (32). Thus, a mutation in the Pkd1 gene would be expected to increase phosphorylation of 4E-BP1 as was seen in the in vivo and in vitro Pkd1 knockout models in this study.
The principal function of 4E-BP1 is translational repression, and loss of repression through hyperphosphorylation can push cells into an oncogenic and pro-proliferative phenotype (19). The demonstrated involvement of dysregulated 4E-BP1 in tumorigenesis, and the striking similarities between the pathobiology of cancer and ADPKD, informed the study hypothesis. Briefly, we hypothesized that increasing the pool of hypophosphorylated 4E-BP1 would impair cystic epithelial proliferation and cyst expansion. 4E-BP1 has two KRDs, RAIP and FEMDI. A wealth of evidence indicates that mTOR, through the FEMDI motif (16), is a major factor in phospho-priming 4E-BP1 at Thr37 and Thr46. Phospho-priming and subsequent phosphorylation of 4E-BP1 causes release of 4E-BP1 from eIF4E (17) and thus promotes translation and proliferation. Further, phosphorylation at Thr46 has been shown to be sufficient in preventing eIF4E-4E-BP1 binding (33). Mutation of the essential Phe residue impairs the interaction of 4E-BP1 with mTOR and therefore eliminates the phospho-priming of 4E-BP1 (21). We hypothesized that in PKD, expression of the FEMDI mutant, 4E-BP1F113A, would therefore create an excess pool of 4E-BP1 in the cell, unable to be phospho-primed, and thus staving off decreased eIF4E binding. Further, by increasing the population of hypophosphorylated 4E-BP1, we hypothesized that the FEMDI mutant would suppress proliferation in cystic epithelial cells as has been shown in cancer (14,16).
We found that acute delivery of FEMDI mutant 4E-BP1F113A in WT mouse pups was benign and resulted in detectable 4E-BP1F113A RNA and elevated total 4E-BP1 protein. However, long-term 4E-BP1F113A expression in Pkd1RC/RC resulted in worsened cyst burden. Aggravated disease progression was associated with reduced apoptosis signals (decreased TUNEL staining and increased Bcl-2 expression) and an enrichment in the kidney of dysregulated mitochondrial proteins, as revealed by proteomics (Supplementary Fig. S4A and B).
To determine the mechanism of how 4E-BP1 aggravated PKD in vivo, we performed in vitro studies expressing the FEMDI mutant, 4E-BP1F113A. In vitro, 4E-BP1F113A suppressed apoptosis and increased anti-apoptosis, Bcl-2, signaling.
In addition to supporting suppressed apoptosis signaling, 4E-BP1F113A increased the expression of mTOR. Further, the increase in phospho activation of mTOR with 4E-BP1F113A transduction in vitro did not reach statistical significance. It is known that repressed protein synthesis can rapidly stimulate mTOR activation by a reduction in the cellular abundance of mTOR repressor proteins, such as tuberous sclerosis complex subunit 1 or 2 (Tsc1/2) (34) or Regulated in development and DNA damage response 1 (REDD1) expression (35).
In summary, we found that in vitro 4E-BP1F113A transduction suppressed apoptosis and increased translation of mTOR and Bcl-2. Expression of FEMDI mutant, 4E-BP1F113A increased the total abundance of 4E-BP1 detected in vivo and in vitro as anticipated.
Proteomic analysis of kidneys of Pkd1RC/RC 4E-BP1F113A-treated animals revealed an enrichment of mitochondrial proteins (Supplementary Fig. S4A and B). In vitro 4E-BP1F113A increased mitochondrial biogenesis and mitochondrial superoxide (O2−) production and increased the same mitochondrial proteins as seen on the proteomic analysis of Pkd1RC/RC 4E-BP1F113A-treated animals. One explanation for the increase in mitochondrial biogenesis and O2− production may be based on the mechanics of mitochondrial respiration. Specifically, 4E-BP1F113A may have selectively increased the translation of mRNAs encoding components of complex V (such as Atp5f1, Supplementary Figs S4B and S5), or components of the mitochondrial respiratory chain (such as pyruvate kinase (36) and Sardh (37), Supplementary Figs S4B and S5) or global mitochondrial regulator TFAM (transcription factor A, mitochondrial) which in turn promotes the transcription of mRNAs responsible for (i) mitochondrial DNA replication and transcription (38) and (ii) mitochondrial ribosomal proteins (22). To this point, 4E-BPs have been shown to be major mediators of TFAM mRNA translation (22). The preferential synthesis of mitochondrial structural and functional proteins would therefore support the observations seen both in vitro and in vivo in datasets of increased biogenesis and increased mitochondrial O2− production, as a by-product of increased mitochondrial respiration.
While mTOR activity is well-known to be associated with increased proliferation, it is unlikely that mTOR or kinases endemic to cyst-derived cell lines are responsible for in vitro pro-proliferative phenotype, or in vivo enhanced cyst burden. This is based on the proliferative read-outs of our studies with (i) sirolimus-treated single KRD mutant 4E-BP1F113A and (ii) transduction with double KRD mutant 4E-BP1 R13AF113A. We found that sirolimus successfully reduced the phosphorylation of mTOR affected by 4E-BP1F113A transduction. However, sirolimus was not able to substantially reduce proliferation in PKD cell lines in contrast to 4E-BP1F113A transduction. Further, we performed studies with the pan-kinase blind 4E-BP1 R13AF113A transduced cell lines. As 4E-BP1 R13AF113A has no functional KRD, the resulting phenotype (increased proliferation, decreased metabolic activity) is kinase-independent and stems from excess 4E-BP1.
Importantly, both 4E-BP1 constructs, 4E-BP1F113A and 4E-BP1R13AF113A, exhibited suppressed NADPH oxidoreductase activity in vitro, a correlate for suppressed cellular metabolic activity. Reactive oxygen species (ROS), such as O2−, are produced as a consequence of normal mitochondrial respiration. However, in surplus, ROS and oxidative stress are considered driving forces for cancer development and progression (39,40). To this point, increased ROS has been linked to various metabolic stresses (41). Further, increased ROS production in non-polarized oncogenic epithelial cells enhances proliferation (42,43). We found that 4E-BP1 transduction resulted in an increase in ROS production, an increase in proliferation and a suppression of NADPH oxidoreductase activity, and conversely, these effects were reversed by reduced 4E-BP1 expression. As mitochondria lie at the nexus of the majority of biosynthetic pathways producing ROS and regulating proliferation (44), it is possible that 4E-BP1-enhanced mitochondrial biogenesis and respiration mediate both the suppression of cellular metabolic activity and enhanced cellular proliferation signaling in cells with increased expression of 4E-BP1.
Finally, we determined the effect of reduced 4E-BP1 expression in PKD patient cells. Reduced expression of 4E-BP1 in PKD patient cell lines resulted in an increase in apoptotic signals, suppressed proliferation, improved NADPH oxidoreductase activity and reduction in mitochondria and mitochondrial derived O2− production relative to 4E-BP1F113A transduction. 4E-BP1 is implicated in the regulation of both metabolic and mitochondrial function in both Drosophila and mammals (45). In Drosophila, knockout of 4E-BP1 reduced mitochondrial Complex I activity (46). In mammals, Eif4ebp1−/− mice display an increase in metabolic rate, relative to Eif4ebp1+/+ mice, demonstrating 4E-BP1 as a regulator of metabolism in mammals (47). Additionally, in prostate cancer, genetic deletion of 4E-BP1 significantly decreases proliferation and increases hypoxia-induced cell death, demonstrating the essential role of 4E-BP1 in cancer metabolism (48). Lastly, transgenic mice crossbred for cardiac-specific knockout of mTOR and whole-body knockout of 4E-BP1 (αMHC-MCM/Mtorfl/fl/4E-BP1-KO) exhibited improved cardiac outcomes and survival in a heart failure model (49). RapaLink-1, a third-generation mTOR inhibitor, has demonstrated the most effective inhibition of p4E-BP1 in contrast to previous mTOR inhibitors (50). Thus, in the future, genetic or pharmacological studies with increased targeting of 4E-BP1 in PKD could potentially decrease proliferation, increase apoptosis and slow cyst growth.
PKD is a disease known for being driven by abnormal epithelial proliferation (6) and apoptosis (51). Mitochondrial abnormalities are known to facilitate cyst formation in ADPKD (29). In our in vitro studies, constitutively active 4E-BP1 suppressed apoptosis, increased proliferation, stimulated mitochondrial biogenesis and augmented superoxide production uniquely in a PKD genotype, largely leaving non-PKD cell lines uninfluenced. In vivo, constitutively active 4E-BP1 resulted in mitochondrial dysregulation and worsened PKD disease. Both in vitro and in vivo, the 4E-BP1F113A mutant resulted in increased anti-apoptotic Bcl-2 and an increase in mitochondrial proteins. These findings provide important insights into the role of 4E-BP1, Bcl-2 and mitochondrial proteins in PKD (Fig. 10).
Figure 10.
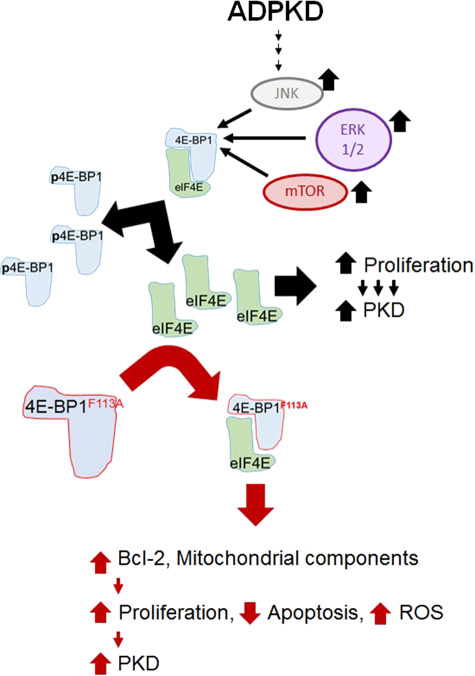
Summary slide. In PKD mouse, rat and human in vitro and in vivo models, regardless of precipitating genetic mutation, there is an increase in phosphorylated 4E-BP1. Excess phosphorylated 4E-BP1 increases the cellular bioavailability of eIF4E supporting hyperproliferation, and ultimately PKD progression. Expression of constitutively active FEMDI mutant 4E-BP1 decreased phosphorylated 4E-BP1 in vivo and in vitro. In vitro, exogenous 4E-BP1 expression resulted in hyperproliferative human ADPKD cyst-lining epithelial cell lines, increased anti-apoptotic Bcl-2 protein, suppressed apoptotic signals, increased O2− production and increased mitochondrial proteins. In vivo, there was worsening of PKD.
In summary, we have provided the first evidence that 4E-BP1, independent of kinase regulation, in PKD patient-derived cells promotes mitochondrial biogenesis and O2− production, which leads to the pro-survival phenotype observed (increased proliferation, suppressed apoptosis). These effects were largely insignificant in WT, non-PKD-derived renal epithelial cells. Our study provides the molecular framework behind the premise supporting future studies aimed at developing interventional approaches exploiting 4E-BP1 expression in PKD.
Materials and Methods
In vitro
Human primary immortalized cells and previously characterized cell lines, normal renal cortical tubular epithelium (RCTE, PKD1+/+) and ADPKD cyst-lining epithelium (9–12, PKD1−/−) immortalized with ori-adeno-SV40 viruses were cultured as previously described (52). Primary isolates from patients, known as Cyst 5 and 9, were a generous gift from Dr Woodward, Baltimore PKD Center. Cyst 5 and 9 isolates were received, recovered and immortalized with lentivectors expressing the large and small T antigens (SV40). Lentivectors were produced by standard triple transfection (Mirus) in 293Ts (generous gift from Dr James Morrison, UC Denver) and 0.45 μm filtered as previously described (53). Cell lines were transduced in six-well plates, with the following vectors: LV-EGFP:T2A:Puro-EF1A-3xHA CO-HU-4E-BP1R13AF113A, LV-mCherry:T2A:Puro-EF1A-3xHA CO-HU-4E-BP1F113A, LV-Puro-CBh-mNeonGreen, pLKO.1 eIF4EBP1 MISSION shRNA TRCN40203, Clone ID: NM_004095.2–489s1c1 (Sigma). Fluorescent protein, mCherry, eGFP or Neon expression was confirmed, and cells were expanded under 0.5–1.0 μg/mL puromycin selection. eIF4e si RNA studies: cell lines were transfected in six-well plates with a eIF4e siRNA from Santa Cruz Biotechnology (sc-35284) or a control siRNA that contains a scrambled sequence that does not lead to the specific degradation of any known cellular mRNA.(sc-37007) as described by the manufacturer. Absence of eIF4e protein was confirmed on immunofluorescence staining (Supplementary Material, Fig. S6). MTT to assay metabolic activity was performed as per manufacturer’s instruction; briefly, 5000 cells were plated per well of a 96-well plate and then assayed for 3-[4,5-dimethyl-thiazol-2-yl]-2,5-diphenyl-tetrazolium bromide reduction. Optical density (OD) measurements were taken at 590 nm and the data graphed. Flow cytometry analysis of samples (Ki-67+, Annexin V+, Apopxin+) assays were carried out as per flow core and product protocols. Briefly, in vitro samples were harvested, washed with PBS, exposed to a binding buffer (0.1 M Hepes (pH 7.4), 1.4 M NaCl and 25 mm CaCl2 solution), stained for membrane extracellular proteins (Annexin V+, Apopxin+), washed (400×g 5 min), fixed (2% PFA, 2% FBS), permeabilized (0.01% Triton-X), probed for intracellular proteins (Ki-67+), washed and resuspended in FACS buffer (2% FBS, 0.1% NaN3, 1× PBS) until samples were run by The Rocky Mountain Regional VA Medical Center Flow Core. Mitochondrial and nuclear DNA quantitation: DNA was isolated (Qiagen), quantified by NanoDrop and assayed with RT2 SYBR Green RT-PCR, as per manufacturer’s guidelines, using primers against (Human) mitochondrial encoded MT-TL1 FWD CAC CCA AGA ACA GGG TTT GT, REV: TGG CCA TGG GTA TGT TGT TA and (Human) Nuclear encoded B2μGLBN (54), FWD: TGC TGT CTC CAT GTT TGA TGT ATC T, REV: TCT CTG CTC CCC ACC TCT AAG T. Immunofluorescence protocol: Cells were plated in a four-well staining chamber at 100000 cells per well and allowed to adhere overnight. The following day, the cells were fixed in 4% paraformaldehyde, washed three times in PBS for 5 min each and incubated in blocking/permeabilization solution (0.1 M glycine, 5% bovine serum albumin, 0.1% Triton X-100 in PBS) for 1 h at room temperature. Next, the cells were incubated in primary antibodies ACAA2 (1:100, Abcam #ab128911) and 4E-BP1 (1:50, Thermo Fisher #AHO1382) overnight at 4°C. The next morning, the primary antibody was decanted, and the cells were washed three times in PBS for 5 min each. The cells were incubated in secondary antibodies Alexa Fluor555-conjugated anti-rabbit (11 000, Thermo Fisher #A-21428) and Alexa Fluor488-conjugated anti-mouse (11 000, Thermo Fisher #R37120) for 1 h at room temperature in the dark. The cells were washed 3 times in PBS for 5 min each. The slides were then cover-slipped with DAPI mounting media. Cells were imaged using a Zeiss 780 confocal scanning microscope. MitoSOX: cells were grown in four-well chamber slides to reach 90% confluency. The cells were washed with Hank’s balanced salt solution (HBSS) once before adding 5 μm MitoSOX reagent. The cells were then incubated at 37°C for 10 min and then washed three times with warm HBSS. The cells were cover-slipped with DAPI mounting media and immediately analyzed for fluorescence. A Zeiss 780 confocal microscope was used to take at least three images of each cell type. One to five cells were quantified for red fluorescence per image using ImageJ. Protein synthesis was measured using the Click-iT® Plus O-propargyl-puromycin (OPP) protein synthesis assay kit as described by the manufacturer (Molecular Probes by Life Technologies Corporation, Catalog no. C10458).
In vivo
Renal tissues for histology were obtained from our colony: briefly, 90-day male Han:SPRD+/+ and Cy/+ rats, 120-day male and female Pkd1+/+ and Pkd1RC/RC (for IHC quantification, n > 10 per genotype). Blinded (unknown age, sex, comorbidities) ADPKD ESRD patient (n > 10) paraffin-embedded tissues were obtained from the University of Denver, AMC PKD program (Dr Gitomer/Hopp). All mouse studies were carried out in the C57BL/6 strain. Pkd1RC/RC mice have a hypomorphic Pkd1 gene mutation orthologous to PKD patient disease variant, PKD1 p. R3277C (Pkd1RC/RC) (55,56). Acute study: AAV vectors (AAV2-EF1A-CO-MU-4E-BP1F113A-pA and AAV2-CAG-TdTomato-pA) were produced by standard triple transfection (Mirus) in 293Ts and purified and titered as previously described (53,57,58). 1E9 AAV vectors were administered by intraperitoneal (IP) injection into three litters (15 total pups) of C57BL/6 pups at PN3. Animals were euthanized at PN17. Chronic study: 11 animals from four litters of Pkd1RC/RC pups were administered AAV vectors by IP on PN3, weaned at PN21 and aged to 120 days. Animals received FISP MRI measurements by UC Denver Small animal imaging core and euthanized, and tissues harvested. At study termination, blood urea nitrogen (BUN) was measured with a BioAssay Systems Urea Assay Kit (Hayward, CA, USA) according to manufacturer’s instructions (DIUR-100). Serum creatinine was measured with HPLC tandem mass spectrometry (Applied Biosystems 3200 Qtrap). [2H3] and creatinine were detected in multiple reaction-monitoring mode, examining transitions of m/z from 114 to 44.2 and from 117 to 47.2, respectively. DNA and RNA isolation of in vivo samples, specifically cardiac, renal and hepatic tissues, was carried out as per manufacturers’ protocols (Qiagen). qPCR assays were followed SYBR-based quantitative PCR protocol as detailed by Sigma-Aldrich. Briefly, 1 μg of RNA was synthesized into cDNA using cDNA synthesis kit (Quantabio), 2 μL of cDNA, 5 μM of forward and reverse primer and 7.5 μL 2× SYBR qPCR master mix were assayed per well of a 96-well plate. Samples were assayed in triplicate and assayed from each study animal. Cycling parameters included 10 min at 95°C, followed by 40 cycles of 94°C for 15 s, and 55°C for 30 s, with a terminal 4°C hold. Proteomics: kidneys were harvested at study termination by necropsy, snap-frozen, milled and lyophilized. Approximately 5 mg of each sample was subjected to sequential protein extraction resulting in a cellular and soluble ECM fraction as previously described (https://www.ncbi.nlm.nih.gov/pubmed/27693690). All fractions were reduced, alkylated and enzymatically digested with trypsin utilizing a filter-aided sample preparation protocol (https://www.ncbi.nlm.nih.gov/pubmed/28971683). Liquid chromatography tandem mass spectrometry (LC-MS/MS) was performed on a Thermo nanoEasy LC II coupled to a Q Exactive HF. MS acquisition parameters are detailed previously (https://www.ncbi.nlm.nih.gov/pubmed/30312994). Raw files were searched with Proteome Discoverer 2.2 against the Mus musculus uniprotKB database in Mascot. Precursor mass tolerance was set to +/− 10 ppm and MS/MS fragment ion tolerance of +/− 25 ppm. Trypsin specificity was selected allowing for one missed cleavage. Variable modifications include Met oxidation, proline hydroxylation, protein N-terminal acetylation, peptide N-terminal pyroglutamic acid formation and a fixed modification of Cys carbamidomethylation. Search results were visualized using MetaboAnalyst v4.0 (https://www.ncbi.nlm.nih.gov/pubmed/29955821). Immunoblot analysis: protein was isolated from cells and tissues using RIPA and a protease/phosphatase inhibitor cocktail. Homogenates were centrifuged, and supernatant was taken for protein analysis. Protein was quantified with Bio-Rad (Hercules, CA, USA) DC Protein Assay kit as described by the manufacturer. Samples were mixed with Laemmli Sample Buffer and boiled for 5 min. Samples were run on 4–20% precast polyacrylamide gels. Proteins were then transferred to PVDF membranes, blocked with 2.5% milk and probed with antibodies listed in Supplementary Material, Table S1. Blots were developed by chemiluminescence and analyzed for densitometry using ImageJ. Immunohistochemistry protocol: tissue sections were deparaffinized and rehydrated, then antigen unmasking was performed in sodium citrate buffer (pH 6.0) for 25 min at 100°C. After rinsing sections for 10 min in cold tap water, endogenous peroxidase activity was blocked by immersing the sections in 3% hydrogen peroxide for 10 min, followed by a 5-min rinse in deionized water. Blocking was performed using Vectastain® Elite® ABC Kit blocking serum for 30 min at room temperature. The primary antibodies were diluted in Tris-buffered saline with Tween 20 (TBST) as indicated in Supplementary Material, Table S1, and the sections were incubated overnight at 4°C in a humidified chamber. Immunoreactions were detected using the Vectastain standard protocol with 3,3′-diaminobenzidine tetrahydrochloride hydrate (DAB) counterstained with hematoxylin. Slides were subsequently dipped one to three times in 0.3% acid alcohol to lighten hematoxylin staining, then dehydrated and mounted. TUNEL staining was performed on tissue sections using a Promega DeadEnd™ Colorimetric Apoptosis Detection System Kit following the manufacturer’s instructions. Quantitation of PCNA and TUNEL staining: the number of positive staining cells were counted using the Aperio ImageScope, Leica Biosystems, by an observer blinded to the treatment modality. Non-cystic tubules were defined as tubules less than 50 μm diameter. Fifteen to 20 fields of view (40× magnification) devoid of cysts in the cortex per sample were randomly selected for non-cystic quantitation. To avoid sensitivity and selection artifacts between non-cystic tubules and dilated possibly pre-cystic tubules, as well as potential changes in tubular epithelium lining massive cysts, positive nuclei were counted in cysts of approximately 100–200 μm diameter. Fifty to 75 cysts in the cortex per tissue section were randomly selected for analysis.
Statistics
Multiple-group comparisons were performed using analysis of variance (ANOVA) with posttest according to Newman–Keuls. Single comparisons were made using Student’s T test. A P value of < 0.05 was considered statistically significant. Values are expressed as the mean ± SEM.
Study approval
All experiments were conducted with adherence to the National Institutes of Health Guide for the Care and Use of Laboratory Animals. The animal protocol was approved by the Animal Care and Use Committee of the University of Colorado at Denver. Mice were maintained on a standard diet, and water was freely available. As published, no difference was seen between male and female Pkd1RC/RC in disease presentation; therefore, all study animals were included in statistical analyses.
Funding
PKD Foundation Fellowship (2018 & 2019, SJH); Department of Defense (W81XWH-16-1-0172 to C.L.E.); Department of Veteran’s Affairs Merit (BX003803-01A1 to C.L.E.)
Supplementary Material
Acknowledgements
We thank The Baltimore PKD Center (NIDDK, P30DK090868) for ADPKD patient cells, The Proteomics Core at UC Denver, The RMRVAMC Flow Core and The Small Animal Imaging Core at UC Denver.
Conflict of Interest statement. None declared.
References
- 1. Wilson, P.D. (2004) Polycystic kidney disease: new understanding in the pathogenesis. Int J Biochem Cell Biol, 36(10), 1868–1873. [DOI] [PubMed] [Google Scholar]
- 2. Hanahan, D. and Weinberg, R.A. (2011) Hallmarks of cancer: the next generation. Cell, 144(5), 646–674. [DOI] [PubMed] [Google Scholar]
- 3. Wallace, D.P., White, C., Savinkova, L., Nivens, E., Reif, G.A., Pinto, C.S., Raman, A., Parnell, S.C., Conway, S.J. and Fields, T.A. (2014) Periostin promotes renal cyst growth and interstitial fibrosis in polycystic kidney disease. Kidney Int, 85(4), 845–854. [DOI] [PMC free article] [PubMed] [Google Scholar]
- 4. Parker, E., Newby, L.J., Sharpe, C.C., Rossetti, S., Streets, A.J., Harris, P.C., O'Hare, M.J. and Ong, A.C. (2007) Hyperproliferation of PKD1 cystic cells is induced by insulin-like growth factor-1 activation of the Ras/Raf signalling system. Kidney Int, 72(2), 157–165. [DOI] [PMC free article] [PubMed] [Google Scholar]
- 5. Goilav, B. (2011) Apoptosis in polycystic kidney disease. Biochim Biophys Acta, 1812(10), 1272–1280. [DOI] [PubMed] [Google Scholar]
- 6. Nishio, S., Hatano, M., Nagata, M., Horie, S., Koike, T., Tokuhisa, T. and Mochizuki, T. (2005) Pkd1 regulates immortalized proliferation of renal tubular epithelial cells through p53 induction and JNK activation. J Clin Invest, 115(4), 910–918. [DOI] [PMC free article] [PubMed] [Google Scholar]
- 7. Rowe, I., Chiaravalli, M., Mannella, V., Ulisse, V., Quilici, G., Pema, M., Song, X.W., Xu, H., Mari, S., Qian, F.et al. (2013) Defective glucose metabolism in polycystic kidney disease identifies a new therapeutic strategy. Nat Med, 19(4), 488–493. [DOI] [PMC free article] [PubMed] [Google Scholar]
- 8. Mao, Z., Xie, G. and Ong, A.C. (2015) Metabolic abnormalities in autosomal dominant polycystic kidney disease. Nephrol Dial Transplant, 30(2), 197–203. [DOI] [PubMed] [Google Scholar]
- 9. Shibazaki, S., Yu, Z., Nishio, S., Tian, X., Thomson, R.B., Mitobe, M., Louvi, A., Velazquez, H., Ishibe, S., Cantley, L.G.et al. (2008) Cyst formation and activation of the extracellular regulated kinase pathway after kidney specific inactivation of Pkd1. Hum Mol Genet, 17(11), 1505–1516. [DOI] [PMC free article] [PubMed] [Google Scholar]
- 10. Rousseau, D., Gingras, A.C., Pause, A. and Sonenberg, N. (1996) The eIF4E-binding proteins 1 and 2 are negative regulators of cell growth. Oncogene, 13(11), 2415–2420. [PubMed] [Google Scholar]
- 11. Dowling, R.J., Topisirovic, I., Alain, T., Bidinosti, M., Fonseca, B.D., Petroulakis, E., Wang, X., Larsson, O., Selvaraj, A., Liu, Y.et al. (2010) mTORC1-mediated cell proliferation, but not cell growth, controlled by the 4E-BPs. Science, 328(5982), 1172–1176. [DOI] [PMC free article] [PubMed] [Google Scholar]
- 12. Jiang, H., Coleman, J., Miskimins, R. and Miskimins, W.K. (2003) Expression of constitutively active 4EBP-1 enhances p27Kip1 expression and inhibits proliferation of MCF7 breast cancer cells. Cancer Cell Int, 3(1), 2. [DOI] [PMC free article] [PubMed] [Google Scholar]
- 13. So, L., Lee, J., Palafox, M., Mallya, S., Woxland, C.G., Arguello, M., Truitt, M.L., Sonenberg, N., Ruggero, D. and Fruman, D.A. (2016) The 4E-BP-eIF4E axis promotes rapamycin-sensitive growth and proliferation in lymphocytes. Sci Signal, 9(430), ra57. [DOI] [PMC free article] [PubMed] [Google Scholar]
- 14. Schalm, S.S., Fingar, D.C., Sabatini, D.M. and Blenis, J. (2003) TOS motif-mediated raptor binding regulates 4E-BP1 multisite phosphorylation and function. Curr Biol, 13(10), 797–806. [DOI] [PubMed] [Google Scholar]
- 15. Tee, A.R. and Proud, C.G. (2002) Caspase cleavage of initiation factor 4E-binding protein 1 yields a dominant inhibitor of cap-dependent translation and reveals a novel regulatory motif. Mol Cell Biol, 22(6), 1674–1683. [DOI] [PMC free article] [PubMed] [Google Scholar]
- 16. Beugnet, A., Wang, X. and Proud, C.G. (2003) Target of rapamycin (TOR)-signaling and RAIP motifs play distinct roles in the mammalian TOR-dependent phosphorylation of initiation factor 4E-binding protein 1. J Biol Chem, 278(42), 40717–40722. [DOI] [PubMed] [Google Scholar]
- 17. Gingras, A.C., Raught, B., Gygi, S.P., Niedzwiecka, A., Miron, M., Burley, S.K., Polakiewicz, R.D., Wyslouch-Cieszynska, A., Aebersold, R. and Sonenberg, N. (2001) Hierarchical phosphorylation of the translation inhibitor 4E-BP1. Genes Dev, 15(21), 2852–2864. [DOI] [PMC free article] [PubMed] [Google Scholar]
- 18. Showkat, M., Beigh, M.A. and Andrabi, K.I. (2014) mTOR signaling in protein translation regulation: implications in cancer genesis and therapeutic interventions. Mol Biol Int, 2014, 686984. [DOI] [PMC free article] [PubMed] [Google Scholar]
- 19. Qin, X., Jiang, B. and Zhang, Y. (2016) 4E-BP1, a multifactor regulated multifunctional protein. Cell Cycle, 15(6), 781–786. [DOI] [PMC free article] [PubMed] [Google Scholar]
- 20. Josse, L., Xie, J., Proud, C.G. and Smales, C.M. (2016) mTORC1 signalling and eIF4E/4E-BP1 translation initiation factor stoichiometry influence recombinant protein productivity from GS-CHOK1 cells. Biochem J, 473(24), 4651–4664. [DOI] [PMC free article] [PubMed] [Google Scholar]
- 21. Schalm, S.S. and Blenis, J. (2002) Identification of a conserved motif required for mTOR signaling. Curr Biol, 12(8), 632–639. [DOI] [PubMed] [Google Scholar]
- 22. Morita, M., Gravel, S.P., Chenard, V., Sikstrom, K., Zheng, L., Alain, T., Gandin, V., Avizonis, D., Arguello, M., Zakaria, C.et al. (2013) mTORC1 controls mitochondrial activity and biogenesis through 4E-BP-dependent translational regulation. Cell Metab, 18(5), 698–711. [DOI] [PubMed] [Google Scholar]
- 23. Tsai, S., Sitzmann, J.M., Dastidar, S.G., Rodriguez, A.A., Vu, S.L., McDonald, C.E., Academia, E.C., O'Leary, M.N., Ashe, T.D., La Spada, A.R.et al. (2015) Muscle-specific 4E-BP1 signaling activation improves metabolic parameters during aging and obesity. J Clin Invest, 125(8), 2952–2964. [DOI] [PMC free article] [PubMed] [Google Scholar]
- 24. de Stephanis, L., Bonon, A., Varani, K., Lanza, G., Gafa, R., Pinton, P., Pema, M., Somlo, S., Boletta, A. and Aguiari, G. (2017) Double inhibition of cAMP and mTOR signalling may potentiate the reduction of cell growth in ADPKD cells. Clin Exp Nephrol, 21(2), 203–211. [DOI] [PMC free article] [PubMed] [Google Scholar]
- 25. Yin, H., Chao, L. and Chao, J. (2004) Adrenomedullin protects against myocardial apoptosis after ischemia/reperfusion through activation of Akt-GSK signaling. Hypertension, 43(1), 109–116. [DOI] [PubMed] [Google Scholar]
- 26. Mokhtari, B., Badalzadeh, R., Alihemmati, A. and Mohammadi, M. (2015) Phosphorylation of GSK-3beta and reduction of apoptosis as targets of troxerutin effect on reperfusion injury of diabetic myocardium. Eur J Pharmacol, 765, 316–321. [DOI] [PubMed] [Google Scholar]
- 27. Dias, N., Nicolau, A., Carvalho, G.S., Mota, M. and Lima, N. (1999) Miniaturization and application of the MTT assay to evaluate metabolic activity of protozoa in the presence of toxicants. J Basic Microbiol, 39(2), 103–108. [PubMed] [Google Scholar]
- 28. Powelka, A.M., Seth, A., Virbasius, J.V., Kiskinis, E., Nicoloro, S.M., Guilherme, A., Tang, X., Straubhaar, J., Cherniack, A.D., Parker, M.G.et al. (2006) Suppression of oxidative metabolism and mitochondrial biogenesis by the transcriptional corepressor RIP140 in mouse adipocytes. J Clin Invest, 116(1), 125–136. [DOI] [PMC free article] [PubMed] [Google Scholar]
- 29. Ishimoto, Y., Inagi, R., Yoshihara, D., Kugita, M., Nagao, S., Shimizu, A., Takeda, N., Wake, M., Honda, K., Zhou, J.et al. (2017) Mitochondrial abnormality facilitates cyst formation in autosomal dominant polycystic kidney disease. Mol Cell Biol. [DOI] [PMC free article] [PubMed] [Google Scholar]
- 30. Dikalov, S.I. and Harrison, D.G. (2014) Methods for detection of mitochondrial and cellular reactive oxygen species. Antioxid Redox Signal, 20(2), 372–382. [DOI] [PMC free article] [PubMed] [Google Scholar]
- 31. Dere, R., Wilson, P.D., Sandford, R.N. and Walker, C.L. (2010) Carboxy terminal tail of polycystin-1 regulates localization of TSC2 to repress mTOR. PLoS One, 5(2), e9239. [DOI] [PMC free article] [PubMed] [Google Scholar]
- 32. Distefano, G., Boca, M., Rowe, I., Wodarczyk, C., Ma, L., Piontek, K.B., Germino, G.G., Pandolfi, P.P. and Boletta, A. (2009) Polycystin-1 regulates extracellular signal-regulated kinase-dependent phosphorylation of tuberin to control cell size through mTOR and its downstream effectors S6K and 4EBP1. Mol Cell Biol, 29(9), 2359–2371. [DOI] [PMC free article] [PubMed] [Google Scholar]
- 33. Livingstone, M. and Bidinosti, M. (2012) Rapamycin-insensitive mTORC1 activity controls eIF4E:4E-BP1 binding. F1000Res, 1, 4. [DOI] [PMC free article] [PubMed] [Google Scholar]
- 34. Zhang, H., Cicchetti, G., Onda, H., Koon, H.B., Asrican, K., Bajraszewski, N., Vazquez, F., Carpenter, C.L. and Kwiatkowski, D.J. (2003) Loss of Tsc1/Tsc2 activates mTOR and disrupts PI3K-Akt signaling through downregulation of PDGFR. J Clin Invest, 112(8), 1223–1233. [DOI] [PMC free article] [PubMed] [Google Scholar]
- 35. Kimball, S.R., Do, A.N., Kutzler, L., Cavener, D.R. and Jefferson, L.S. (2008) Rapid turnover of the mTOR complex 1 (mTORC1) repressor REDD1 and activation of mTORC1 signaling following inhibition of protein synthesis. J Biol Chem, 283(6), 3465–3475. [DOI] [PMC free article] [PubMed] [Google Scholar]
- 36. Chiavarina, B., Whitaker-Menezes, D., Martinez-Outschoorn, U.E., Witkiewicz, A.K., Birbe, R., Howell, A., Pestell, R.G., Smith, J., Daniel, R., Sotgia, F.et al. (2011) Pyruvate kinase expression (PKM1 and PKM2) in cancer-associated fibroblasts drives stromal nutrient production and tumor growth. Cancer Biol Ther, 12(12), 1101–1113. [DOI] [PMC free article] [PubMed] [Google Scholar]
- 37. Hoskins, D.D. and Mackenzie, C.G. (1961) Solubilization and electron transfer flavoprtein requirement of mitochondrial sarcosine dehydrogenase and dimethylglycine dehydrogenase. J Biol Chem, 236, 177–183. [PubMed] [Google Scholar]
- 38. Bonawitz, N.D., Clayton, D.A. and Shadel, G.S. (2006) Initiation and beyond: multiple functions of the human mitochondrial transcription machinery. Mol Cell, 24(6), 813–825. [DOI] [PubMed] [Google Scholar]
- 39. Cairns, R.A., Harris, I.S. and Mak, T.W. (2011) Regulation of cancer cell metabolism. Nat Rev Cancer, 11(2), 85–95. [DOI] [PubMed] [Google Scholar]
- 40. Kamp, D.W., Shacter, E. and Weitzman, S.A. (2011) Chronic inflammation and cancer: the role of the mitochondria. Oncology (Williston Park), 25(5), 400–410413. [PubMed] [Google Scholar]
- 41. Liemburg-Apers, D.C., Willems, P.H., Koopman, W.J. and Grefte, S. (2015) Interactions between mitochondrial reactive oxygen species and cellular glucose metabolism. Arch Toxicol, 89(8), 1209–1226. [DOI] [PMC free article] [PubMed] [Google Scholar]
- 42. Moreno-Sanchez, R., Rodriguez-Enriquez, S., Marin-Hernandez, A. and Saavedra, E. (2007) Energy metabolism in tumor cells. FEBS J, 274(6), 1393–1418. [DOI] [PubMed] [Google Scholar]
- 43. Liou, G.Y. and Storz, P. (2010) Reactive oxygen species in cancer. Free Radic Res, 44(5), 479–496. [DOI] [PMC free article] [PubMed] [Google Scholar]
- 44. Antico Arciuch, V.G., Elguero, M.E., Poderoso, J.J. and Carreras, M.C. (2012) Mitochondrial regulation of cell cycle and proliferation. Antioxid Redox Signal, 16(10), 1150–1180. [DOI] [PMC free article] [PubMed] [Google Scholar]
- 45. Goo, C.K., Lim, H.Y., Ho, Q.S., Too, H.P., Clement, M.V. and Wong, K.P. (2012) PTEN/Akt signaling controls mitochondrial respiratory capacity through 4E-BP1. PLoS One, 7(9), e45806. [DOI] [PMC free article] [PubMed] [Google Scholar]
- 46. Zid, B.M., Rogers, A.N., Katewa, S.D., Vargas, M.A., Kolipinski, M.C., Lu, T.A., Benzer, S. and Kapahi, P. (2009) 4E-BP extends lifespan upon dietary restriction by enhancing mitochondrial activity in Drosophila. Cell, 139(1), 149–160. [DOI] [PMC free article] [PubMed] [Google Scholar]
- 47. Tsukiyama-Kohara, K., Poulin, F., Kohara, M., DeMaria, C.T., Cheng, A., Wu, Z., Gingras, A.-C., Katsume, A., Elchebly, M., Spiegelman, B.M.et al. (2001) Adipose tissue reduction in mice lacking the translational inhibitor 4E-BP1. Nature Medicine, 7, 1128. [DOI] [PubMed] [Google Scholar]
- 48. Ding, M., Van der Kwast, T.H., Vellanki, R.N., Foltz, W.D., McKee, T.D., Sonenberg, N., Pandolfi, P.P., Koritzinsky, M. and Wouters, B.G. (2018) The mTOR targets 4E-BP1/2 restrain tumor growth and promote hypoxia tolerance in PTEN-driven prostate cancer. Mol Cancer Res, 16(4), 682–695. [DOI] [PubMed] [Google Scholar]
- 49. Zhang, D., Contu, R., Latronico, M.V., Zhang, J., Rizzi, R., Catalucci, D., Miyamoto, S., Huang, K., Ceci, M., Gu, Y.et al. (2010) MTORC1 regulates cardiac function and myocyte survival through 4E-BP1 inhibition in mice. J Clin Invest, 120(8), 2805–2816. [DOI] [PMC free article] [PubMed] [Google Scholar]
- 50. Fan, Q., Aksoy, O., Wong, R.A., Ilkhanizadeh, S., Novotny, C.J., Gustafson, W.C., Truong, A.Y., Cayanan, G., Simonds, E.F., Haas-Kogan, D.et al. (2017) A kinase inhibitor targeted to mTORC1 drives regression in glioblastoma. Cancer Cell, 31(3), 424–435. [DOI] [PMC free article] [PubMed] [Google Scholar]
- 51. Edelstein, C.L. (2005) What is the role of tubular epithelial cell apoptosis in polycystic kidney disease (PKD)? Cell Cycle, 4(11), 1550–1554. [DOI] [PubMed] [Google Scholar]
- 52. Loghman-Adham, M., Nauli, S.M., Soto, C.E., Kariuki, B. and Zhou, J. (2003) Immortalized epithelial cells from human autosomal dominant polycystic kidney cysts. Am J Physiol Renal Physiol, 285(3), F397–F412. [DOI] [PubMed] [Google Scholar]
- 53. Holditch, S.J., Schreiber, C.A., Harris, P.C., LaRusso, N.F., Ramirez-Alvarado, M., Cataliotti, A., Torres, V.E. and Ikeda, Y. (2017) B-type natriuretic peptide overexpression ameliorates hepatorenal fibrocystic disease in a rat model of polycystic kidney disease. Kidney Int, 92(3), 657–668. [DOI] [PMC free article] [PubMed] [Google Scholar]
- 54. Rooney, J.P., Ryde, I.T., Sanders, L.H., Howlett, E.H., Colton, M.D., Germ, K.E., Mayer, G.D., Greenamyre, J.T. and Meyer, J.N. (2015) PCR based determination of mitochondrial DNA copy number in multiple species. Methods Mol Biol, 1241, 23–38. [DOI] [PMC free article] [PubMed] [Google Scholar]
- 55. Hopp, K., Hommerding, C.J., Wang, X., Ye, H., Harris, P.C. and Torres, V.E. (2015) Tolvaptan plus pasireotide shows enhanced efficacy in a PKD1 model. J Am Soc Nephrol, 26(1), 39–47. [DOI] [PMC free article] [PubMed] [Google Scholar]
- 56. Hopp, K., Ward, C.J., Hommerding, C.J., Nasr, S.H., Tuan, H.F., Gainullin, V.G., Rossetti, S., Torres, V.E. and Harris, P.C. (2012) Functional polycystin-1 dosage governs autosomal dominant polycystic kidney disease severity. J Clin Invest, 122(11), 4257–4273. [DOI] [PMC free article] [PubMed] [Google Scholar]
- 57. Holditch SJ, Schreiber CA, Nini R, Tonne JM, Peng KW, Geurts A, Jacob HJ, Burnett JC, Cataliotti A, Ikeda Y: B-type natriuretic peptide deletion leads to progressive hypertension, associated organ damage, and reduced survival: novel model for human hypertension. Hypertension2015, 66(1):199–210. [DOI] [PMC free article] [PubMed] [Google Scholar]
- 58. Holditch, S.J., Schreiber, C.A., Burnett, J.C. and Ikeda, Y. (2016) Arterial remodeling in B-type natriuretic peptide Knock-out females. Sci Rep, 6, 25623. [DOI] [PMC free article] [PubMed] [Google Scholar]
Associated Data
This section collects any data citations, data availability statements, or supplementary materials included in this article.


