SUMMARY:
Pediatric choroid plexus papillomas and carcinomas are highly vascularized neoplasms, which are difficult to distinguish with conventional imaging. We aimed to analyze the diagnostic accuracy of PWI, by using both pseudocontinuous arterial spin-labeling and DSC-PWI. We reviewed the PWI of 13 children with choroid plexus neoplasms (7 papillomas and 6 carcinomas). We quantified CBF, relative CBF, and relative CBV in each lesion and compared papillomas and carcinomas. Relative CBF values by using arterial spin-labeling were significantly higher for carcinomas (P = .028). The median value of relative CBF was 1.7 (range, 1.4–1.9) for carcinomas and 0.4 (range, 0.3–0.6) for papillomas. The CBF median value was 115 mL/min/100 g (range, 90–140 mL/min/100 g) for carcinomas and 41 mL/min/100 g (range, 10–73 mL/min/100 g) for papillomas (P = .056). Measures with DSC-PWI were more variable and not significantly different (P = .393). Arterial spin-labeling is a promising technique to differentiate choroid plexus carcinomas and papillomas.
Choroid plexus neoplasms are rare intraventricular tumors, which account for approximately 2% of pediatric brain tumors1,2 but are comparatively more common in neonates (5%–20% of perinatal brain tumors3). Benign papillomas are reported to account for approximately 80% of neoplasms, and carcinomas, 20%.4
Pathologic examination of papillomas reveals a papillary architecture composed of delicate fibrovascular connective tissue fronds covered by a single layer of uniform epithelial cells. In carcinomas, it reveals the blurring of the papillary pattern, with poorly structured sheets of tumor cells and necrotic areas.4 These different patterns are responsible for a very dissimilar vascular organization.
Conventional imaging alone does not allow differentiating these 2 entities, and a pathologic examination is always needed.5 A preoperative diagnosis could be very useful, even if surgery is performed for all cases. Differentiation of the 2 tumors on imaging could change management. In fact, it may allow the surgeon to adapt his or her surgical strategy (possible preoperative embolization for example) because carcinomas are more invasive and tend to be more hemorrhagic.
Therefore, advanced MR imaging techniques such as perfusion-weighted imaging could provide additional information on tumor vascularization that may help in the differential diagnosis. Two previous studies6,7 reported various results for DSC-PWI of papillomas, and there is no report for carcinomas. One recent study8 reported arterial spin-labeling (ASL) PWI of pediatric brain tumors, including 1 carcinoma and 4 choroid plexus papillomas, with higher relative tumor blood flow for the carcinoma.
The objective of our study was to analyze the perfusion pattern of pediatric choroid plexus papilloma and carcinoma with perfusion weighted-imaging, by using ASL or DSC-PWI.
Materials and Methods
Patients
We performed a retrospective analysis of the prospective data base for brain tumors of our pediatric neurosurgery department (Hôpital Necker–Enfants Malades, Paris) from January 2011 (when we began to use ASL for pediatric brain tumors) to September 2014, looking for all choroid plexus lesions.
Inclusion criteria were the following: available MR imaging with PWI (ASL or DSC) in our radiology department; no prior surgical resection, biopsy, or treatment of the tumor; and a histologic diagnosis of choroid plexus papilloma or carcinoma.
Imaging Methods
MR imaging was performed on a Signa HDxt 1.5T system (GE Healthcare, Milwaukee, Wisconsin) by using a 12-channel Head-Neck-Spine coil (GE Healthcare). The MR imaging investigation included standard sequences for tumoral diseases (3D T1-weighted images, 3D T1WI with gadolinium injection, 3D T2-weighted images, diffusion-weighted images), noncontrast perfusion imaging with 3D pseudocontinuous arterial spin-labeling MR imaging, and dynamic susceptibility contrast perfusion-weighted MR imaging.
Acquisition parameters for the ASL sequence were the following: 80 axial partitions; FOV, 240 × 240 × 4 mm3; acquisition matrix, 8 spiral arms in each 3D partition, 512 points per arm; TE, 10.5 ms; TR, 4428 ms; postlabeling delay, 1025 ms; flip angle, 155°; acquisition time, 4 minutes 17 seconds.
Acquisition parameters for the DSC sequence were the following: 18 axial partitions repeated 75 times; FOV, 240 × 240 × 5 mm3; gradient echo: TE, 60 ms; TR, 2000 ms; flip angle, 90°; acquisition time, 2 minutes 30 seconds.
Imaging Analysis
Using an Advantage Workstation (Version 4.2; GE Healthcare), we automatically realigned the 3D T1 (with and without gadolinium) and ASL or DSC sequences and fused them in a volume viewer. The color scale of cerebral blood flow or cerebral blood volume maps was set to rainbow.
ROIs were drawn around each tumor to obtain mean CBF (for ASL and DSC-PWI) and mean CBV (for DSC-PWI) (Figs 1 and 2). ROIs were also placed in the most perfused areas of the lesions, selected visually on CBF and CBV maps, to obtain maximal CBF and maximal CBV.
Fig 1.
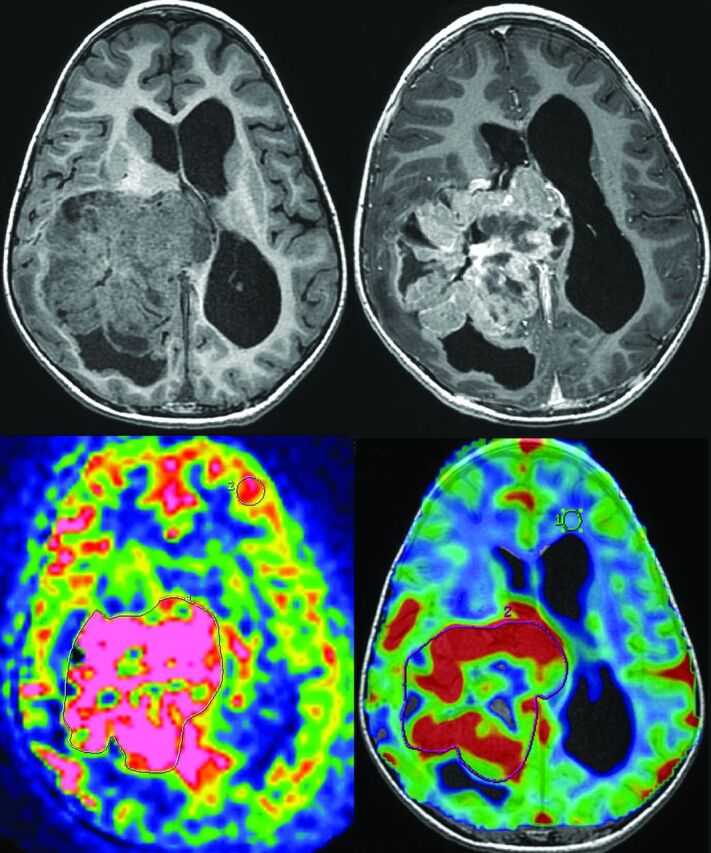
Measurement of ASL and DSC-PWI of a choroid plexus carcinoma (patient 8). Top left: 3D T1-weighted MR imaging. Top right: 3D T1-weighted MR imaging with gadolinium injection. Bottom left: arterial spin-labeling. ROIs are drawn around the whole tumor and in the contralateral gray matter. Bottom right: dynamic susceptibility contrast perfusion-weighted imaging. ROIs are drawn around the whole tumor and in the contralateral white matter.
Fig 2.
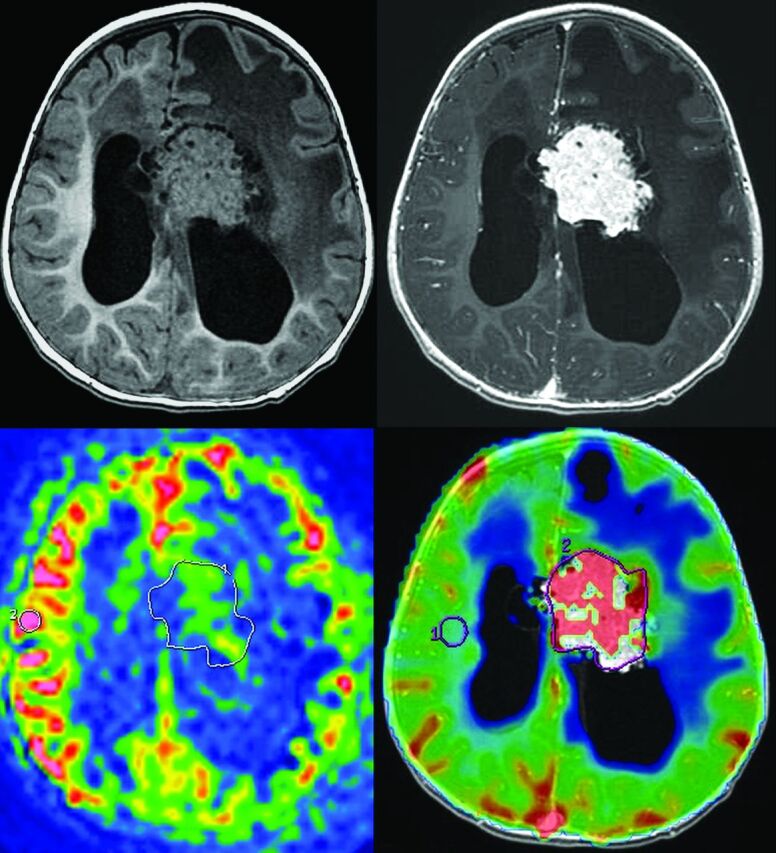
Measurement of ASL and DSC-PWI of a choroid plexus papilloma (patient 1). Top left: 3D T1-weighted MR imaging. Top right: 3D T1-weighted MR imaging with gadolinium injection. Bottom left: arterial spin-labeling. ROIs are drawn around the whole tumor and in the contralateral gray matter. Bottom right: dynamic susceptibility contrast perfusion-weighted imaging. ROIs are drawn around the whole tumor and in the contralateral white matter.
To correct for age-dependent and patient-dependent variations of mean cerebral perfusion, CBF was normalized to an ROI in the contralateral normal-appearing cortical gray matter to produce the relative CBF (rCBF). Gray matter was chosen as a reference, as in the study of Yeom et al,8 because it has a higher signal-to-noise ratio. CBV was normalized to an ROI in the normal-appearing contralateral white matter to produce the relative CBV (rCBV). White matter was chosen here, as usually found in the literature, because of its better reproducibility.9
ROIs were placed independently by a senior neuroradiologist (D.G., with 10 years of experience), blinded to clinical and pathologic data, and a radiology resident (V.D.-R., with 3 years of experience). We analyzed the mean value for each variable and the concordance between the 2 observers.
Histopathologic Analysis
Tumor samples were analyzed by using hematoxylin-eosin staining and an immunohistochemistry panel. The tumors were classified according to the WHO Classification of Tumors of the Central Nervous System (2007).4
There were 5-μm tissue sections of formalin-fixed, paraffin-embedded tissue used for immunostaining with a monoclonal mouse antihuman CD34 antibody (IM 1185, IOPath; Beckman Coulter, Marseille, France). The reaction was carried out in an automated immunohistochemistry instrument (Discovery XT; Ventana Medical Systems, Basel, Switzerland).
Quantitative and qualitative analysis of microvessels was performed in all cases by light microscopy. Microvascular architecture (arborescent or not) and the presence of endothelial capillary proliferation and parietal vascular necrosis were noted. A quantitative analysis was performed on 3 fields (0.5 mm2 per field) selected in the most vascularized tumor areas on each specimen. Any CD34-positive endothelial cells clearly separated from tumoral cells were considered as a countable microvessel. The results are described as a mean of CD34-positive microvessels per 0.5 mm2.
Statistical Analysis
We performed a statistical analysis by using R statistical computing software (http://www.r-project.org) and GraphPad Prism software (GraphPad Software, San Diego, California).
We compared the distribution of perfusion values between papillomas and carcinomas by using a nonparametric Mann-Whitney test with an a priori significance level of P = .05. Papillomas and atypical papillomas were grouped in the statistical analysis because they showed similar vascularization patterns on histopathology and imaging. We estimated the reproducibility of the values between the 2 readers by using Bland-Altman plots.
Results
Patients
Thirty-eight patients underwent a resection of choroid plexus lesions (29 papillomas, 6 carcinomas, 2 cysts, 1 neurocytoma), and 2 patients were followed for choroid plexus hyperplasia. Twenty-five patients had no PWI before surgery, mainly because the imaging was performed at another institution.
We included 13 patients with the following conditions: 6 carcinomas (1 had MR imaging with ASL and DSC-PWI, 1 with only ASL, and 4 with only DSC-PWI; see an example in Fig 1) and 7 papillomas (3 had MR imaging with ASL and DSC-PWI, 4 with only ASL; see an example in Fig 2). The median age of the 13 patients included was 1 year 6 months (range, 7 months to 16 years). There were 5 girls and 8 boys.
Histopathologic Analysis
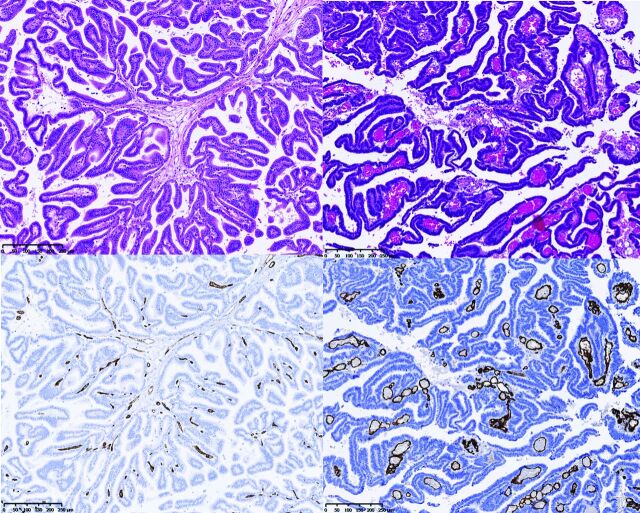
Four lesions were classified as choroid plexus papillomas (cases 1–4); 3, as atypical papillomas (cases 5, 6, and 7); and 6, as carcinomas (cases 8–13). Two examples are shown in Fig 3. Quantitative and qualitative analyses of microvessels are listed in Fig 4 and On-line Tables 1 and 2.
Fig 3.
Histopathology. Hematoxylin-eosin staining (top) and CD34 immunostaining (bottom) of 1 representative patient with papilloma (case 3, on the left) and 1 representative patient with carcinoma (case 8, on the right), showing the differences in the microvascular architecture. (Magnification × 250.)
Fig 4.
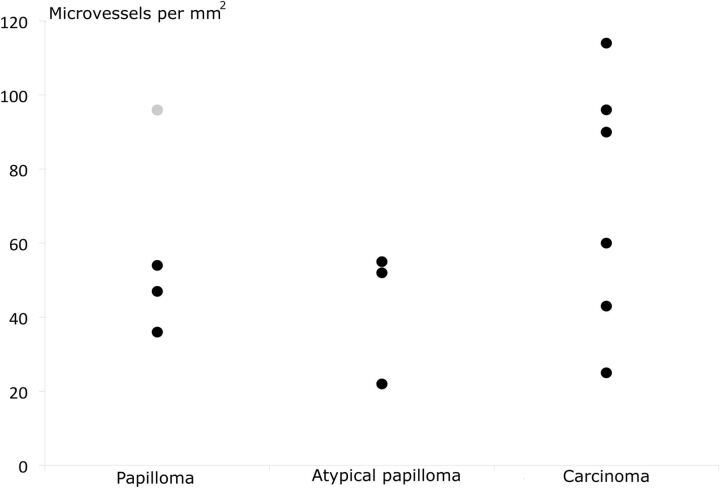
Number of microvessels per square millimeter for papillomas, atypical papillomas, and carcinomas. The gray point in the papillomas corresponds to patient 4, in whom microvessels are probably overestimated due to crushing artifacts.
Papillomas showed delicate arborescent microvascular architecture within the fibroconnective tissue. Conversely, carcinomas showed a disorganization of microvascular architecture with dilated vessels and budding.
Five carcinoma specimens displayed a vascular necrosis, but only 2 cases of papilloma showed it. Most interesting, the 2 cases of papilloma showing focal vascular necrosis also revealed less well-organized microvascular architecture than other papilloma specimens and had been classified as atypical papillomas.
Moreover, no papilloma showed endothelial capillary proliferation, whereas 4 cases of carcinomas showed endothelial capillary proliferation.
Four carcinoma samples had a mean microvessel count of >60 per 0.5 mm2, whereas only 1 papilloma specimen had a count that exceeded 60 microvessels per 0.5 mm2 (probable overestimation due to a crushing artifacts). The median of the total microvessel count per 0.5 mm2 excluding this specimen was 47 (range, 22–54) in papillomas and 75 (range, 25–114) in carcinomas. However, we found no statistical difference (P = .16), even excluding this specimen.
Comparison Using ASL-PWI
Figure 5, On-line Fig 1, and On-line Tables 1 and 2 summarize the ASL results of 9 patients.
Fig 5.
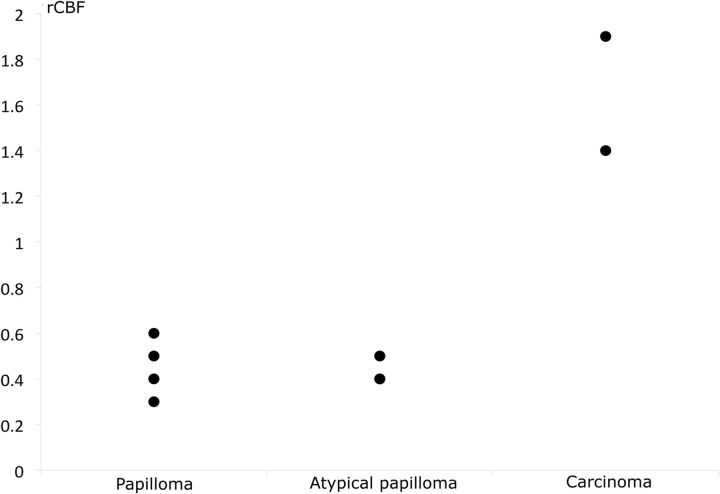
Relative cerebral blood flow of papillomas, atypical papillomas, and carcinomas by using ASL. rCBF is normalized to the contralateral gray matter. Two atypical papillomas had the same value and share the same point (0.4).
The values obtained for carcinomas were always higher than those of papillomas for all the variables. rCBF values were significantly higher for carcinomas than for papillomas (P = .028). The median value of rCBF was 1.7 (range, 1.4–1.9) for carcinomas and 0.4 (range, 0.3–0.6) for papillomas. CBF, maximal CBF, and maximal rCBF values were not strictly significantly different between carcinomas and papillomas, but there were strong tendencies (P = .056). The CBF median value was 115 mL/min/100 g (range, 90–140 mL/min/100 g) for carcinomas and 41 mL/min/100 g (range, 10–73 mL/min/100 g) for papillomas. The maximal rCBF median value was 3.4 (range, 2.7–4.1) for carcinomas and 1.1 (range, 0.5–1.1) for papillomas (On-line Fig 1).
Comparison Using DSC-PWI
Figure 6 and On-line Tables 1 and 2 summarize the DSC-PWI results of 8 patients.
Fig 6.
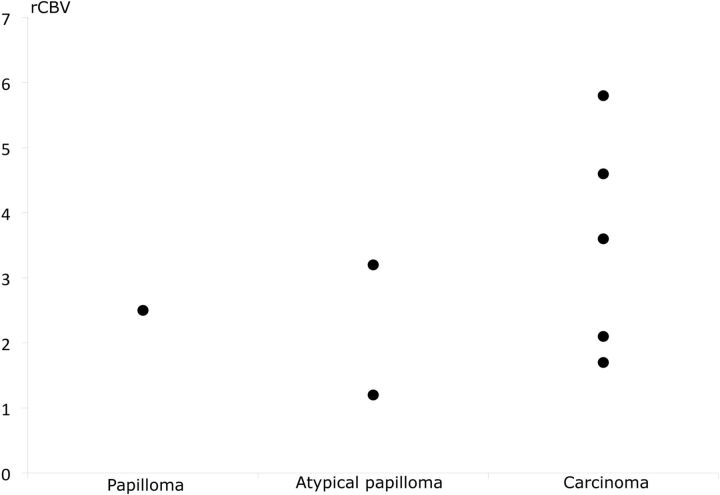
Relative cerebral blood volume of papillomas, atypical papillomas, and carcinomas by using DSC-PWI. rCBV is normalized to the contralateral white matter.
Once again, carcinomas tended to have higher perfusion values for all variables, but the values overlapped, with 2 papillomas having a higher perfusion than 2 carcinomas. For example, the median rCBV value was 3.6 (range, 1.7–5.8) for carcinomas and 2.5 (range, 1.3–3.2) for papillomas. The median rCBF (compared with gray matter) value was 1.0 (range, 1.9–0.5) for carcinomas and 0.7 (range, 0.4–1.1) for papillomas.
No variable showed any statistical difference (P = .393 to P = .786; On-line Tables 1 and 2).
Concordance between Observers
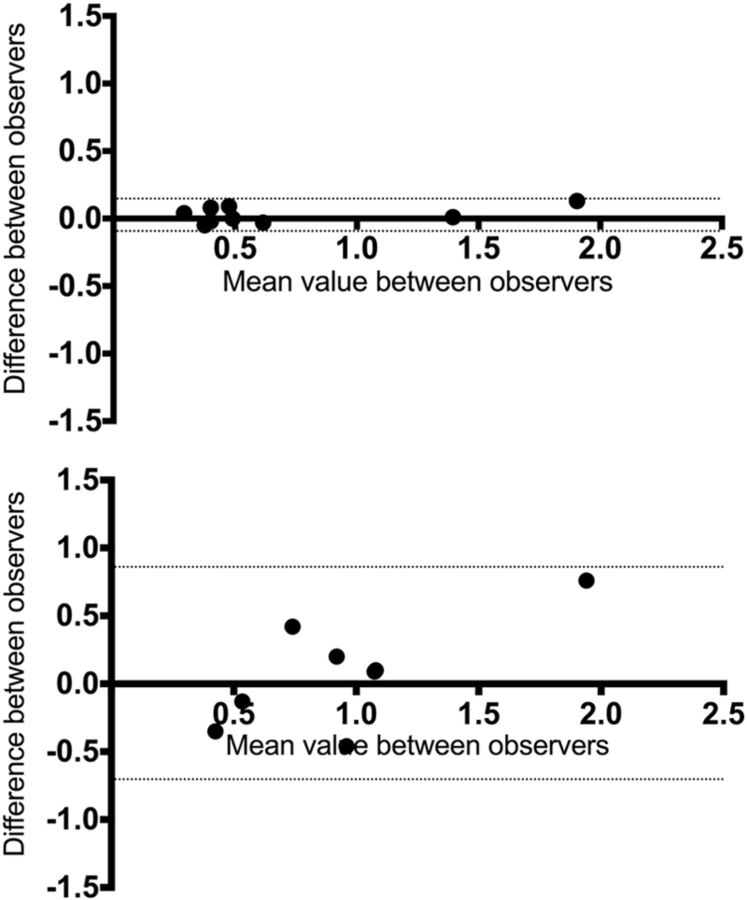
Bland-Altman plots are shown in Fig 7.
Fig 7.
Bland-Altman plots comparing the 2 observers. Difference versus average of rCBF by using ASL (top) and DSC-PWI (bottom). Solid lines and adjacent numbers indicate the difference between observers and mean values between observers, while dashed lines indicate the limits of agreement.
Concordance was better for each ASL variable than for DSC-PWI. For rCBF by using ASL, the analysis revealed a mean difference between the 2 readers of 0.027, with limits of agreement of −0.099 at the lower limit and 0.15 at the upper limit (−18% and 24% of difference, respectively); by using DSC-PWI, the mean difference was 0.077, with limits of agreement of −0.77 at the lower limit and 0.92 at the upper limit (−101% and 93%, respectively).
Discussion
In this study, we report 13 pediatric cases of choroid plexus tumors explored with perfusion MR imaging by using ASL or DSC-PWI.
ASL-MR imaging is very relevant in a pediatric population because it takes only 5 minutes and does not require intravenous injection.
We measured a higher rCBF with ASL in carcinomas, therefore allowing differentiation between choroid plexus carcinomas and papillomas. ASL rCBF values were very reproducible between the 2 observers. We could find a statistical difference, despite the small number of patients, supporting a strong difference between those neoplasms. The results are similar to those of the previous study by using ASL in pediatric brain tumors, by using a 3T MR imaging magnet,8 which had only 4 papillomas and 1 carcinoma. Indeed, studying in the report only maximal rCBF, Yeom et al8 found a median value of 1.13 for papillomas (n = 3) versus 0.95 in our study (n = 4) and 1.34 for atypical papillomas (n = 1) versus 1.1 (n = 3) in our study. They found a higher maximal rCBF at 7.96 (n = 1) versus 3.4 (n = 2) for carcinomas. Nevertheless, the ranking was always the same, and the values never overlapped between the 2 studies.
DSC-PWI rCBV values were higher for carcinomas, but tendencies were weak and so was the concordance between the 2 observers. This lack of concordance and the smaller predictive value of DSC-PWI may be explained by the use of gradient-echo EPI for DSC-PWI, which is very sensitive to susceptibility artifacts that may be caused by bleeding in those tumors. Furthermore, the low injection flow in young children (which is variable among patients, from 0.5 to 1.5 mL/s) may explain problems in modeling the arterial input function. To our knowledge, no report has been published concerning the use of DSC-PWI for choroids plexus carcinomas, and only a few,6,7 concerning papillomas.
Histopathologic substrates may explain differences between papillomas and carcinomas in rCBV measured with ASL. Indeed, carcinomas tend to have a higher number of microvessels and a very dissimilar organization, with frequent endothelial capillary proliferation and vascular necrosis. To our knowledge, this is the first study with vessel quantification in choroid plexus tumors, and the previous qualitative studies only reported architectural features.
There are 2 major limits to our study. First, the small number of patients seems to be unavoidable because this tumor is rare and because ASL only became available in our department in 2011. Second, some patients lacked perfusion-weighted sequences because of the retrospective design of our study.
Conclusions
ASL perfusion MR imaging can discriminate preoperatively between choroid plexus carcinomas and papillomas; this finding helps the surgeon to adapt his or her operative strategy (possible preoperative embolization). This sequence could also be of great interest in the follow-up of patients to detect tumor recurrence.
Supplementary Material
ABBREVIATIONS:
- ASL
arterial spin-labeling
- rCBF
relative CBF
- rCBV
relative CBV
Footnotes
Disclosures: Pascale Varlet—UNRELATED: Board Membership: Hoffman-LaRoche*; Consultancy: Boehringer Ingelheim*; Grants/Grants Pending: La Ligue contre le cancer, l'Institut national du cancer. *Money paid to the institution.
Paper previously presented at: Journées Française de Radiologie, October 16–20, 2014; Paris, France.
References
- 1. Rickert CH, Paulus W. Epidemiology of central nervous system tumors in childhood and adolescence based on the new WHO classification. Childs Nerv Syst 2001;17:503–11 [DOI] [PubMed] [Google Scholar]
- 2. Kaderali Z, Lamberti-Pasculli M, Rutka JT. The changing epidemiology of paediatric brain tumours: a review from the Hospital for Sick Children. Childs Nerv Syst 2009;25:787–93 [DOI] [PubMed] [Google Scholar]
- 3. Severino M, Schwartz ES, Thurnher MM, et al. Congenital tumors of the central nervous system. Neuroradiology 2010;52:531–48 [DOI] [PubMed] [Google Scholar]
- 4. Paulus W, Brandner S. Choroid plexus tumours. In: Louis DN, Cavenee WK, Ohgaki H, et al. World Health Organization Classification of Tumours of the Central Nervous System. Lyon: IARC; 2007:82–85 [Google Scholar]
- 5. Smith AB, Smirniotopoulos JG, Horkanyne-Szakaly I. From the radiologic pathology archives: intraventricular neoplasms: radiologic-pathologic correlation. Radiographics 2013;33:21–43 [DOI] [PubMed] [Google Scholar]
- 6. Holveck A, Grand S, Boini S, et al. Dynamic susceptibility contrast-enhanced MRI evaluation of cerebral intraventricular tumors: preliminary results. J Neuroradiol 2010;37:269–75 [DOI] [PubMed] [Google Scholar]
- 7. Zimny A, Sasiadek M. Contribution of perfusion-weighted magnetic resonance imaging in the differentiation of meningiomas and other extra-axial tumors: case reports and literature review. J Neurooncol 2011;103:777–83 [DOI] [PMC free article] [PubMed] [Google Scholar]
- 8. Yeom KW, Mitchell LA, Lober RM, et al. Arterial spin-labeled perfusion of pediatric brain tumors. AJNR Am J Neuroradiol 2014;35:395–401 [DOI] [PMC free article] [PubMed] [Google Scholar]
- 9. Cha S, Knopp EA, Johnson G, et al. Intracranial mass lesions: dynamic contrast-enhanced susceptibility-weighted echo-planar perfusion MR imaging. Radiology 2002;22:11–29 [DOI] [PubMed] [Google Scholar]
Associated Data
This section collects any data citations, data availability statements, or supplementary materials included in this article.


