Abstract
The availability of public mass spectrometry data continues to grow; however, leveraging public metabolomics data is hard. We, therefore, created ReDU (https://redu.ucsd.edu/), which comprises a system for metadata capture with validated controlled vocabularies. Systematic capture of knowledge enables the re-analysis of public data and/or co-analysis of one’s own data. Examples of analyses powered by ReDU include Chemical Explorer, Group Comparator, and metadata-filtered repository-scale molecular networking.
Data is immensely valuable, including the increasing amount of public mass spectrometry (MS) data. The challenge is extracting value from public MS data repositories as it is arduous to find relevant files scattered amongst different datasets and analyze them in a consistent and meaningful manner. We, therefore, developed the Reanalysis of Data User (ReDU) interface (https://redu.ucsd.edu/), a community-minded approach that addresses these challenges. ReDU finds uniformly formatted public MS/MS data in the Global Natural Product Social Molecular Networking Platform (GNPS), https://gnps.ucsd.edu/, via formatted metadata.1 New or previously collected data can be added provided they adhere to the ReDU metadata standards (the implemented drag-and-drop validator is applicable to any scientific data) and the data are available in GNPS/MassIVE. Further, ReDU has built-in analyses and can launch co- or re-analysis of data via GNPS.
Simple but important questions can be explored using repository-scale public data. For example, of those sampled, what human biospecimen or sampling location is best for detecting a given drug? Or what molecules have been observed in humans <2 years old? Current metabolomics repositories (e.g. GNPS/MassIVE, MetaboLights,2 Metabolomics Workbench3) contain data and metadata; however, finding individual files typically require manual navigation, conversion of different file formats, and reformatting of inconsistent metadata formats. ReDU is a repository-scale analysis system using consistent formatting, controlled vocabularies that can be validated, and re-analysis of MS/MS data de novo as opposed to the meta-analysis of reported results.
ReDU enables users to find and choose files (Fig 1a) via consistent and validated sample information (i.e. metadata) created by users via a template. The template uses controlled vocabularies and ontologies (e.g. NCBI taxonomy,4 UBERON,5 DOID,6 and MS ontology). ReDU automatically incorporates public data in the GNPS/MassIVE repository that has the corresponding ReDU-compliant metadata file in GNPS/MassIVE. 38,305 files in GNPS (19.6% of GNPS) are ReDU-compatible including natural and human-built environments, human and animal tissues, biofluids, food, and other data from around the world (Extended Data Fig. 1), analyzed using different instruments, ionization methods, sample preparation methods, etc. From the 103,230,404 million MS/MS spectra included in ReDU, 4,528,624 spectra were annotated (rate of 4.39%, ~1% FDR) as one of 13,217 unique MS/MS library matches (level 2 or 3), Supplementary Table 1.7,8
Fig 1. ReDU Framework and Illustrative Public ReDU Data Analyses.
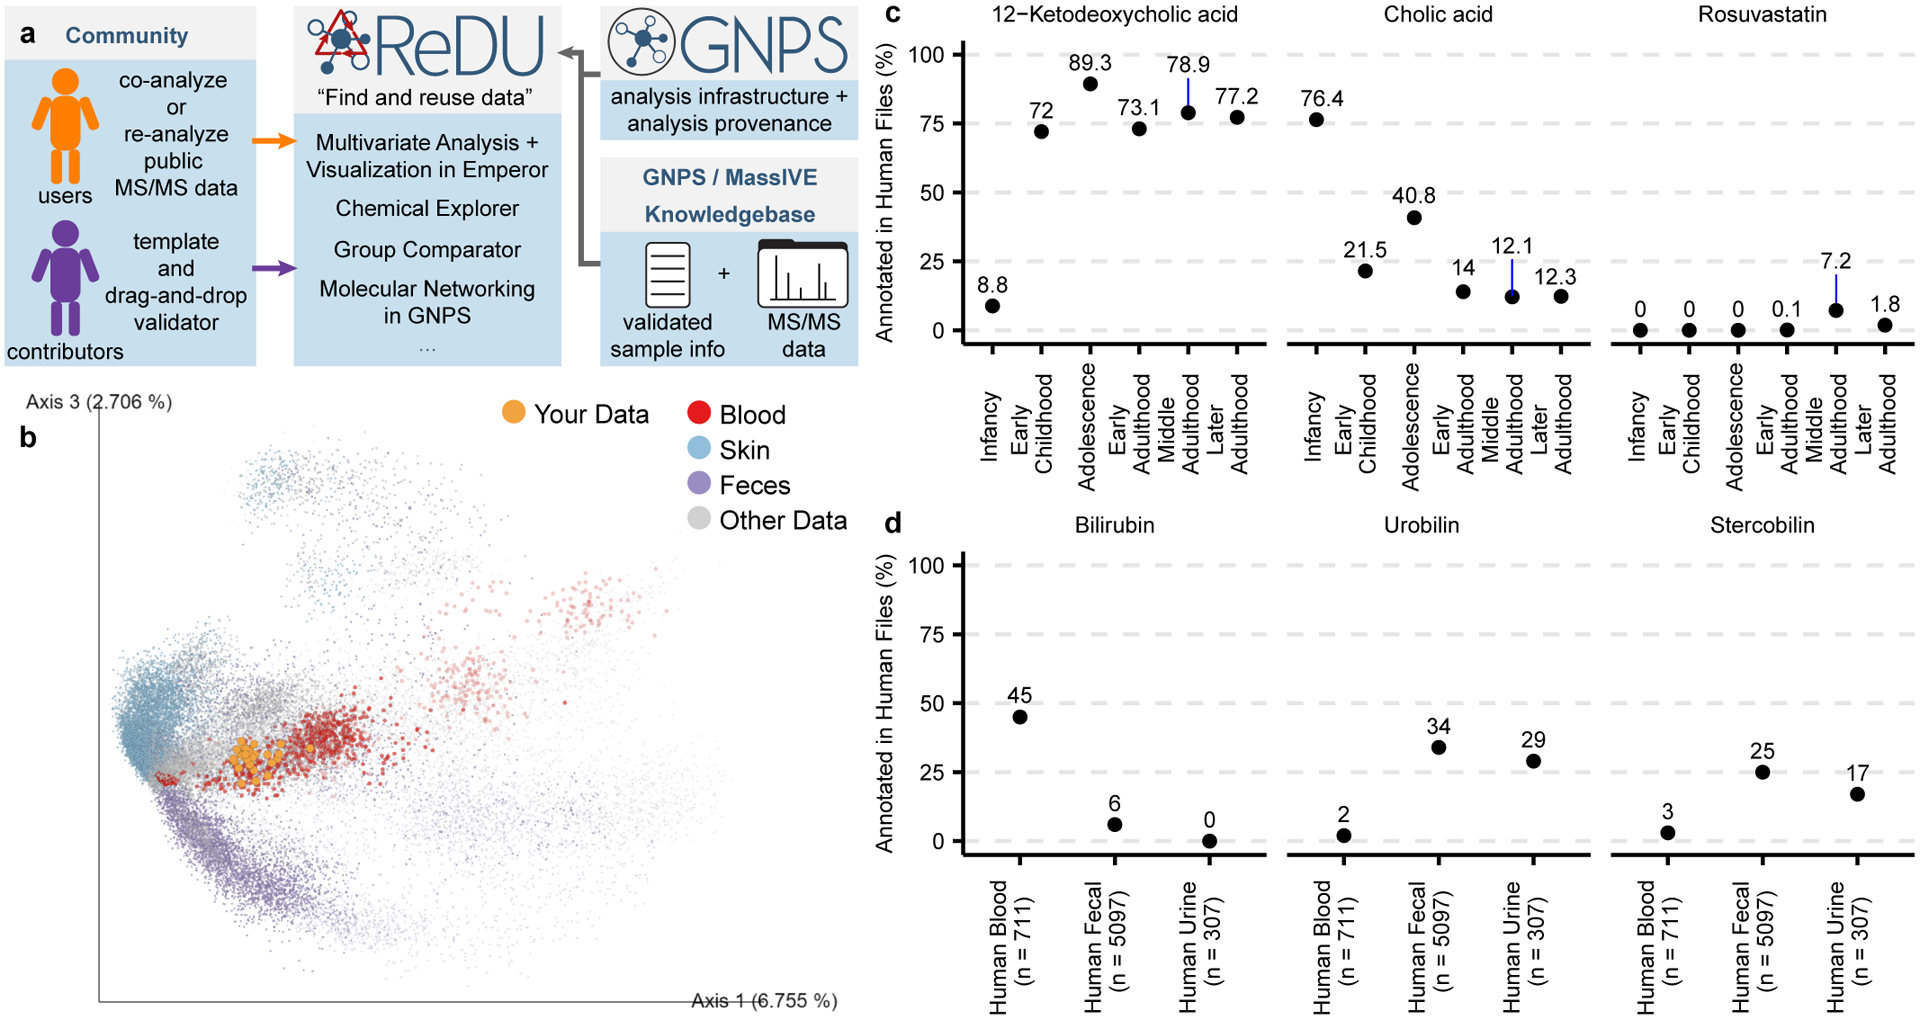
(a) ReDU provides users the tools to find public data in the GNPS/MassIVE knowledgebase, explore public data analyses in ReDU, and enable repository-scale co- and re-analyses in GNPS. Contributors are provided a template for sample information and a drag-and-drop validator. (b) 2D Emperor plot displaying the projection of human plasma samples (orange) from rheumatoid arthritis patients (not included in ReDU) onto all files (points) in ReDU colored by UBERON ontology (NCBI taxonomy-based opacity used: projected data, 1.0; 9606|Homo sapiens, 0.7; and all other data, 0.25). (c) Illustrative results from Chemical Explorer for 12-ketodeoxycholic acid, cholic acid, and rosuvastatin annotated in human fecal (n = 5,097) files over different life stages. (d) Group comparator performed on human blood (n = 711), fecal (n = 5,097), and urine (n = 307) samples resulted in different chemical compositions as illustrated by bilirubin, urobilin, and stercobilin.
The uniformity of information in ReDU enables metadata-based and repository-scale analyses, including repository scale principal component analysis (PCA) based on the annotations of each file. Fig. 1b, the chemical similarity of files in ReDU, based on MS/MS annotations, are plotted in Emperor,9 an interactive visualization tool, onto which new samples can be projected using a GNPS taskID. Another tool that ReDU enables is Chemical Explorer. Chemical Explorer enables selection of a molecule and retrieval of its associations with the metadata, i.e. sample information association. For instance, querying 12-ketodeoxycholic acid (filtering to include human feces) revealed it was observed after infancy (Fig. 1c), whereas cholic acid displayed the opposite trend. This observation is attributed to the developing gut microbiome which converts primary bile acids into secondary bile acids and that early in life the microbes that do such conversions are not present.10,11 Similarly, rosuvastatin was found in adults matching prescription demographics in the 2015–2016 US National Health and Nutrition Examination Survey.
Group Comparator compares user-selected groups (selected using metadata), tabulates the annotation information, and subsequent user interpretation can determine which chemicals are similar or different between groups, e.g. human blood, feces, and urine (Fig. 1d) or Staphylococcus aureus, Bacillus subtilis, and Streptomyces cultures (Extended Data Fig. 2). Selection and Group Comparator analysis of 6,115 human blood, fecal, and urine samples indicated differences in the percentage of files in which bile pigments were observed. Bilirubin was more frequently annotated in blood, and urobilin and stercobilin were most often annotated in feces. Similarly, comparison of MS data from bacterial cultures revealed differences in annotation of pyroglutamylisoleucyllysine (PyroGlu-Ile), staurosporine, and surfactin-C14. While the rationale for the increased percentage of PyroGlu-Ile in S. aureus is unknown, staurosporine is a known secondary metabolite produced by Streptomyces12 as well as surfactin-C14 is a known secondary metabolite produced by B. subtilis.13
ReDU can be used to select files using metadata and launch repository-scale molecular networking. Fig. 2a displays the result of repository-scale selection and molecular networking (and MolNetEnhancer in Extended Data Fig. 3)14 of human blood, urine, and fecal samples. 6,663 nodes in the molecular network (created from 399,826 MS/MS spectra) were annotated (Fig 2b) via spectral library matching (level 2 or 38). While the annotation percentage was relatively low, 7.58% of nodes, molecular networking links chemicals with similar MS/MS patterns. As MS/MS patterns are often coupled to chemical structure, one can propagate annotations via analogy in combination with mass differences, exact mass, and manual interpretation of the MS/MS spectra. Simply put, repository-scale molecular networking improves the ability to annotate unknown chemical analogs across different datasets or sample types. For example, clindamycin analogs (2–9) are proposed by propagation (e.g. delta m/z and MS/MS spectral interpretation), some matching reported metabolites such as clindamycin sulfoxide (4),15 from the annotation of clindamycin (1). The clindamycin analogs (2–9) were linked to clindamycin (1) across human urine, blood, and fecal data originating from different datasets, Fig 2c and Supplementary Information.
Fig 2. Repository-scale Molecular Networking of Public Data in ReDU.
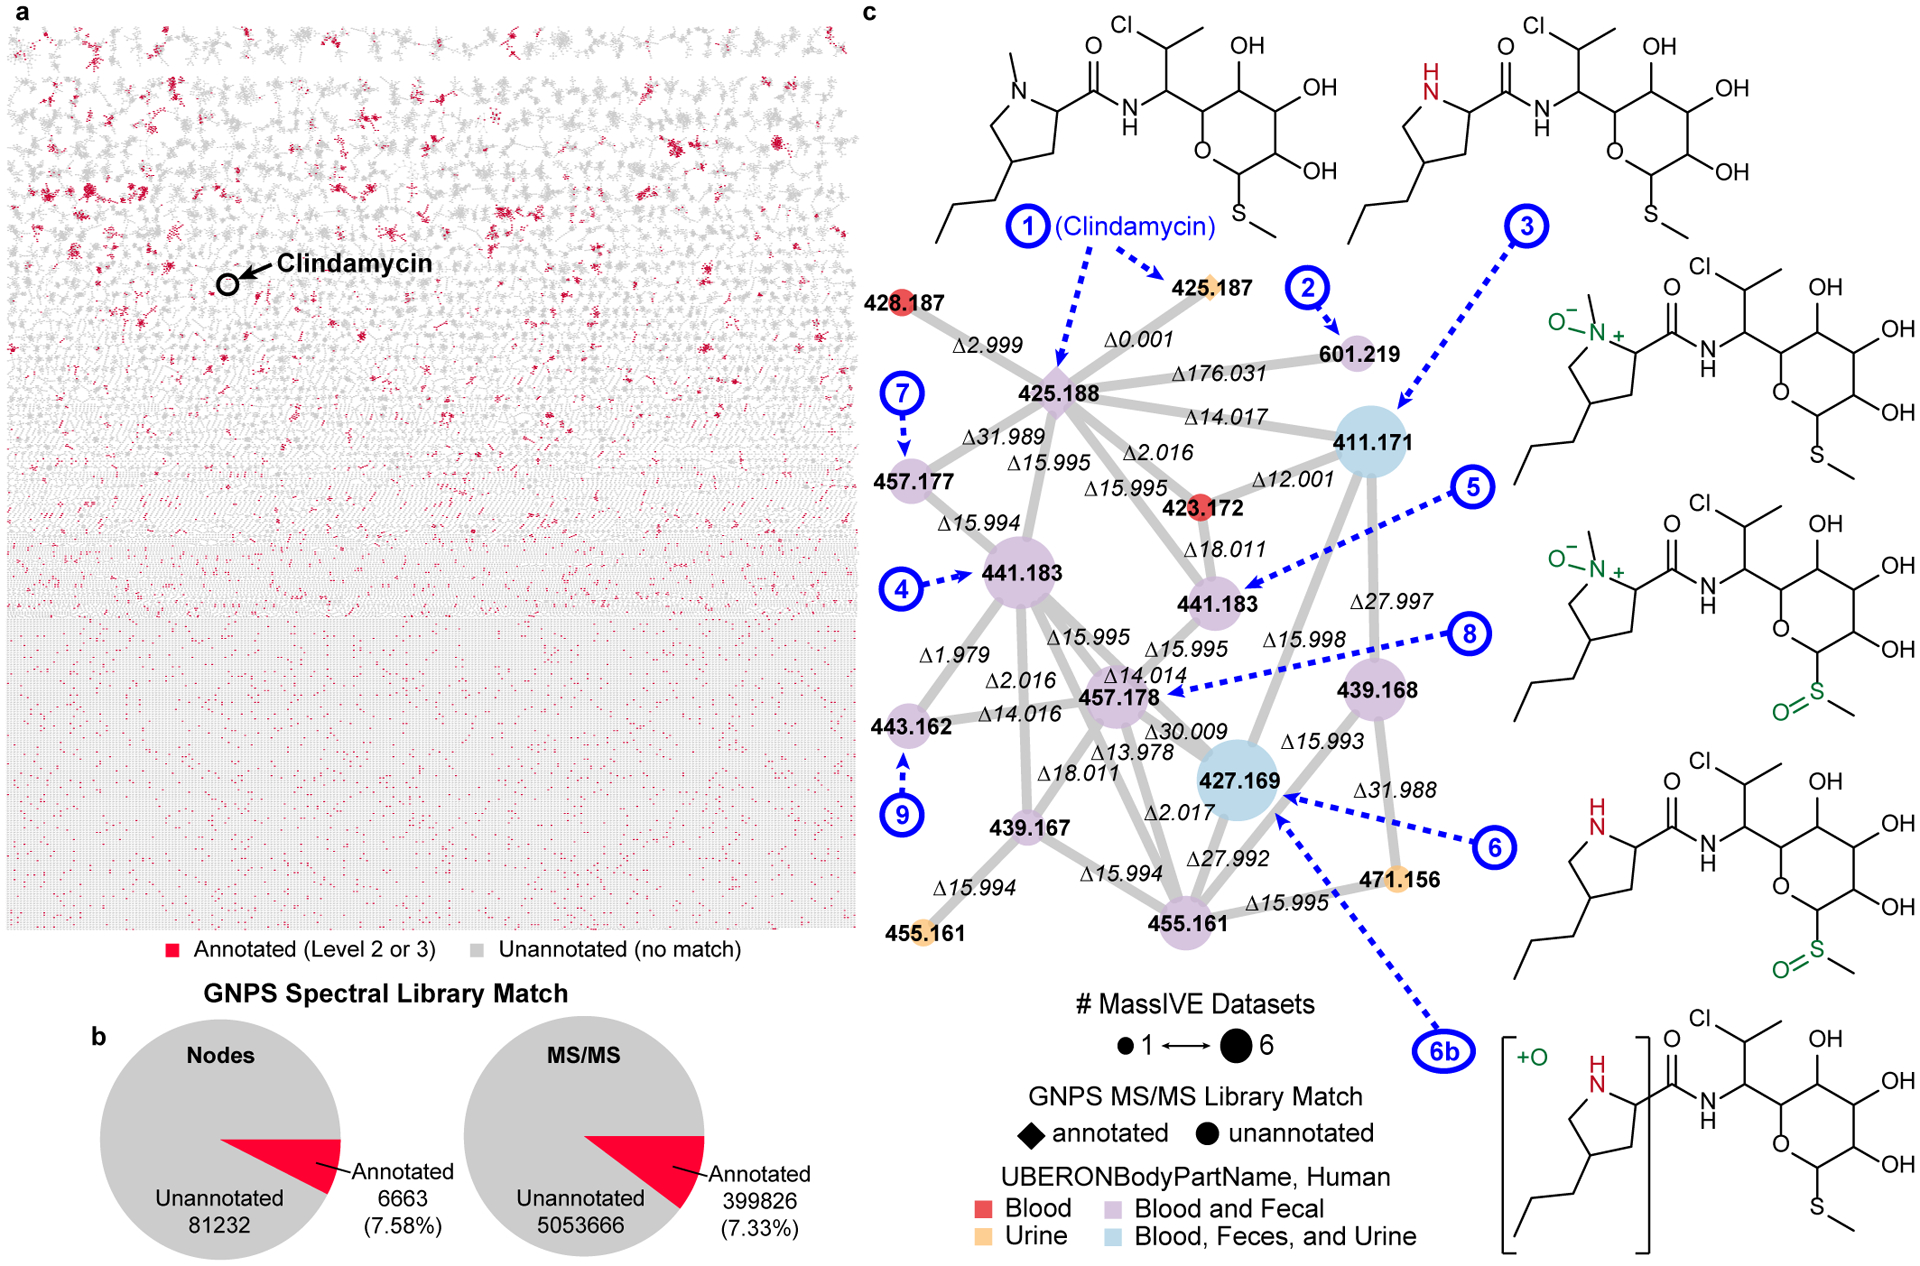
(a) Molecular network of human blood (n = 711), fecal (n = 5,097), and urine (n = 307) in ReDU with nodes colored by annotation status, annotated (red) or unannotated (grey). (b) Summary of MS/MS library matching results (level 2 or 3) are displayed for the nodes in the network and all MS/MS spectra considered in the molecular network. (c) A portion of the repository-scale molecular networking containing clindamycin. Nodes are colored by the sample type. Node size reflects the number of MassIVE datasets. Node shape annotation status (annotated, diamond or unannotated, circle). Putatively annotated clindamycin analogs (2–9), based on MS/MS interpretation, are indicated using dashed arrows and numbers, blue, corresponding to the proposed structures.
Lastly, all data in ReDU, including the metadata and annotation information, are available for download from the homepage. The annotation information was used for molecular cartography16 at the repository-scale, which was used to plot the location of drugs in human samples (Extended Data Fig. 4 and Supplementary Video 1). We envision this information will be invaluable to researchers. ReDU’s utility will continue to grow as more data are uploaded to GNPS/MassIVE and as public MS/MS reference libraries expand, scaling in breadth and depth. ReDU is a resource developed for the community and strives to embody the FAIR principles.17
Methods
ReDU Content
The homepage of ReDU (https://redu.ucsd.edu/) is the launch point for different analyses, centered around “Analyze Your Data” or “Analyze Public Data”. It also links to “Documentation”, “How to Contribute Data”, “ReDU Sample Information Validator”, “Download Database”, and “File Query - Sample Information”. The “Documentation” option (Supplementary Fig. 5a) links to the ReDU documentation, and the “How to Contribute Data” option (Supplementary Fig. 5b) links to the subsection of documentation which list the steps necessary to contribute data to ReDU. The “ReDU Sample Information Validator” (Supplementary Fig. 5c) links to a drag-and-drop validator (https://redu.ucsd.edu/ReDUValidator) that verifies that the sample information template required for data contribution adheres to the required formatting and terms in a controlled vocabulary (additional terms must be submitted via GitHub - https://github.com/mwang87/ReDU-MS2-GNPS/issues). Supplementary Fig. 5d links to a text field into which a filename can be queried and any associated metadata is displayed. “Download Database” (Supplementary Fig. 5e) downloads all the sample information included in ReDU in a tab-separated text file. “Download Annotations” (Supplementary Fig. 5f) downloads all the MS/MS annotations. Links to specific analyses are detailed below. The ReDU server is built using the python flask framework, SQLite, and a Vue.js front end.
Data and Sample Information Contribution
Data files (.mzXML or .mzML) and a ReDU-validated sample information, i.e. metadata, table are necessary for inclusion of data in ReDU and must be uploaded to a public MassIVE data set. A sample information template and validator are provided. Detailed step-by-step instructions can be found in the ReDU documentation (https://mwang87.github.io/ReDU-MS2-Documentation/HowtoContribute/).
Chemical Annotations based on MS/MS Reference Library Matches
MS/MS data were reanalyzed in a consistent manner to provide chemical annotations based on spectral library matches. The search was performed on the MS/MS product ion scans in files located in MassIVE de novo (i.e. original MS/MS data and not the reported results) using GNPS’ default parameters. The resulting MS/MS spectral matches (i.e. annotations) were counted per file and tabulated; multiple hits to the same CCMSlib ID in the same file were counted once. All annotation information was downloaded from ReDU (Supplementary Fig. 5f) and processed in R. Script is available on GitHub in the examples folder (https://github.com/mwang87/ReDU-MS2-GNPS/tree/master/examples). Supplementary Table 1 displays the number of MS/MS reference library spectra available in each library in GNPS (e.g. GNPS-LIBRARY) and the total number of annotations in ReDU per library. Further information can be found here -https://proteomics2.ucsd.edu/ProteoSAFe/result.jsp?task=ba6a5b6a1c0946b3a641c67ad59fb2df&view=production_library_sizes#%7B%22table_sort_history%22%3A%22main.number_spectra_dsc%22%7D.
Principal Component Analysis
Principal component analysis (PCA) was performed on the counts of each chemical annotation from GNPS spectral library matching using GNPS’ default parameters (https://mwang87.github.io/ReDU-MS2-Documentation/). PCA was performed in python with scikit-learn. The eigenvector matrix was retained and used to calculate the location of the projected points.
Explore Multivariate Analysis of Public Data
Emperor (https://github.com/biocore/emperor) was used to generate the interactive visualizations using the results from PCA, Supplementary Fig. 5g. Emperor has many plotting options (including the axes and the color of points based on sample information), filtering options, and can rescale data. Clicking on any of the points in the plot results in the filename being displayed in the bottom-left corner. The plot can be saved as an image file. Additional instructions on Emperor can be found in its online documentation (http://emperor.microbio.me/uno/).
Compare Your Data to Public Data via Multivariate Analysis
Users can co-analyze their data via projection onto an Emperor plot of all data in ReDU (Supplementary Fig. 5h, Fig. 1b). Users submit their data by providing a GNPS taskID into the field. GNPS library search, GNPS molecular networking, and GNPS feature-based molecular networking are compatible. It is encouraged that default library search parameters be used. The taskID provides the information required to calculate the coordinates for the projection of samples onto the precalculated PCA plot (visualized using Emperor) of all ReDU data. Projection was performed by multiplying the annotations for each file (vector) by the eigenvectors in order to calculate the location of data points in the precalculated coordinate frame. The user can highlight their data using the “Your Data” term in the “type” category; we suggest using this column to change the scale or opacity of the sample points to visualize your data.
Example – Fig. 1b
Human plasma samples not yet entered in ReDU at the time of data analysis were subjected to a GNPS library search using default parameters; the data and illustrative library search can be accessed using the following link (https://gnps.ucsd.edu/ProteoSAFe/status.jsp?task=f39c94cb7afe4568950bf61cdb8fee0d). The taskID was entered using the “Compare Your Data to Public Data via Multivariate Analysis” option (https://mwang87.github.io/ReDU-MS2-Documentation/) resulting in the Emperor plot. The example button will populate the field with the taskID used to generate the figure. The following settings were used to create the image. Points were scaled using the UBERONBodyPartName category and globally scaled to 1.3 with the exception of blood, blood plasma, blood serum which were scaled to 2.5 and the projected data scaled to 5 (nan). The opacity was set to 0.25 globally using the NCBITaxonomy column, and the values for the projected data were set to 1 (nan) and all 9606|Homo sapiens data set to 0.7. Points were colored based on UBERONBodyPartName. All points were set to grey (#d1d1d1) except skin samples (blue, #91bfdb), blood samples (red, #d73027), feces (purple, #998ec3), and the projected data (orange, #f1a340). A .json file (settings file) has been provided in GitHub (https://github.com/mwang87/ReDU-MS2-GNPS/tree/master/examples) to reproduce the plot by uploading it in the “load saved settings” option. This example is only intended to illustrate that blood samples cluster closely with other blood samples already in the ReDU database. Note, periodic updates to the ReDU database will shift the appearance of the data over time. The code and materials needed to recreate this analysis and plots are available on GitHub (https://github.com/mwang87/ReDU-MS2-GNPS/tree/master/examples).
Chemical Explorer
The Chemical Explorer can be accessed on the ReDU homepage (Supplementary Fig. 5i). The chemical annotations resulting from library search, described above, were used to populate the Chemical Explorer table (https://mwang87.github.io/ReDU-MS2-Documentation/). A search box is provided for queries. Note, the chemical name that appears reflects that which is entered in the spectral references databases (Supplementary Table 2) included in GNPS and is case sensitive. The sample information associated with a particular chemical can be accessed by clicking the “View Association” button as well as a list of files in which the chemical was found by clicking the “View Files” button. The sample information is tabulated for the selected chemical and ranked based on the proportion of files associated with a sample information term. The Chemical Explorer can also be used on a subset of data, selected using the ReDU file selector (Supplementary Fig. 5j–5k) and launched by hitting the “Launch Chemical Explorer” under the “Analyze Public Data” section. Note, only files placed into group 1 (G1) are considered in the calculation of the associated sample information.
Example – Figure 1c
The file selector was used to filter only human files (NCBItaxonomy = 9606|Homo sapiens), fecal samples were filtered using UBERONbodypartname, and samples were selected into G1 based on Lifestage (not applicable, not collected, and not specified samples were excluded). Chemical Explorer was launched. The resulting webpage was searched using the search box for illustrative examples, specifically “Spectral Match to 12-Ketodeoxycholic acid from NIST14”, “Cholic acid”, and “Stercobilin”. The view associations button was clicked for each. The table can be downloaded using the download button. In this manuscript, the resulting table displayed on the ReDU website was copied and pasted into Excel (Microsoft). All associations were tabulated in a single spreadsheet, and an additional column indicating the chemical was added. The data file was saved as a tab delimited text file and imported into R for plotting. The x-axis corresponds to the following lifestages: Infancy (<2 yrs), n=1859; Early Childhood (2 yrs < × ≤ 8 yrs), n=93; Adolescence (8 yrs < × ≤ 18 yrs), n=169; Early Adulthood (18 yrs < × ≤ 45 yrs), n=995; Middle Adulthood (45 yrs < × ≤ 65 yrs), n=933; and Later Adulthood (> 65 yrs), n=325. The code and materials needed to recreate this analysis and plots are available on GitHub (https://github.com/mwang87/ReDU-MS2-GNPS/tree/master/examples).
Group Comparator
Users can compare the occurrence of chemical annotations between two or more groups populated in the file selector by clicking the “Launch Group Comparator” button after data selection (https://mwang87.github.io/ReDU-MS2-Documentation/) in the ReDU file selector (Supplementary Fig. 5j-5k). GNPS chemical annotations are tabulated with the number of files in which they are found (and the percentage of files) in each group (G1-G6). This information is precalculated from library search (same information used for PCA and Chemical Explorer) using default library search parameters.
Example – Figure 1d
The file selector was used to filter only human files (NCBItaxonomy = 9606|Homo sapiens). Blood plasma (n = 678) and blood serum (n = 33) files were selected into G1 (considered together as blood), fecal (n = 5,097) files were selected into G2, and urine files (n = 307) were selected into G3. Group Comparator produced a tabulation of chemicals and corresponding counts (i.e. number of times annotated) in each group. The table (.csv) was downloaded using the download button. The data file was imported into R for plotting. The code and materials needed to recreate this analysis and plots are available on GitHub (https://github.com/mwang87/ReDU-MS2-GNPS/tree/master/examples).
Example – Extended Data Fig. 2
The file selector was used to filter only bacterial cultures (SampleType = culture_bacterial). 1423|Bacillus subtilis (n=89) files were selected into G1, 1280|Staphylococcus aureus (n=49) files were selected into G2, and 1883|Streptomyces (n=7) files were selected into G3. The NCBITaxonomy metadata category was used for file selection. Group Comparator was launched. Surfactin-C14 (IUPAC ID: 3-[(3R,6S,9R,12R,15S,18R,21R,25S)-9-(carboxymethyl)-25-(9-methyldecyl)-3,6,15,18-tetrakis(2-methylpropyl)-2,5,8,11,14,17,20,23-octaoxo-12-propan-2-yl-1-oxa-4,7,10,13,16,19,22-heptazacyclopentacos-21-yl]propanoic acid and CCMS identifier: CCMSLIB00000478649), pyroGlu-Ile, and staurosporine were plotted as examples. The table (.csv) was downloaded using the download button and imported into R for plotting. The code and materials needed to recreate this analysis and plots are available on GitHub (https://github.com/mwang87/ReDU-MS2-GNPS/tree/master/examples).
Repository-scale Molecular Networking and Library Search
Users can re-analyze with public data by clicking the “Reanalyze Public Data at GNPS” text (Supplementary Fig. 5j), which links to the ReDU file selector, https://mwang87.github.io/ReDU-MS2-Documentation/.The ReDU file selector allows one to select (and filter) files based on the sample information and place multiple types of files into one of 6 different groups (i.e. G1-G6) for molecular networking via GNPS. Library search without molecular networking, providing annotations only, can be formed via GNPS; however, all files should be placed in G1 as groups are not supported. Upon completion of data selection, the user can launch the “Re-analyze with GNPS Molecular Networking” or “Re-analyze with GNPS library search” buttons which populate the GNPS molecular networking or GNPS library search launch page, respectively. The suggested parameters for molecular networking and library search are detailed in the GNPS documentation (https://ccms-ucsd.github.io/GNPSDocumentation/). A maximum of 5000 files for molecular networking is suggested. Note, a free account on GNPS is required and you must be logged in before attempting to launch re-analyses in GNPS.
Example – Fig. 2
Molecular networking was performed in GNPS after selecting human blood plasma and serum (n=711), human urine (n=307), and human fecal (n=5,097) files in the ReDU file selector (https://gnps.ucsd.edu/ProteoSAFe/status.jsp?task=a75aa494e927481dae6de12608e5e4a0). The data were filtered by removing all MS/MS peaks within ± m/z 17 of the precursor m/z. MS/MS spectra were window filtered by choosing only the top 6 peaks in the ± m/z 50 window throughout the spectrum. The data was then clustered with MS-Cluster with a precursor m/z tolerance of 0.02 and a MS/MS fragment ion (i.e. product ion) m/z tolerance of 0.02 to create consensus spectra. Further, consensus spectra that contained less than 5 spectra were discarded. A network was then created where edges were filtered to have a cosine score above 0.7 and more than 5 matched peaks. Further edges between two nodes were kept in the network if and only if each of the nodes appeared in each other’s respective top 10 most similar nodes. The spectra in the network were then searched against GNPS’ spectral libraries. The library spectra were filtered in the same manner as the input data. All matches kept between network spectra and library spectra were required to have a score above 0.7 and at least 5 matched peaks. The network was opened in Cytoscape (3.7.1), cytoscape.org,18 and the networks were output as a .pdf and assembled in Adobe Illustrator. The molecular networking component associated with clindamycin was analyzed using the in-browser network visualization (https://gnps.ucsd.edu/ProteoSAFe/result.jsp?view=network_displayer&componentindex=2892&task=a75aa494e927481dae6de12608e5e4a0#%7B%7D. Universal spectrum identifiers were generated, Supplementary Table 1, and used to plot the spectra displayed in Supplementary Fig. 2 and Fig. 4. MoleNetEnhancer4 was launched from the results page of the molecular networking job (https://gnps.ucsd.edu/ProteoSAFe/status.jsp?task=5ce4c3be9f5a4adfa1c50c9e99c4aeaft), Extended Data Fig. 3. Upon completion, the molecular network was downloaded and opened in Cytoscape. The code and materials needed to recreate this analysis and plots are available on GitHub (https://github.com/mwang87/ReDU-MS2-GNPS/tree/master/examples).
Co-analyze Your Data with Public Data using Molecular Networking
Users can co-analyze their data with public data by clicking the “Co-analyze Your Data with Public Data at GNPS” text, which links to the ReDU file selector (Supplementary Fig. 5k). Once the user has selected the public files they wish to include, a click of the “Co-analyze with GNPS Molecular Networking” or “Co-analyze with GNPS library search” button will load the public files into a GNPS molecular networking or GNPS library search launch page, respectively, at which point the user can add their own files to the appropriate group and submit the job. Details on molecular networking and library search can be found in the GNPS documentation (https://ccms-ucsd.github.io/GNPSDocumentation/). A maximum of 5000 files for molecular networking is suggested. Note, a free account on GNPS is required and you must be logged in before attempting to launch re-analyses in GNPS. If greater than 5000 files are to be co-networked, then we suggest contacting the authors as more computing compute resources will need to be allocated.
Illustrative Use of the ReDU Database: Molecular Cartography
Example – Extended Data Fig. 1
The ReDU information (MSV000084206) was downloaded and the latitudinal and longitudinal data were cleaned of any non-adherent formatting. The number of unique files associated with each latitude and longitude coordinate was calculated as well as the number of chemical annotations. The sum of the chemical annotations per latitude and longitude coordinate was divided by the number of unique files associated with the coordinates. Files lacking coordinates were removed. The values were log10 scaled to aid in visualization. The data were plotted in R (“ggmap” and “map” packages were used) onto a world map. The code and materials needed to recreate this analysis and plots are available on GitHub (https://github.com/mwang87/ReDU-MS2-GNPS/tree/master/examples).
Example – Extended Data Fig. 4
The ReDU information (MSV000084206) was downloaded and merged with the sample information database. A list of curated tags was generated from the curated source information table (provided). The files associated with humans were included and the chemical annotations associated with drugs or drug metabolites, putatively, were included. The number of chemical annotations per UBERON body part were divided by the number of files included for each body part. An image of an androgynous human was created in Illustrator (Adobe) and saved as a .png. The pixel coordinates associated with each label were tabulated by UBERON ontology name and merged with the ReDU drug table. The resulting file was exported as a .csv for use in ‘ili. Files and a .json file that will reproduce the illustrative example in the manuscript are available on GitHub (https://github.com/mwang87/ReDU-MS2-GNPS/tree/master/examples). The results were compiled into a video (https://www.youtube.com/watch?v=dzAqjBNmqPU&feature=youtu.be).
Data Availability
All curated sample information can be downloaded from the ReDU homepage (https://redu.ucsd.edu/) by selecting “Download Database.” The current version of the ReDU information is archived in the GNPS/MassIVE (gnps.ucsd.edu) repository. The accession number is MSV000084206.
Code Availability
All code for ReDU is available in GitHub (https://github.com/mwang87/ReDU-MS2-GNPS) with corresponding documentation (https://github.com/mwang87/ReDU-MS2-Documentation).
Extended Data
Extended Data Fig. 1. Repository-scale molecular cartography enabled by ReDU.
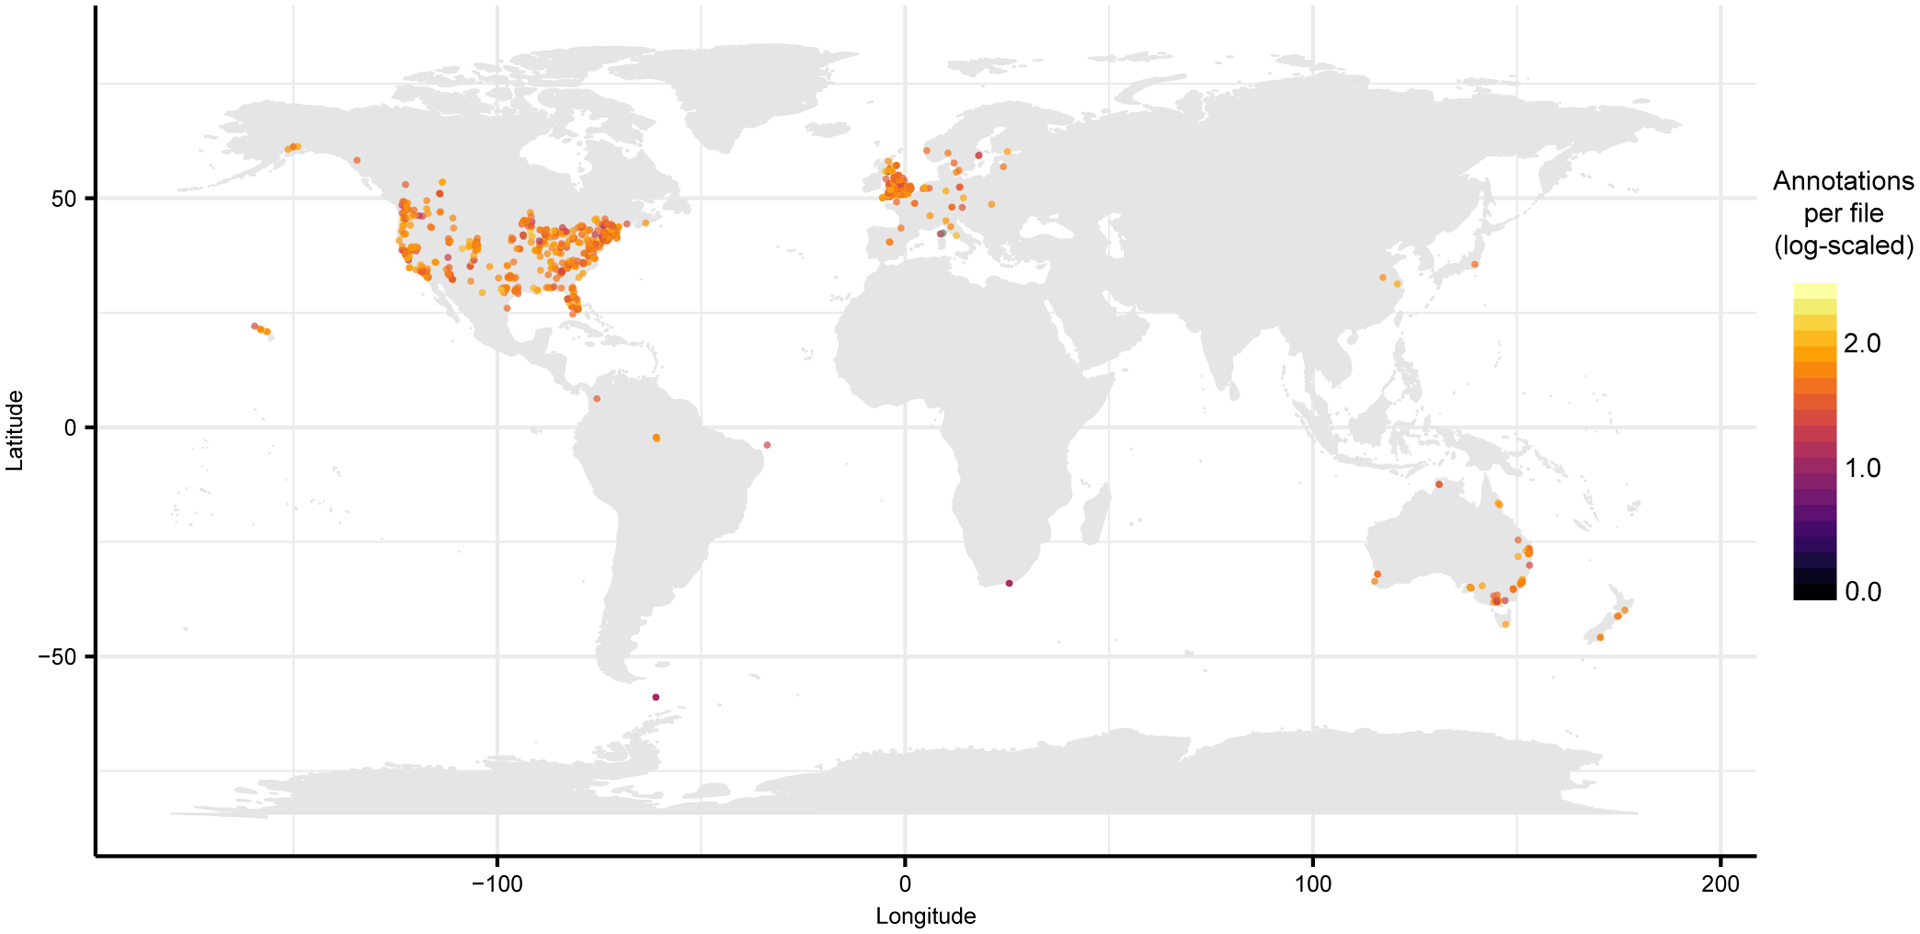
ReDU samples with latitude and longitude information, n = 34,003, were grouped by latitude and longitude (n = 2068 different locations) and plotted colored by number of annotations per file (log10 scaled).
Extended Data Fig. 2. Comparison of bacterial cultures using Group Comparator in ReDU.
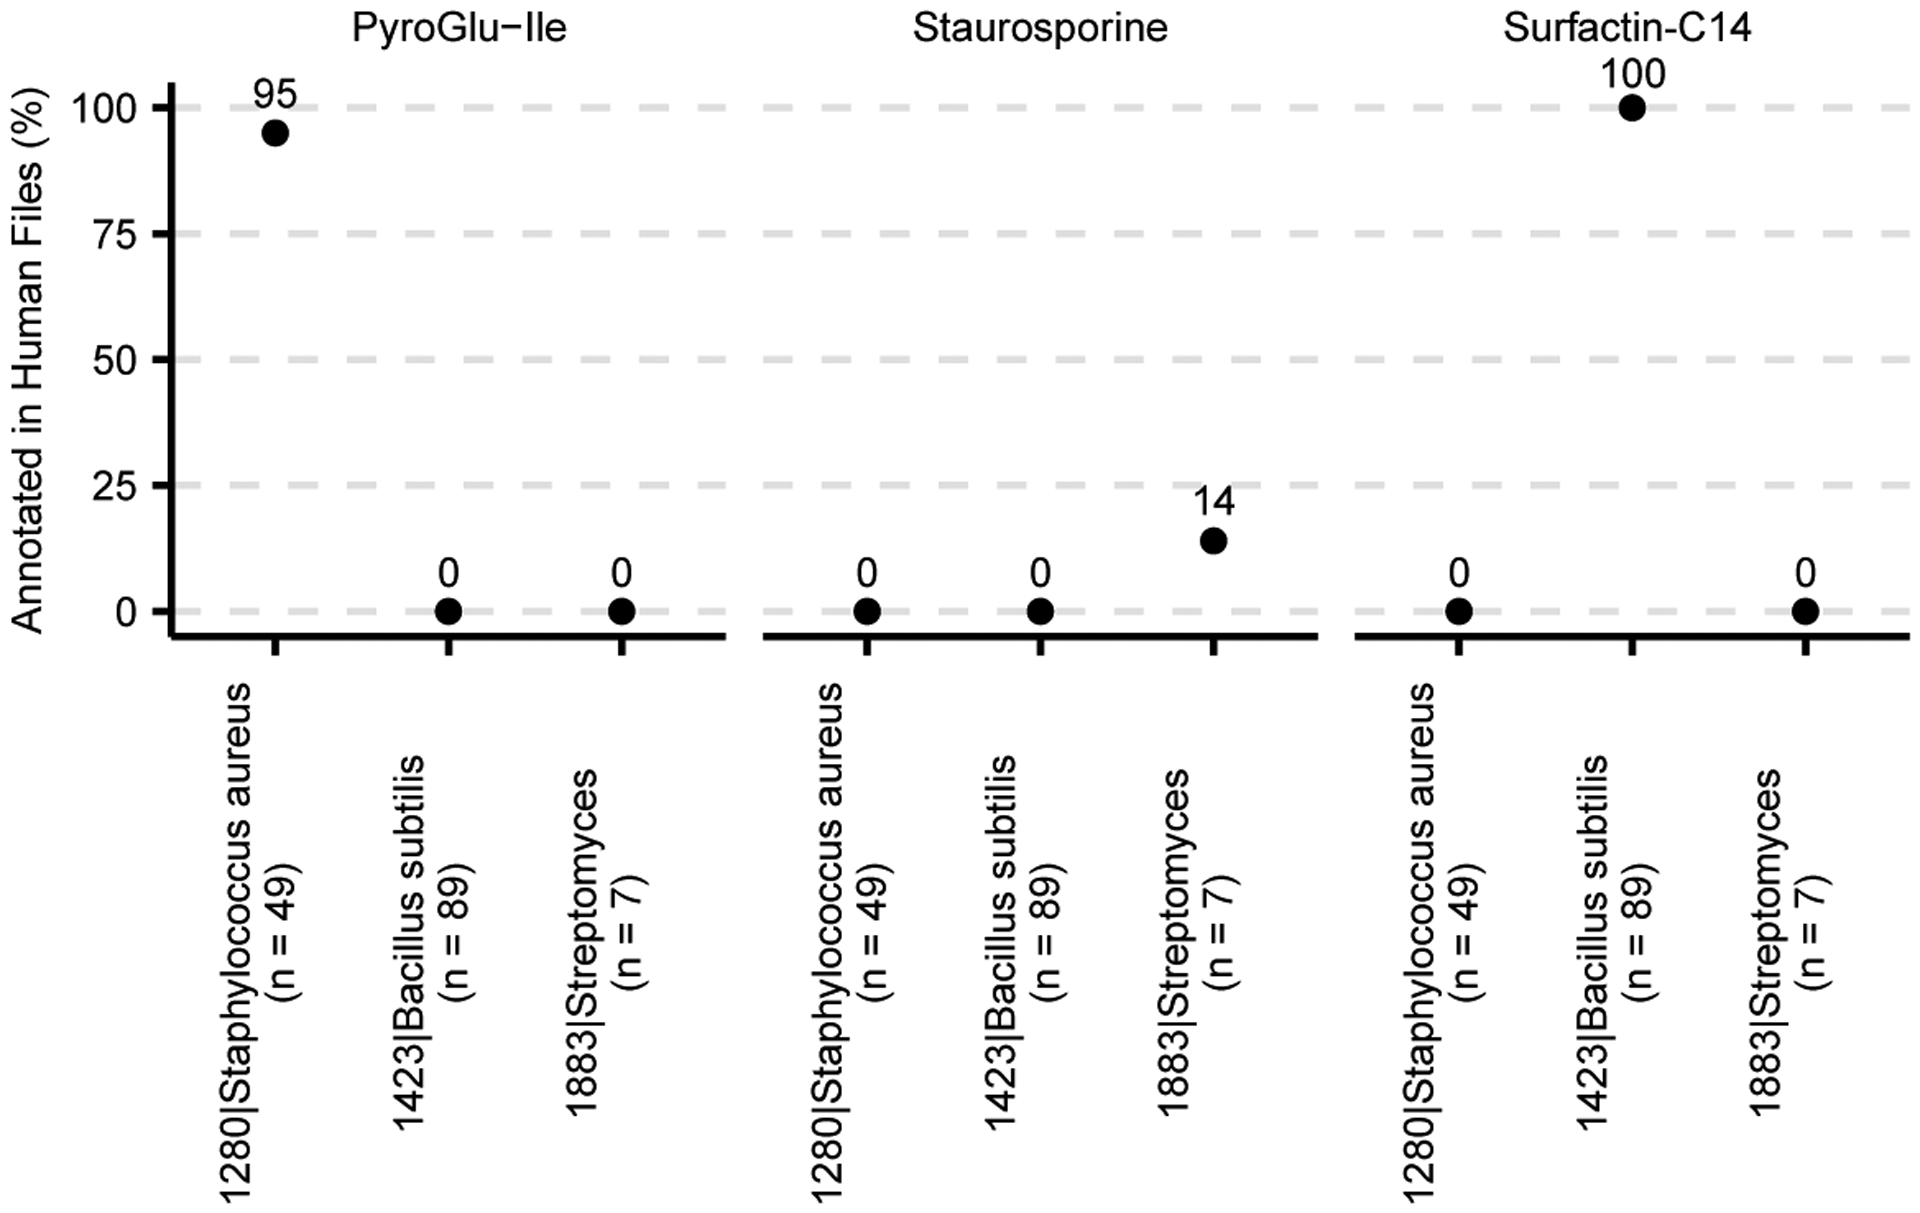
Bacterial cultures of 1280|Staphylococcus aureus (n = 49), 1423|Bacillus subtilis (n = 89), and 1883|Streptomyces (n = 7) were compared and chemical differences are illustrated by pyroGlu-Ile, staurosporine, and surfactin-C14.
Extended Data Fig 3. Repository-scale molecular networking of human blood (n = 711), fecal (n = 5,097), and urine (n = 307) supplemented by MolNetEnhancer.
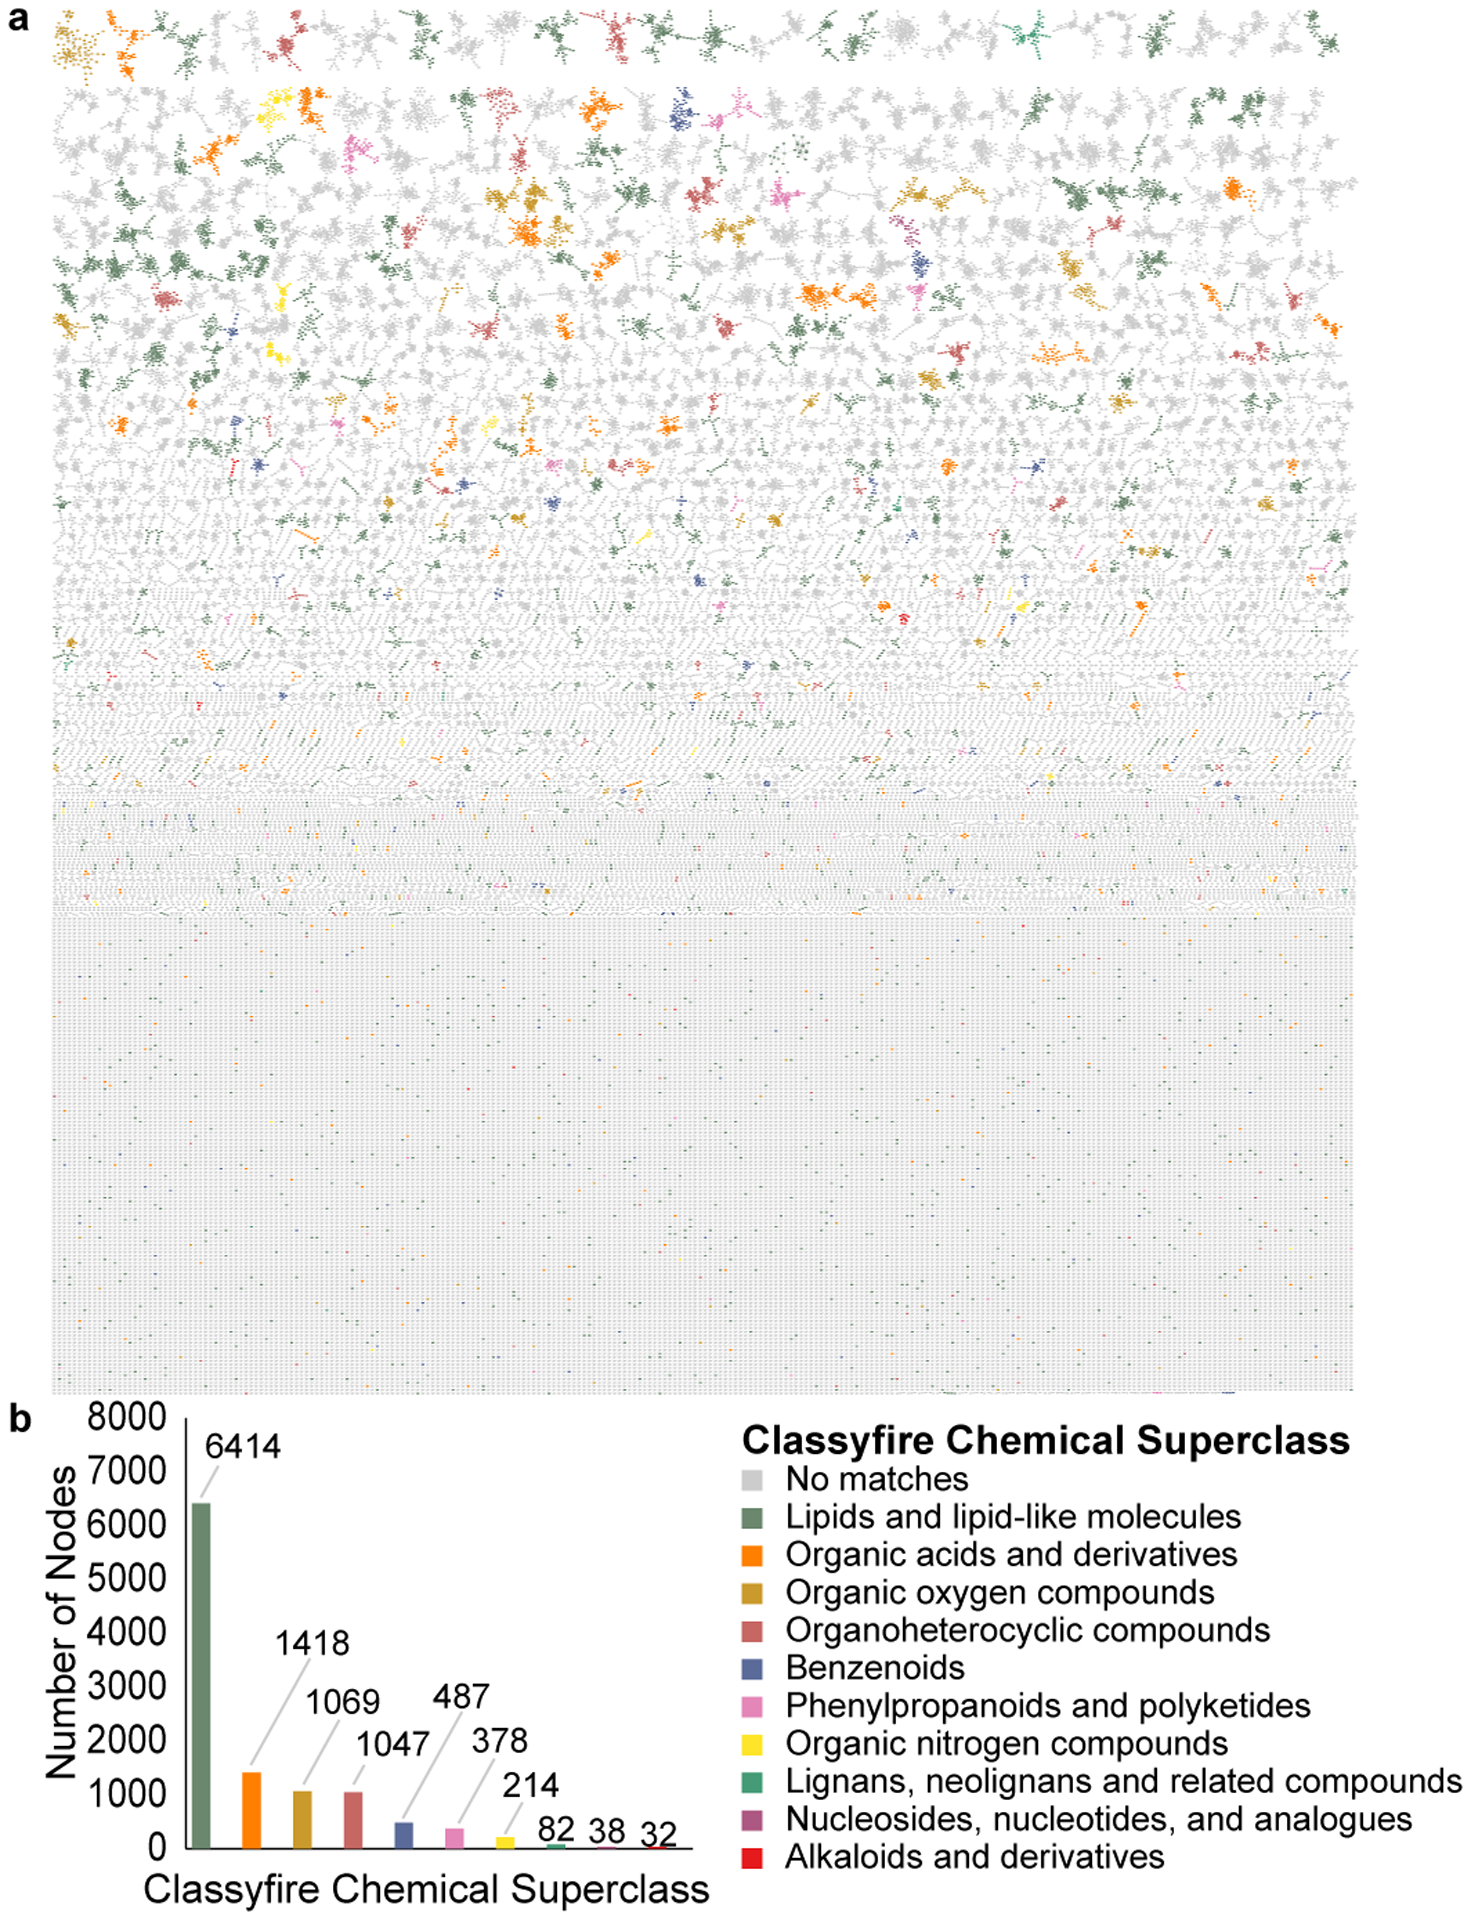
(a) MolNetEnhancer enhanced molecular network in which components are colored based on Classyfire chemical class prediction. (b) Number of nodes per Classyfire chemical class prediction. Nodes without a match in Classyfire are not displayed.
Extended Data Fig 4. Molecular cartography of the distribution of drugs on the human body visualized using ili.
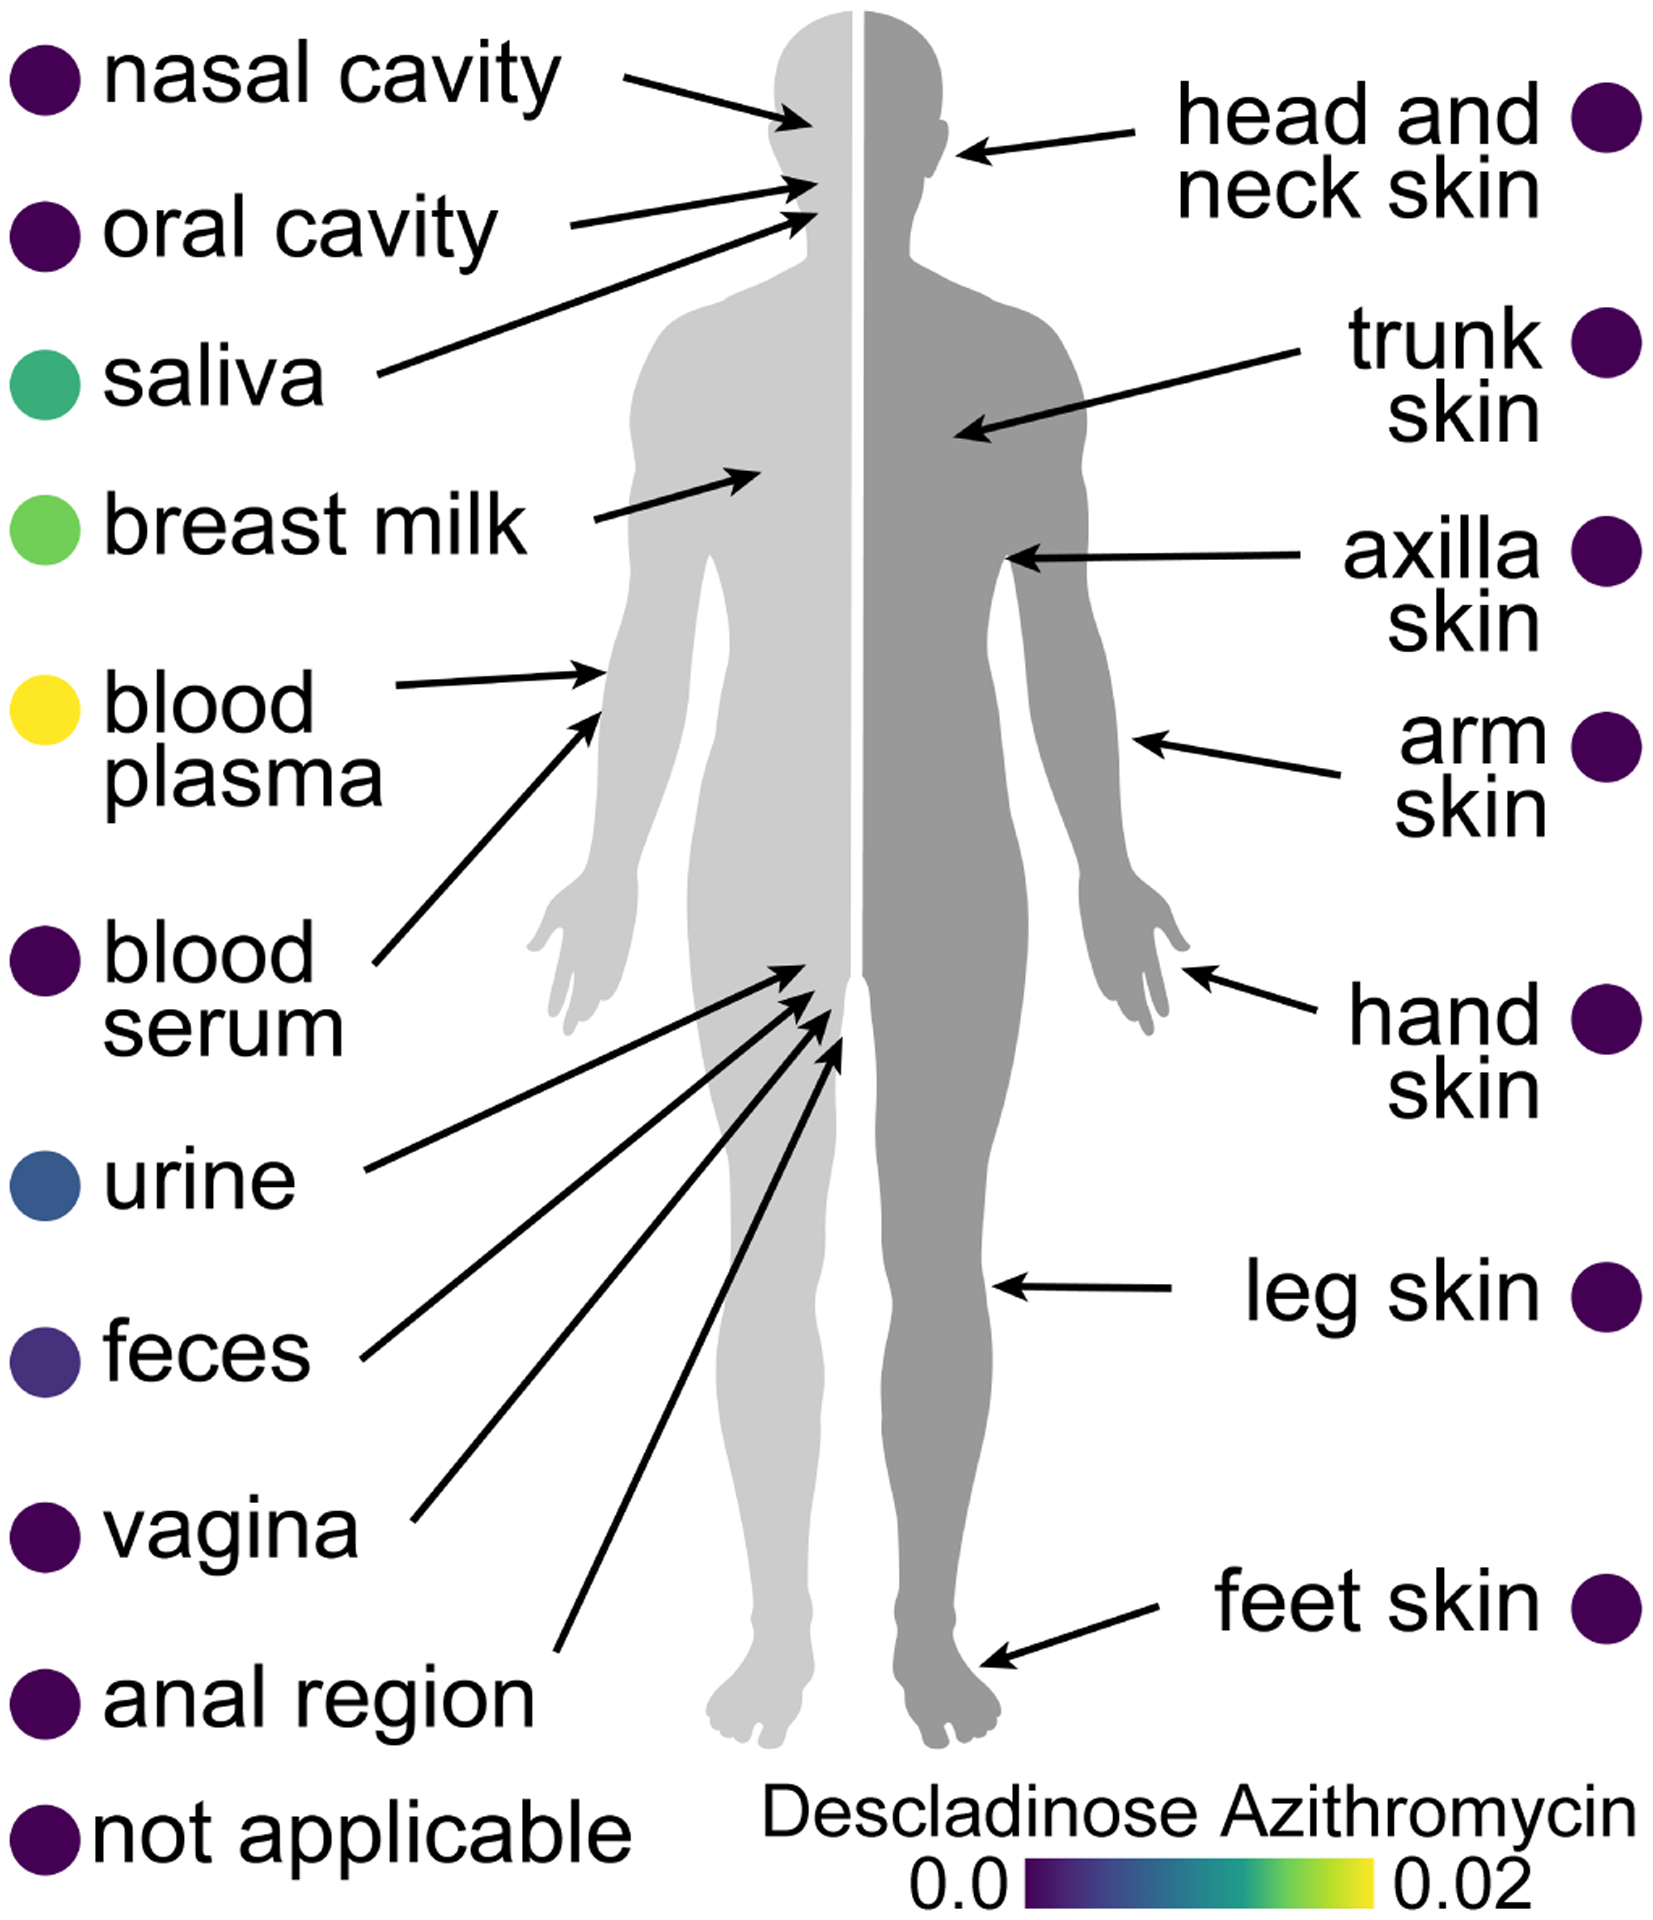
Descaladinose azithromycin, a drug metabolite of azithromycin, distribution in human (n = 17,117; normalized by the number of files per sample).
Supplementary Material
Acknowledgments
The authors would like to thank the individuals involved in the funding, administration, sample collection, and data acquisition of the public data used in ReDU. The authors recognize the financial support of the U.S. National Institutes of Health (P41 GM103484, R03 CA211211, and R01 GM107550), Sloan Foundation (RK), Gordon and Betty Moore Foundation (PD, NB, KLM), FAPESP fellowship (2018/24865-4), American Society for Mass Spectrometry (AKJ), NSF grant IOS-1656481 (PCD and AMCR), Netherlands eScience Center No. ASDI.2017.030 (JJJvdH), Krupp Endowed Fund (RC), US Office of Naval Research (N00014-15-1-2809) and the University of California, San Diego Center for Microbiome Innovation SEED grants.
References
- 1.Wang M et al. Sharing and community curation of mass spectrometry data with Global Natural Products Social Molecular Networking. Nat. Biotechnol 34, 828–837 (2016). [DOI] [PMC free article] [PubMed] [Google Scholar]
- 2.Haug K et al. MetaboLights: a resource evolving in response to the needs of its scientific community. Nucleic Acids Res. 48, D440–D444 (2020). [DOI] [PMC free article] [PubMed] [Google Scholar]
- 3.Sud M et al. Metabolomics Workbench: An international repository for metabolomics data and metadata, metabolite standards, protocols, tutorials and training, and analysis tools. Nucleic Acids Res. 44, D463–D470 (2016). [DOI] [PMC free article] [PubMed] [Google Scholar]
- 4.Federhen S The NCBI Taxonomy database. Nucleic Acids Res. 40, D136–D143 (2012). [DOI] [PMC free article] [PubMed] [Google Scholar]
- 5.Mungall CJ, Torniai C, Gkoutos GV, Lewis SE & Haendel MA Uberon, an integrative multi-species anatomy ontology. Genome Biol. 13, R5 (2012). [DOI] [PMC free article] [PubMed] [Google Scholar]
- 6.Schriml LM & Mitraka E The Disease Ontology: fostering interoperability between biological and clinical human disease-related data. Mammalian Genome 26, 584–589 (2015). [DOI] [PMC free article] [PubMed] [Google Scholar]
- 7.Scheubert K et al. Significance estimation for large scale metabolomics annotations by spectral matching. Nat. Commun 8, 1494 (2017). [DOI] [PMC free article] [PubMed] [Google Scholar]
- 8.Sumner LW et al. Proposed minimum reporting standards for chemical analysis: Chemical Analysis Working Group (CAWG) Metabolomics Standards Initiative (MSI). Metabolomics 3, 211–221 (2007). [DOI] [PMC free article] [PubMed] [Google Scholar]
- 9.Vázquez-Baeza Y, Pirrung M, Gonzalez A & Knight R EMPeror: a tool for visualizing high-throughput microbial community data. Gigascience 2, 1–4 (2013). [DOI] [PMC free article] [PubMed] [Google Scholar]
- 10.Hammons JL, Jordan WE, Stewart RL, Taulbee JD & Berg RW Age and diet effects on fecal bile acids in infants. J. Pediatr. Gastroenterol. Nutr 7, 30–38 (1988). [DOI] [PubMed] [Google Scholar]
- 11.Robertson RC, Manges AR, Finlay BB & Prendergast AJ The Human Microbiome and Child Growth – First 1000 Days and Beyond. Trends in Microbiology 27, 131–147 (2019). [DOI] [PubMed] [Google Scholar]
- 12.Omura S et al. A New Alkaloid Am-2282 Of Streptomyces Origin Taxonomy, Fermentation, Isolation And Preliminary Characterization. J. Antibiot. (Tokyo) 30, 275–282 (1977). [DOI] [PubMed] [Google Scholar]
- 13.Peypoux F, Bonmatin JM & Wallach J Recent trends in the biochemistry of surfactin. Appl. Microbiol. Biotechnol 51, 553–563 (1999). [DOI] [PubMed] [Google Scholar]
- 14.Ernst M et al. Molnetenhancer: Enhanced molecular networks by integrating metabolome mining and annotation tools. Metabolites 9, 144 (2019). [DOI] [PMC free article] [PubMed] [Google Scholar]
- 15.Wynalda MA, Hutzler JM, Koets MD, Podoll T & Wienkers LC In vitro metabolism of clindamycin in human liver and intestinal microsomes. Drug Metab. Dispos 31, 878–887 (2003). [DOI] [PubMed] [Google Scholar]
- 16.Protsyuk I et al. 3D molecular cartography using LC-MS facilitated by Optimus and ‘ili software. Nat. Protoc 13, 134–154 (2018). [DOI] [PubMed] [Google Scholar]
- 17.Wilkinson MD et al. The FAIR Guiding Principles for scientific data management and stewardship. Sci. Data 3, 160018 (2016). [DOI] [PMC free article] [PubMed] [Google Scholar]
- 18.Shannon P et al. Cytoscape: A software Environment for integrated models of biomolecular interaction networks. Genome Res. 13, 2498–2504 (2003). [DOI] [PMC free article] [PubMed] [Google Scholar]
Associated Data
This section collects any data citations, data availability statements, or supplementary materials included in this article.
Supplementary Materials
Data Availability Statement
All curated sample information can be downloaded from the ReDU homepage (https://redu.ucsd.edu/) by selecting “Download Database.” The current version of the ReDU information is archived in the GNPS/MassIVE (gnps.ucsd.edu) repository. The accession number is MSV000084206.


