


Abstract
Plasmids and temperate phages are key contributors to bacterial evolution. They are usually regarded as very distinct. However, some elements, termed phage–plasmids, are known to be both plasmids and phages, e.g. P1, N15 or SSU5. The number, distribution, relatedness and characteristics of these phage–plasmids are poorly known. Here, we screened for these elements among ca. 2500 phages and 12000 plasmids and identified 780 phage–plasmids across very diverse bacterial phyla. We grouped 92% of them by similarity of gene repertoires to eight defined groups and 18 other broader communities of elements. The existence of these large groups suggests that phage–plasmids are ancient. Their gene repertoires are large, the average element is larger than an average phage or plasmid, and they include slightly more homologs to phages than to plasmids. We analyzed the pangenomes and the genetic organization of each group of phage–plasmids and found the key phage genes to be conserved and co-localized within distinct groups, whereas genes with homologs in plasmids are much more variable and include most accessory genes. Phage–plasmids are a sizeable fraction of the sequenced plasmids (∼7%) and phages (∼5%), and could have key roles in bridging the genetic divide between phages and other mobile genetic elements.
INTRODUCTION
The evolution of Bacteria to novel challenges is facilitated by their ability to acquire genes by horizontal gene transfer. This process can be driven by the receiving bacteria, as in natural transformation, but seems most often the result of self-mobilizable genetic elements. These elements can be distinguished based on the mechanism of horizontal transmission between cells and of vertical transmission within cellular lineages. Horizontal transfer driven by mobile elements usually takes place either by conjugation or within virions (1). The latter may follow diverse mechanisms: either the temperate phage becomes part of the novel genome as a prophage or it transduces bacterial DNA following one of several distinct mechanisms (2,3). Most genes in prophages are silent, but some may be expressed and confer novel phenotypes to the lysogen (lysogenic conversion). Vertical transmission of mobile genetic elements (MGEs) takes place by autonomous replication of plasmids or by their integration in the chromosome. The textbook view is that conjugative elements tend to be plasmids (4), whereas temperate phages, such as lambda, tend to integrate the chromosome as prophages (5). Yet, it is now known that the majority of conjugative MGEs integrates the chromosome as integrative and conjugative elements (ICEs) (6).
It has also been known for decades that some functional temperate phages are found in the host genome as extra-chromosomal plasmids that replicate in line with the cell cycle (7–9). These prophages are thus also plasmids. Here, we shall follow Ravin et al. (10) and call them phage–plasmids (P–P). P–Ps have functions that are typically associated with plasmids to replicate and segregate at each cell division. For this, they require an initiator of replication (11) (such as a replicase). Some small high-copy number plasmids rely only on passive diffusion for segregation between daughter cells, but model P–Ps are large replicons and are therefore expected to encode partition systems (12). Because P–Ps are temperate phages, they can infect bacteria, produce virions, lyse the host and infect other host cells. Hence, they need to encode many of the typical functions of temperate phages: lysogeny, lysis, DNA packaging and virion structure. Contrary to chromosomal prophages, P–Ps do not need to encode recombinases for site-specific recombination with the chromosome (typically integrases). However, they may encode recombinases to resolve dimers, as many plasmids (13), or to alternate between an integrative and a plasmid state (8). Finally, known P–Ps encode accessory functions often identified in large MGEs, such as defense (e.g. restriction modification and anti-restriction systems) (7) or toxin-antitoxin systems (7,14). Some elements, that strongly resemble experimentally-proven P–Ps, have genes encoding virulence factors (15), antibiotic resistance (16), or the capsule (15).
The first reported P–Ps — P1 and N15 — infect Escherichia coli and were isolated over 50 years ago (14,17). They have become established model systems in the field of molecular biology. P1 is widely used as a strong general transducer (18), because its headful DNA packaging system, the Pacase (consisting of PacA and PacB), occasionally incorporates host DNA into the virion (19). P1 also encodes the site-specific Cre-recombinase to resolve head-to-tail multimers (7), which has become a versatile tool in genetic engineering (20,21). N15 has a linear dsDNA genome with covalently closed ends produced by a protelomerase (TelN) (22), and is a model system to study the formation, resolution and diversity of linear replicons in Bacteria (23). A few P–Ps closely related to P1 and N15 have been reported (9,24), but their numbers and diversity are poorly known. Other P–Ps have been described in enterobacteria, Mycobacterium, Vibrio, Bacillus and Clostridiales (9,25–28). A noteworthy case is the phage SSU5, that was isolated from a Salmonella enterica strain (29) and is a promising auxiliary component for phage cocktails (30). A comparative analysis revealed that this phage is related to a few plasmids encoding proteins homologous to phage sequences from distantly related hosts such as Escherichia, Klebsiella and Yersinia (31). P1, N15 and SSU5 represent only a few examples of potential P–Ps. Several plasmids were reported to have genes homologous to phages and some phages to have genes homologs to plasmids (e.g. pHCM2, pECOH89, RHEph10 and SJ46 (32–35)). Whether these correspond to P–Ps is usually unknown.
The abundance of P–Ps, their relatedness, and their gene contents are poorly known. Two studies have identified elements with nucleotide sequence similarity to P1, SSU5 (9) and N15 (36). Here, we aim at identifying and characterizing P–Ps using more sensitive analyses of protein homology to assess their distribution across Bacteria. The identification of distant homologs allowed to search systematically for phage functions in known plasmids and for plasmid functions in known phages, resulting in the identification of a large number of putative P–Ps. This finding spurred three questions. Can these elements be classed in meaningful groups? Are P–Ps more like phages or more like plasmids? How do gene repertoires vary across different groups? To answer these questions, we clustered P–Ps by similarity of gene repertoires, defined P–P groups, characterized their functions, and used them to study the frequency of phage-like functions relative to plasmid-like functions in P–Ps. Our results show that P–Ps are very diverse in terms of the size, function and organization of gene repertoires.
MATERIALS AND METHODS
Data and data processing
The complete genomes of 11 827 plasmids (with accompanying bacterial genomes) and 2502 phages were retrieved from NCBI non-redundant RefSeq database (37) (ftp://ftp.ncbi.nlm.nih.gov/genomes/refseq/, last accessed in May 2019). The information on the virus family of the phages was taken from the GenBank file under the ORGANISM description (50 phages were unassigned in the file). The replicons were assigned to a bacterial host species using the GenBank file (under ORGANISM) for plasmids and the virus-host database (https://www.genome.jp/virushostdb/) for phages. Additionally, we downloaded 12230 phage genomes from the main section of GenBank that passed a quality filter and were absent from RefSeq. This database has many highly similar phages and was only used to search for homologs of representative P–Ps. It was retrieved from the Virus database of NCBI (https://www.ncbi.nlm.nih.gov/labs/virus/vssi/#/) (38) (last accessed in August 2020). All analysis and visualization were conducted in the R environment (https://www.r-project.org/), if not otherwise stated.
Annotation of protein sequences
The functional annotation of protein sequences was done using HMMER v3.b2 (39) searches with default parameters to the PFAM (40) (version 32.0, September 2018, https://pfam.xfam.org/), TIGRFAM (41) (version 15.0, September 2014, http://tigrfams.jcvi.org/cgi-bin/index.cgi), eggNOG (42) (bactNOG and Viruses only) (version 5.0 November 2018, http://eggnog5.embl.de/#/app/home) and pVOG (43) (version 1, first May 2017, http://dmk-brain.ecn.uiowa.edu/pVOGs/home.html#) databases (downloaded in May 2019). We used the ‘–cut_ga’ option when searching for homology to profiles of the PFAM and TIGFRAM databases to restrict the hits to those with reliable scores. If not otherwise stated positive hits were assigned using the same criteria as used by MacSyFinder (44) (profile coverage ≥ 50%, idomain_evalue ≤ 10−3).
Database of phage-specific HMM profiles
The phage-specific profiles were carefully chosen from pVOG, PFAM and TIGRFAM databases. The pVOG database has phage-specific HMMs with information on their viral quotient (VQ) (43). The VQ ranges from 0 to 1 and indicates the specificity of the pVOG to viruses. A value of VQ close to 1 means that the profile matches almost only virus genomes, whereas a value close to 0 means most matches are from cellular genomes (43). To complement the pVOG database with profiles that are curated manually, we combined it with the PFAM and TIGRFAM databases. First, a reciprocal profile-profile comparison was conducted between all 9518 pVOGs and phage specific PFAMs (n = 366) and TIGRFAMs (n = 71) (phage-specific PFAM and TIGRFAM profiles were taken from Phage_Finder (45)) using HHsearch (46) (included in HHsuite 2.0.9) with a significance P-value threshold of 10−5. Only bidirectional hits were considered. The 437 PFAM/TIGRFAM profiles matched 711 pVOGs leading to 260 clusters (based on Louvain community detection (47), singletons excluded). These profiles are designated as set 1 in the training of the random forest model (Supplementary Table S1) (see below). Second, we selected pVOG profiles built from alignments with at least 15 sequences and with a VQ higher than 0.75 (n = 1435). These profiles are designated as set 2 profiles in the training of the random forest model (Supplementary Table S2) (see below). The 2583 profiles of set 1 and 2 were classed in six categories (a) structure, (b) lysis, (c) packaging, maturation/assembly and DNA injection, (d) recombination, regulation and DNA metabolism (e) unknown and (f) others.
Identification of phage–plasmids (P–P)
To identify P–Ps, we screened known phages for plasmid-associated functions and known plasmids for phage-associated functions. We excluded ssDNA phages (Ino- and Microviridae), elements smaller than 10 kb (smallest dsDNA phage in RefSeq) and larger than 300 kb (to avoid megaplasmids/ chromids (secondary chromosomes) that might have been integrated by temperate phages). The 300 kb cutoff was chosen on the basis of previous definitions of chromids (250 kb) (48) or domesticated megaplasmid (300 kb (4)).
We searched phages for plasmid-associated genes using HMMs specific for plasmid replication (38 profiles from (49)) and plasmid partition systems (9 profiles from (49) and 48 from databases, Supplementary Table S3). Genes associated with conjugation, i.e. the mating pair formation apparatus and the relaxase, were searched using CONJscan (50). This resulted in the identification of 122 phages that contained plasmid features (Supplementary Table S4).
The plasmid database was screened by random forest prediction models to identify P–Ps. Ideally, one would have learned the models on P–Ps as positives and plasmids known not to be P–Ps as negatives. However, the number of elements experimentally demonstrated to be P–Ps is too small. Hence, we made an approximation and built models that were trained to distinguish plasmids predicted to lack phage functions (negatives) and known phages (positives). The training datasets included 2000 randomly chosen phages (positives) and 2000 randomly chosen plasmids lacking prophage fragments (negatives). The latter are those where PHASTER (51) (ran with default parameters) could not identify intact, questionable or incomplete prophages. In addition, we compared the PHASTER output with predictions made by VirSorter (52). The latter found fewer prophage related sequences in plasmids. We decided to work with the PHASTER predictions to have a larger plasmid pool of P–P candidates and to avoid using potential P–Ps as the negative training dataset.
The plasmids were searched for hits to the categorized phage-specific profiles (described in ‘database of phage-specific HMM profiles’, Supplementary Tables S1 and 2). We computed 16 different fractions (per replicon: the number of hits in a category was divided by the overall number of proteins) from these results: six functional categories of phage-specific set 1 (n = 6), same for set 2 HMM profiles (n = 6), pVOG HMMs, phage-PFAM and phage-specific TIGRFAM profiles and fractions of proteins lacking hits. In addition, the number of proteins per replicon was considered (as a control). These 17 features were used for training and evaluation, which was conducted using the ranger (53) package in R. The parameters used to train the models were set to: 10 000 trees, ‘mtry’ = √(feature number) = 4 (number of variables to possibly split at each node was set to default), ‘splitrule’ to ‘extratrees’ and the computation of the variable ‘importance’ mode is based on ‘permutation’ (Supplementary Figure S1). The type of forest (‘treetype’) was chosen to be ‘regression’ to assign a probability - phage probability score (PSC)—that ranges between 0 and 1. A score close to ‘0’ indicates a plasmid lacking phage genes and a score close to ‘1’ indicates that the plasmid has a high probability of also being a phage. To achieve a higher accuracy, we repeated this approach 10 times to build 10 models. In each round, we kept a test dataset (independent from the train dataset), consisting of 4950 plasmids (lacking prophage fragments as predicted by PHASTER) and 497 phages. The out of the box error (O.O.B.) was about 1.3 ± 0.1% (Supplementary Figure S1A). Subsequently, the 10 test datasets were used to validate the 10 models with the pROC package (54) in R. In this evaluation, each model was applied on a test dataset independent from its own training dataset. The area under the curve (AUC) based on the receiver operating characteristics—true positive rate (sensitivity) vs false positive rate (specificity)—was ∼0.99 (Supplementary Figure S1B).
The 10 models were used to class plasmids that were predicted by PHASTER to contain fragments of prophages. Each plasmid was analyzed in the light of each of the 10 models, leading to 10 PSCs values that were averaged per plasmid. We found 566 potential P–Ps with a mean PSC > 0.5 (Supplementary Table S4). This list was complemented with putative P–Ps from the literature (see main text). Only two P–Ps (PSC of 0.68 and 0.76) have a size between 250 and 300 kb indicating that minor changes in the threshold of size have negligeable effects in our results.
Sequence similarity network of phage–plasmids: construction, clustering, curation
We searched for significant similarity (e-value <10−4, identity ≥ 35%, coverage ≥ 50%) among all pairs of P–P proteins using MMseqs2 (version 9-d36de) (55). The best bi-directional hits (BBH) between pairs of elements were used to calculate the weighted gene repertoire relatedness (wGRR) (49,56):
 |
where Ai and Bi are the ith BBH pair of P total pairs, the number of genes from the smaller P–P is min(A, B), and the identity between the BBH pair is id(Ai, Bi). The wGRR varies between 0 (no BBH) and 1 (all genes in an element have an identical BBH in the other).
The wGRR scores were used to compute a sequence similarity network of the putative P–Ps (Supplementary Table S5). Genome pairs with a wGRR ≤ 0.05 were discarded to reduce the signal's noise. The communities of P–Ps in the network were detected using the Louvain algorithm (47) with the NetworkToolbox (57) (R package). The default gamma parameter (γ = 1) was increased to γ = 1.9 to split some large communities (for a study on the variation on this parameter see Supplementary Figure S2). The clustering resulted in 26 communities with three or more P–Ps (Figure 3), 7 doubletons and 47 singletons (Supplementary Figure S3). Communities, that are made of members found only in the plasmid database, were screened for related phages from the non-redundant GenBank phage database to identify cases of high wGRR similarity. Phages with a wGRR score of at least 0.1 to a P–P were considered as related (Supplementary Table S6). We then defined groups with well-related P–Ps (and eventually subgroups) within communities with more than two members. Of note, the communities are assigned by the Louvain algorithm, whereas defined P–P groups are curated subsets of communities where weakly related P–Ps were removed. Communities that were too small or too diverse (e.g. PiSa, Actinophage A) or lacking key functions (e.g. cp32) were not curated (Supplementary Figure S4). The separation of P–Ps within a community into different subgroups (or their exclusion from the group) is based on the analysis of the persistent genome: members of a group have at least 10% of the persistent genes in common (see pangenome detection below, Supplementary Figures S8–S13). Overall, this process of curation led to the identification of one P–P supergroup, 10 groups and four subgroups (Supplementary Tables S7 and S8).
Figure 3.
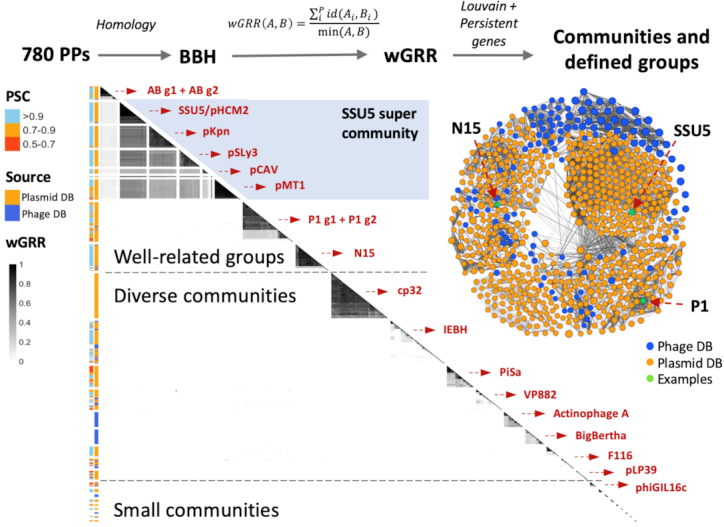
Sequence similarity network and detected communities. The communities are separated by gaps for better visibility. They were extracted, ordered in the figure by hierarchical clustering, and named after a representative P–P or a bacterial clade (in red). In the one-sided heatmap (below main diagonal), each row represents a P–P (n = 721). The 59 P–Ps not in communities were excluded (see Supplementary Figure S3). The range of the wGRR is given by the grey scale bar (from white to black). The first column on the left of the heatmap shows the phage score (PSC, given by the random forest models) and the second column indicates the database where the P–P was identified. The graph of the wGRR matrix is displayed on the right side of the heatmap. Communities that were curated into well-defined groups are shown above.
Typing phage–plasmids in terms of plasmid incompatibility and virus taxonomy
We used PlasmidFinder 2.0.1 (58) with default parameters to class the incompatibility types of P–Ps (Supplementary Table S4). The virus taxonomies of P–Ps identified from the phage database were retrieved from the GenBank file under the ORGANISM entry. P–Ps identified from the plasmid database were classed using the hits to pVOG profiles (n = 9518) as features in a random forest model using the ranger (53) package in R. Training and evaluation were done as for the prediction of phage-like features in plasmids (see ‘Identification of P–Ps’ and text S1). We trained 10 models using 2000 randomly chosen phages (positives, known taxonomy) and 2000 randomly chosen plasmids with a mean PSC < 0.1 (negatives, taxonomy was set to plasmid-like). Each model gave probability scores for all possible taxonomies and only the one with the highest probability was considered. The computed out of the box (O.O.B.) prediction error was 3.0 ± 0.1%. The evaluation of the 10 models was done by 10 data sets, each with 500 randomly chosen phages and 1000 randomly chosen plasmids (not in the training dataset). The correct assignment rate was 98.4% (Supplementary Figure S5A). For the elements tested by at least three out of ten models, the probability average was 98.8% with a standard deviation of 0.2% (Supplementary Figure S5B). We classed P–Ps when the average values of the probability minus the standard deviation were higher than 0.5 (Supplementary Table S4). In a few cases the class of the highest probability assignment differed among the 10 models. In these cases, we chose the taxonomy with the highest frequency. If the P–P was classed ‘plasmid-like’, the virus taxonomy was left unassigned (Supplementary Figure S5C).
Calculation of the phage–plasmid quotient (PPQ)
MMseqs2 (version 9-d36de) (55) was used to calculate the similarity between all proteins of phages, plasmids and P–Ps (e-value < 10−4, identity ≥– 35%, coverage ≥ 50%). The BBHs were extracted and used to compute the phage-plasmid quotient (PPQ) per protein sequence. BBHs with plasmids with PSC > 0.1 were removed to avoid searching for similarity to degenerated P–Ps (or potential P–Ps lacking many known phage genes). Genes lacking homologs in phages or plasmids were excluded. The PPQ scores were computed according to the following equation (see text S2):
 |
where H(phages) is the number of BBH between P–Ps and phages normalized to the size of the phage database and H(plasmids) is the same quantity relative to the plasmid database. The PPQ represents the preponderance of phage hits (relative to plasmids). It is calculated per protein sequence and varies between 0 (mostly plasmid hits) and 1 (mostly phage hits). We computed a PPQ per P–P (gPPQ) by making the average of the PPQs for the P–P (elements with less than 10 protein sequences with a PPQ score were excluded, Supplementary Figure S7, Supplementary Table S4). The gPPQ varies between 0 (mostly like a plasmid) and 1 (mostly like a phage).
Computation and visualization of pangenomes
Pangenomes were calculated using PPanGGOLiN (59) version 1.0.1 with default parameters except for the AB subgroup g2 where the parameter for the max degree smoothing was set to 2 (default = 10) because this group contains only five members. This program uses MMseqs2 (55) to cluster proteins with more than 80% amino acid identity and 80% coverage. PPanGGOLiN then calculates the presence/absence (P/A) matrix of the gene families and performs a partitioning of the families into persistent (present in most P–Ps), shell (present in an intermediate number of P–Ps), and cloud genomes (present in few P–Ps). These matrices were used to curate the P–P communities into defined groups or subgroups (Supplementary Figures S8-S13). Indexed pangenomes graphs (Supplementary Figures S15-S19) were visualized and inspected using Gephi (https://gephi.org/) (as recommended by (59)) and the igraph package (https://igraph.org/r/) in R. Additional information on the gene families of the pangenomes are given in Supplementary Tables S9–19.
The pangenome graphs were colored using the average sequence similarity of the BBH across the P–P (sub) group to produce similarity pangenome graphs (self-hits excluded) (e.g. Supplementary Figure S9C) or colored using the average PPQ values of each gene family to produce PPQ pangenome graphs (e.g. Figure 5A). This allows to identify the variability of gene repertoires in the light of the function, relatedness within a P–P group and frequencies of the gene families in the pangenomes.
Figure 5.

Comparative genome analysis of the well-defined P1 and N15 groups. (A) Pangenome graphs of the N15 and P1 groups (the latter is split into two subgroups). The nodes represent genes of the persistent or shell genomes (see Supplementary Figure S8B and Supplementary Figure S9B for the entire pangenomes). The node colours indicate the phage–plasmid quotient (PPQ) scores (red for phage- and green for plasmid-association) that are computed from the average number of matches of the gene family with phage and plasmid genomes. The edges indicate contiguity between two genes in the P–P and their thickness indicates the frequency of this contiguity. For clarity, we removed the edges when the neighborhood was rare: for N15 < 25%, for P1 < 15%. (B) Comparisons between selected replicons plotted using genoplotR (93). Similarity between co-oriented bi-directional best hits (BBH) is shown in red and between anti-oriented ones in blue. Colour intensity reflects the degree of gene similarity. The values of wGRR are shown between the pairs of elements.
RESULTS AND DISCUSSION
Many phage–plasmids in databases
We screened the RefSeq database (14 329 phages and plasmids) for putative P–Ps, excluding ssDNA phages, plasmids smaller than 10 kb (the smallest tailed dsDNA phage is 11 kb; NC_002515) and larger than 300 kb (may be megaplasmids or chromids with prophages). This resulted in a set of 2383 phages and 8901 plasmids. In the absence of published methods to identify P–Ps, we developed an approach to identify phage core functions in known plasmids and another approach to identify plasmid core functions in known phages. We assumed that such elements are good P–P candidates. We searched 2383 known phages for genes involved in plasmid replication, partition and conjugation. We detected 122 putative P–Ps (Figure 1A), including most of the already reported elements (e.g. P1, N15 and SSU5, Supplementary Table S4). Some known elements that are absent from RefSeq such as P7, D6 and pMCR-1-P3 (9,60) were also correctly identified by our methods in a complementary analysis of GenBank replicons absent from RefSeq. Yet, for consistence and to avoid redundancy, we only present the data concerning RefSeq.
Figure 1.

Methods to screen databases for P–Ps. (A) 2383 phages were annotated using protein profiles specific of plasmids (conjugation, replication and partition), resulting in 122 putative P–Ps (Supplementary Table S4). (B) Carefully selected phage protein profiles were classified into distinct phage-specific functions such as structure components, packaging/maturation, lysis, etc. Their hits were used as features to train a machine learning method to distinguish plasmids lacking any kind of prophage from phages. We then used 10 random forest models to screen a plasmid database of 8901 plasmids yielding in 566 putative P–Ps (phage probability score (PSC) > 0.5) (Supplementary Table S4). (C) The screen for P–Ps was complemented by searching the literature for other potential P–Ps.
We used a machine learning approach to identify phage-associated traits in 8901 known plasmids. For this, we made a database of 2583 phage-associated protein profiles and used them to find such genes in plasmids (Figure 1B). We then trained random forest models to distinguish phages from plasmids lacking any kind of prophage regions (see Methods). These models revealed high sensitivity, high specificity and a low error rate (1.3 ± 0.01%, Supplementary Figure S1AB). Replicons with phage probability score (PSC) > 0.5 were regarded as putative P–Ps. We found 566 such putative P–Ps among known plasmids (Supplementary Figure S1E).
We searched the literature for previously demonstrated or suggested P–Ps missed in our screen. These rare cases could be classed in three different types (Figure 1C, suppl. text 1): (i) Three linear dsDNA Betatectiviruses (GIL16c, Bam35c and AP50) lack recognizable plasmid functions. Interestingly, in contrast to the Gram-negative infecting Alphatectiviruses, all members of the Betatectiviruses are known to be temperate (27,61). Persistency with the host, carrier states and a close relation to the linear plasmids pBClin15 from B. cereus and pBMBLin15 from B. thuringiensis were described (27,61). The latter two cases have identifiable phage-related functions and were positive in our screen. Hence, these types of P–Ps could be identified when scanning known plasmids, but not when scanning known phages. (ii) Two distinct phages with known extra-chromosomal replicative states—F116 from Pseudomonas and phiBU01 from Staphyloccocus (8,62)—lack recognizable plasmid related functions. Closely related elements were absent from the plasmid database. However, F116 is a known temperate and general transducing phage (63), with a few known phage relatives (H66, LKA5, phiC725A) (64). Interestingly, phiC725A has integrative and non-integrative states in the host (64). A similar finding was reported for two putative Staphyloccocus P–Ps, phi80b and phi84b, (but not for phiBU01) that integrate the bacterial chromosome or are maintained as episomes (depending on the host genome) (65). (iii) The cp32-like Borellia/Borreliella plasmids have been proposed to be P–Ps (66). These 87 elements lack recognizable key phage-related functions: tail or capsid proteins (PSC ranging from 0 to 0.38). A phage, phiBB-1, found among cp32-like elements is capable of forming virions and transduce DNA of a different cp32 (67). We thus assumed that these three sets of elements are known or putative P–Ps. Together with the P–Ps from the two screening approaches this resulted in a set of 780 P–Ps (Supplementary Table S4). Although we may have missed P–Ps, especially in poorly studied phyla (discussed in the next section), we can already conclude that P–Ps are a significant fraction of elements classed as phages or plasmids. They are 7.3% (653 of 8901) of the plasmids and 5.3% (127 of 2383) of the phages of RefSeq.
Phage–plasmids are prevalent and have a bimodal size distribution
P–Ps occur in many bacterial species scattered across 81 host genera (Supplementary Table S4). They can be found in Firmicutes such as Bacillus and Clostridium, in Actinobacteria such as in Mycobacterium, and in alpha, beta and gamma Proteobacteria like enterobacteria, Vibrio, Acinetobacter, Zymomonas, and Burkholderia (Figure 2A). More than 200 of the P–Ps are found in Escherichia and Klebsiella species, where they represent 7.3% of their ∼2900 phages and plasmids. This is consistent with a report where ∼7% of the E. coli strains had P1-like P–Ps (16). A large number of P–Ps was also found in mycobacterial phages. Although no P–P was detected among the few available mycobacterial plasmids (n = 72), we found plasmid functions, mostly partition systems, in 6.3% of the 365 mycophages. These P–Ps belong to the huge cluster A of temperate actinophages (25), of which 20% lack an integration module (25,68). The frequency of P–Ps among phages and plasmids is even higher in other less sampled clades. For example, P–Ps are a large fraction (up to 50%) of phages or plasmids of Arsenophonus, Bacillus, Clostridia and Piscirickettsia. Two of these genera, Bacillus and Clostridia, have many sequenced genomes, which means that high frequency of P–P is not an artifact due to small samples. We found more than one P–P element in 75 bacterial genomes of which most are in Klebsiella, Piscirickettsia and Bacillus (Supplementary Table S4).
Figure 2.
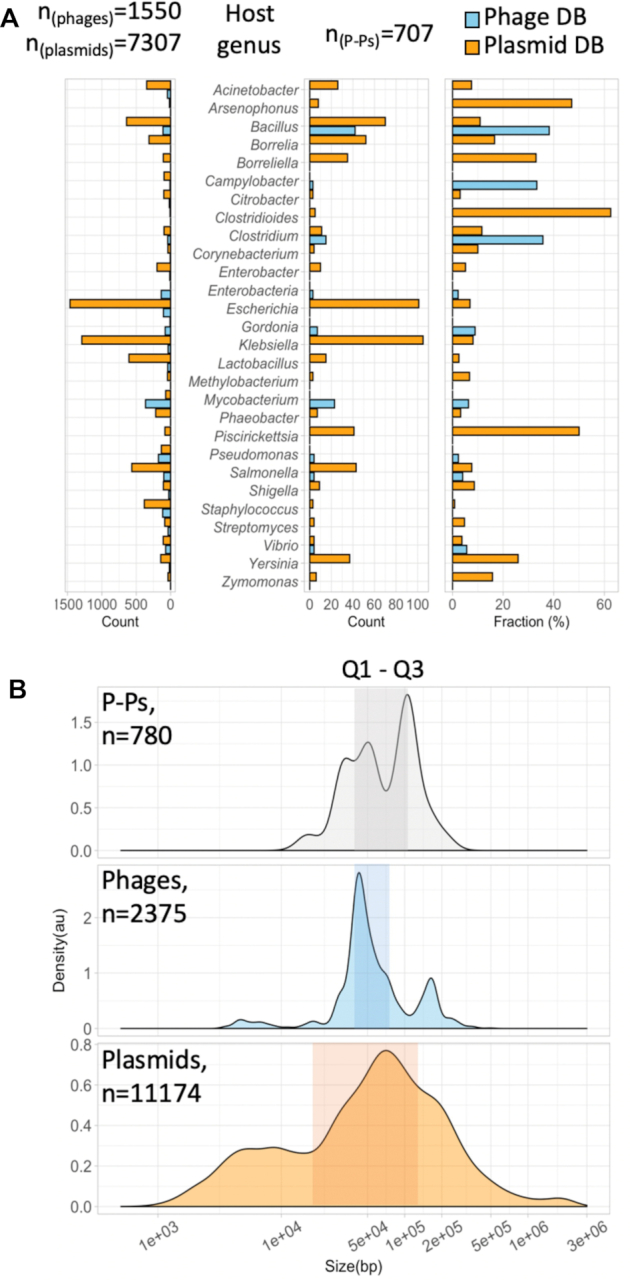
Host and size distribution of P–Ps. (A) The frequency in bacterial genera of phages and plasmids (left) and P–Ps (center), for genera with at least three P–Ps (for the complete host distribution see Supplementary Table S4). The right panel shows the frequency of P–Ps per host genus normalized to the sizes of the databases of phages and plasmids. (B) Density plots (mean normalized counts) of replicon sizes from P–Ps (grey), phages (blue) and plasmids (orange). The number of phages and plasmids represent the number of all elements in the databases w/o the 780 P–Ps. The shaded boxes indicate the ranges of the first (Q1, 25%) and the third (Q3, 75%) quantiles representing 50% of the replicons.
These data show that P–Ps are prevalent. However, the precise numbers should be taken with care, since they vary widely across clades and depend on several factors as discussed. First, we assume that we can identify phage and plasmid associated functions. This is probably true for most key phage functions in the best studied bacterial clades, but may not be true for phage and plasmid functions in Spirochaetes, Bacteroides and other clades. This will result in an underestimate of the number of P–Ps, especially when searching for plasmid functions in phages, because replicases evolve fast and many known plasmids lack recognizable replicases (6,56). Second, we cannot ascertain if these P–Ps are functional. Bacterial chromosomes contain many defective prophages (86,87), and this may also be the case of some P–Ps. Similarly, elements identified from the phage database may have lost plasmid functions (although loss of both replicase and partition systems will make them undetectable in our screen). Third, some elements may oscillate between integrated and extra-chromosomal states (8), blurring the distinction between chromosomal prophages and P–Ps. Fourth, some putative P–Ps may be prophages integrated in plasmids. We expect prophage integration in plasmids to be rare, since phages are thought to select for highly conserved integration sites in chromosomes (plasmids tend to be present in few strains of a species). To minimize this problem, we excluded megaplasmids and secondary chromosomes from the analyses. Finally, one cannot exclude the possibility that some putative P–Ps are in a relation of pseudolysogeny with the bacterial host (88) (although that would leave unexplained the presence of plasmid-like functions). In spite of these caveats, the observation that the best-studied clades in the database (enterobacteria and Bacillus) have more P–Ps than the average Bacteria and that these have clear similarities to known P–Ps, suggests that we have underestimated the number of P–Ps.
The distribution of P–P genome sizes shows two interesting patterns (Figure 2B). First, its bimodal with a broad peak around 50 kb and a sharper one around 100 kb. Their average size (medianP–Ps = 67.8 kb) is larger than those of both plasmids (medianPlasmids = 59.1 kb) and phages (medianPhages = 48.5 kb). Presumably this is because P–Ps have to encode the key functions of both types of elements. Second, the quantiles of this distribution are intermediate from the ones of plasmids and phages. On average, the interquartile distance of P–P genome sizes (ΔQ1,Q3 = 68.8 kb) is almost half that of plasmids (ΔQ1,Q3 = 112.6 kb) and double that of phages (ΔQ1,Q3 = 35.8 kb). It's likely that contrary to plasmids, sudden changes in P–P size are restricted by the need to accommodate its genome in the capsid of the virion.
Composition and diversity of P–P groups
We searched for homology across the gene repertoires of the 780 P–Ps by computing the weighted gene repertoire relatedness (wGRR), which integrates information on the presence of homologs and their sequence identity (see Methods, Supplementary Table S5). It varies between zero (no homologs) and one (all genes from one element have an identical homolog in the other). Among pairs with moderate to high wGRR values (>0.05), many include comparisons of P–Ps from the phage and the plasmid databases (meanwGRR = 0.32 to be compared with an average of 0.38 for comparisons between P–Ps from the phage database), showing that the two sources of P–Ps have many homologous elements.
We clustered the wGRR matrix using the Louvain algorithm (47) and detected 26 communities with at least three P–Ps. The communities were named after representative members (e.g. P1, N15, SSU5) or the clade of the most frequent host (e.g. AB for Acinetobacter baumannii, PiSa for Piscirickettsia salmonis) (Figure 3). Five communities showed high wGRR values within and between the communities and were classed into one supercommunity (named after SSU5). From the remaining 21 communities, three large (cp32, PiSa and pLP39) and five small ones (less than 10 members) are made of members that were identified only in the plasmid database (Supplementary Table S4). These putative P–Ps, except the cp32-like ones, contained key phage functions (in agreement with their classification as phages by our random forest model). To search for known phages related to those ‘plasmid-only’ communities, we screened phages from GenBank (absent in RefSeq) and found a few with wGRR higher than 0.15 for four of them (pLP39, pBS32, phiCmus, pSAM1) (Supplementary Table S6)). No similar phages were found for members of PiSa, cp32 and the two small communities, pp_phaeo and pp_Blicheniformis that were isolated from bacterial species with no or only a very few known phages (Borellia, Piscirickettsia and Phaeobacter species, and Bacillus licheniformis). In four communities P–Ps were only identified from the phage database (two large and two small communities), typically from bacterial clades where partition and replication functions are poorly known. Only 59 of the 780 P–Ps were outside communities, most being singletons (n = 47) with very low wGRR to other P–Ps (Supplementary Figure S3). One prominent singleton is the crAssphage, where we could identify significant matches to HMM profiles specific for plasmid-like replication genes (previously reported in (69)). So far, no lysogenic module or integrase genes were reported for crAss-like Bacteroides phages, but co-replication with the host was previously described for at least one member of the crAss-like phages (70), fitting the definition of P–P.
We used the wGRR values and the pangenomes of the communities to curate the large communities with high average wGRR values into homogenously related P–P groups (see Methods, Figure 3, Supplementary Figure S4AB). The curation process resulted in eight P–P groups among which two groups, P1 and AB, were further split into subgroups (P1-g1, P1-g2 and AB-g1, AB-g2). Most members of a P–P group are hosted by closely related bacteria, e.g. those of the AB group are from Acinetobacter, of the pMT1 group are from Yersinia pestis and those of the pKpn group are from Klebsiella (Supplementary Table S8). Overall, 39% (301 of 780) of the P–Ps can be classed in the 8 groups. The remaining elements are in communities of very diverse P–Ps and will require further data to be curated.
Are P–Ps more like phages or more like plasmids?
It is usual to class plasmids according to the replication incompatibility (Inc types) and phages to their virion structure (although the genomic relatedness is becoming the new standard). P–Ps can be classed relatively to the phage taxonomy and plasmid incompatibility, because they encode virions and plasmid replicases.
We used the taxonomic information from the NCBI on virus families to class the P–Ps identified in the phage database. Those identified in the plasmid database lack such information and we predicted their taxonomy using random forest models (Supplementary Figure S5C, see Methods and Text S1 for details). We could not confidently predict a virus family for 25.9% of the P–Ps identified in the plasmid database (Supplementary Table S4). The vast majority (95.9%) of P–Ps that could be assigned a taxonomy (from the plasmid and the phage databases) are Siphoviridae (e.g. SSU5 related and N15-related P–Ps) and Myoviridae (P1, Figure 4A). Overall, the assignment of a virus family to a defined P–P group was consistent, i.e. P–Ps from the same group usually had similar classifications. But in some highly diverse communities, those that we could not curate, there are sometimes members of different virus families. For example, the F116 community contains P–Ps belonging to Myo-, Podo- and Siphoviridae (Supplementary Tables S4 and S8). This confirms the need to acquire further information on these communities before curating them.
Figure 4.

Classification of P–Ps relative to phages and plasmids. (A and B) Distribution of P–Ps in terms of virus taxonomy (families) and of incompatibility types. NA: non-curated communities. (C) Boxplots of the genomic phage–plasmid quotients (gPPQs) for P–Ps (n = 677, grey) (Supplementary Table S4), phages (n = 458, blue) and plasmids (n = 1121, orange). A few P–Ps contained only a few genes homologous to phage or plasmid genomes. To increase the accuracy of the analysis, only elements with more than 10 genes with a PPQ were considered (see Materials and Methods). (D) Same as C for defined P–P groups (AB to N15) or communities (the rest) with at least 10 elements.
The Inc types of P–Ps were predicted using PlasmidFinder (58). Note that few P–Ps could be typed (193 out of 780). This is somewhat expected, since the PlasmidFinder database is much more detailed for Enterobacteriaceae than for other clades (58) and even in the remaining well-studied Proteobacteria most plasmids cannot be typed (71). When P–P groups could be systematically typed, they tended to reveal only one or two types. Notably, most P–Ps (130/193) were from the IncFIB type mainly represented by members of the SSU5 supercommunity (Figure 4B). They are predicted to be Siphoviridae. However, a few members of the F116 community (P–Ps from Klebsiella) are also typed as IncFIB but predicted to be Podoviridae (Supplementary Table S4) suggesting that similar plasmids can recombine with phages from different families/genera.
P–Ps are both phages and plasmids. Yet, from a functional and evolutionary point of view, it is interesting to address the question whether they are more like phages or more like plasmids. To answer this question, we quantified how many of their genes are homologous to those of plasmids or phages using a score that we termed the phage–plasmid quotient (PPQ). This is the number of homologs to phages divided by the number of homologs to phages and plasmids (see Materials and Methods). Its average across the P–P, termed gPPQ, ranges from 0 (only plasmid homologs) to 1 (only phage homologs). We compared the gPPQ scores of P–Ps (Supplementary Table S4) with those of a control set consisting of 458 phages and 1121 plasmids with similar size and host distribution as the P–Ps (Supplementary Figure S6A). Expectedly, the values for plasmids are systematically close to zero whereas those of phages are always close to one. In contrast, P–Ps have intermediate values dispersed between 0 and 1 (Figure 4C). When these values are analyzed within each P–P group, their dispersion decreases, showing that within-well-defined groups the variation is smaller than between them. These values also tend to be slightly higher than 0.5, indicating the presence of more homologs to phages than to plasmids (Figure 4D). The analysis of non-curated communities shows a more diverse picture, where some P–Ps are systematically more like phages, such as the BigBertha and Actinophage A clusters and others tend to be more like plasmids (e.g. PiSa or the cp32) (Figure 4D). The latter finding is consistent with the inability of our model to predict phage functions in the cp32 elements. The non-curated communities with most heterogeneous values of gPPQ (Supplementary Table S4) tend to correspond to those with low meanwGRR values within the community (Figure 3, Supplementary Table S7).
Overall, these results show that P–Ps have many traits of phages and plasmids, and most curated groups have slightly more phage-associated than plasmid-associated genes. This is not wholly unexpected, since the number of genes minimally required for a dsDNA phage is much higher than the one required for a non-conjugative plasmid. These results raise the question of the type and level of conservation of non-essential phage and plasmid genes in the groups or communities of P–Ps. To answer this question, we computed the pangenome of each P–P group and identified the genes present in most elements (persistent genes), present in very few (cloud genes) and the others (shell genes, see Methods). These analyses are addressed in the next sections.
The P1-like P–Ps make two distinct subgroups
The P1 community was curated by removing seven P–Ps with few persistent genes and low wGRRs with the other members. It was then split using the wGRR and the pangenome data of the group into two subgroups (Supplementary Figure S9A). The larger subgroup includes P1 (P1-g1) and the smaller one (P1-g2) contains members that are closely related to D6, a known P1-like P–P (9) (whose genome sequence is lacking in RefSeq, but is available in GenBank). The separation between the two subgroups is clear, since the average wGRR within them is ∼0.75 and the one between them is only 0.23 (Figure 5B, Supplementary Figure S9C). In addition, the distinction between some of the elements of the two groups was previously described (9). The persistent genomes of the subgroups are comparable in size (P1-g1:77 gene families vs P1-g2:61 gene families) and are split into six conserved regions separated by clusters of shell and cloud genes (Supplementary Figure S9B). In spite of the conservation of the genetic organization between the subgroups, the one including P1 has 2.1× more shell genes and 3.6× more cloud genes than the other subgroup suggesting that it is more plastic (or more ancient).
The gPPQ of the P1 community tends to be smaller than 0.5 (Figure 4D), because there are more persistent gene families associated to plasmid sequences than to phages (Figure 5A). Among these, one finds the typical plasmid core functions, but also a well-known toxin-antitoxin system (doc, phd) and the Cre recombinase. In terms of genetic organization, the partition and replication systems are co-localized in P1-g1 and separated by 14 persistent genes in P1-g2. Interestingly, the subgroup 1 pangenome contains two gene families annotated as replicases which are found at the same position in the P–P elements (Figure 5A), between two co-linear blocks that are in inverted orientation in each subgroup (Figure 5B). These differences fit the Inc type classification, since P–Ps with one type of the replicase are typed as IncY and those with the other one are p0111 (Figures 4B and 5A). This suggests that P–Ps from both types can be maintained in a single host as plasmids, because they are compatible in terms of replication.
Even if genes homologous to phages tend to be less abundant than those homologous to plasmids, we found many persistent genes involved in the phage lytic cycle (holins, terminases, tails, baseplate proteins). Counterintuitively, some genes that are usually associated to phage functions (tails, phage head, tube proteins), have more homologs in plasmids than in phages, explaining the low PPQ of this group (Figure 5A). We assume that the causative plasmids are either defective (unrecognizable) P–Ps or plasmids that acquired structural phage genes by recombination. We also found that the pacAB genes, encoding the two subunits of the P1 terminase, are conserved only in the P1-g1. Members of P1-g2 only encode homologs of pacB (Figure 5A). This suggests that general transducers like P1 are more likely to be found within P1-g1. In contrast, the phd/doc TA system is highly conserved between the two subgroups (Supplementary Figure S9C).
N15-related P–Ps are widely spread in Enterobacteria and characterized by the presence of the telomerase
The group of N15-like P–Ps (n = 44) was built from the N15 community by removing P–Ps (n = 7) with low wGRRs to the other elements of the community (Figure 5A, Supplementary Figure S8A). Most P–Ps are found in Klebsiella genomes (n = 41), two in E. coli and one in Citrobacter freundii (Supplementary Table S2). Hammerl et al. reported that the linear Vibrio P–Ps from the VP882 community (such as VP882, VHML and phiHAP-1) have genome organizations similar to those of N15 (24). Although the gene synteny cannot be confidently confirmed by our analysis (Figure 5B), the low wGRR values between these P–Ps and N15 resulted in their separation into a distinct community (wGRR < 0.01, Supplementary Figure S8C). Genome sizes of members of the N15 group are comprised between 46.4 and 82.0 kb (medianN15 = 55.3 kb). The pangenome graph reveals the existence of three syntenic arrays separated by three small variable clusters of shell genes (Supplementary Figure S8B). The telN gene family encoding the protelomerase is needed to maintain a linear genome. It is present in all P–Ps of the N15 group. This strongly suggests that all these elements have linear replicons. One should note that many of the GenBank files identify these replicons as circular, but we did not find published evidence of this. Given the ubiquity of the protelomerase, the circular replicons were probably erroneously annotated. The partition systems, the telomerase and the repA gene families are present and co-localized in most of the genomes, confirming that they are defining traits.
The phage-associated functions in the N15-related P–Ps are more numerous than those of plasmids and also tend to be co-localized in the replicon. Some of these genes seem specific to the group (minor tails, tail tubes) whereas others have homologs in other phages (encoding capsid and tail proteins) (Figure 5A, Supplementary Table S8). The majority of the latter are from phages infecting Enterobacteria, e.g. phage HK225 and phi80, but there are some homologs among Burkholderia or Pseudomonas phages (Supplementary Table S9). Two gene families, one in the persistent and the other in the shell genome, encode alternative SOS-dependent phage anti-repressors homologous to those of some lambdoid phages. They are located in the same genomic region, but they are never present in the same genome, and are very similar (79% identity covering ∼99% of the sequence) suggesting that they are fast-evolving orthologs (Figure 5A).
The group of AB P–Ps is specific to Acinetobacter
The curation of this community led to the exclusion of two distantly related members, resulting in a well-defined AB group that contains only P–Ps from Acinetobacter spp. It is noteworthy, that one of the excluded members is the phage RhEph10 of Rhizobium that is homologous to the known P–P pLM21S1 of Sinorhizobium Rhizobium (72). The AB group is the only one lacking (to the best of our knowledge) a known phage. A screening of the GenBank phage database revealed two phages, the Klebsiella phage ST13-OXA48phi12.3 and the Pseudomonas phage Nickie, that are distantly related to members of the AB group (highest wGRR: 0.18 and 0.15) (Supplementary Table S5). Moreover, the group was further split into two subgroups AB-g1 (n = 19) and AB-g2 (n = 5) with similar replicon sizes (∼110 kb) (Supplementary Figure S10A), and low overall similarity (wGRR = 0.25, Figure 6A, Supplementary Figure S10C). We found 54 persistent genes conserved across the two subgroups showing that even if the percent similarity of proteins is low, both subgroups share a large number of homologs (Figure 6B, Supplementary Figure S10C). They include many phage-related functions such as terminases, tails, assembly proteins, capsids, but not lysozymes. It is noteworthy that some of these are homologous to tail proteins of phages from Enterobacteria and Burkholderia (Supplementary Tables S12 and S13). Moreover, genes involved in homologous recombination (recA and recF), and in partition are homologous in the two subgroups. The latter includes ParB encoding genes (involved in DNA segregation) that occur in two copies in most of the elements (Figure 6A). In spite of these commonalities, the pangenome of AB-g1 is larger than the one of AB-g2, especially in what concerns the shell and cloud genomes (Supplementary Figure S10B). Also, the plasmid-related functions - replication and parA partition gene - are highly divergent (Figure 6AB, Supplementary Figure S10C). In summary, the AB subgroups are relatively small and found mostly in A. baumannii strains (only two P–P are found in other species). Like for the N15 and P1 groups, the genes homologous to phages tend to be in the persistent genome, whereas the plasmid-associated genes are more diverse and variable. As described below, the AB group also shares similarities with the SSU5 supercommunity.
Figure 6.

Pangenome analysis of the AB group. (A) Pangenome graphs of the two AB subgroups. (B) Comparisons between selected replicons. For details, see legend of Figure 5.
The SSU5 supercommunity is the largest set of related P–Ps
The SSU5 supercommunity includes the five communities SSU5_pHCM2 (n = 41), pKpn (n = 42), pSLy3 (n = 32), pMT1 (n = 39), pCAV (n = 9) and two other P–Ps (Figure 3). All these elements are related to SSU5 and to each other (average wGRR between communities in the range 0.23–0.59) (Figure AB, Supplementary Table S7, Supplementary Figure S11C). They were isolated from different enterobacterial hosts, including E. coli, K. pneumoniae, S. enterica and Y. pestis. The curation process of the supercommunity led to the exclusion of three far-related elements among the pMT1 and pSLy3 communities and the entire pCAV community resulting in a well-defined SSU5 supergroup with a common persistent genome. The pCAV community was excluded because only a few persistent genes are shared (Supplementary Figure S11A). Hence, the SSU5 supergroup is made of the four curated P–P groups SSU5_pHCM2, pKpn, pSLy3 and pMT1 (Supplementary Figures S11, S12). The SSU5 supergroup has a complex and large pangenome consisting of 35 persistent, 281 shell and 815 cloud gene families (Supplementary Figure S11B). In addition, in the shell genome (genes present at intermediate frequencies) some genes are present in multiple, but not all, P–P groups (Supplementary Figure S11A). This suggests the existence of genetic flux across these P–Ps.
We detected more phage-like genes (n = 16) than plasmid-like ones (n = 3) in the persistent genome of the entire supergroup. Interestingly, most of the former are clustered in one region, denominated the phage-array, with many homologs in the pCAV group (Figure 7A). These genes encode phage tails, capsids and terminases. As found for the AB and N15-related P–Ps, similar tail genes are also found in lambdoid Siphoviridae from Enterobacteria (Supplementary Table S18). Most of the persistent gene families that are not in the phage-array are involved in DNA recombination e.g. resolvases, tyrosine-recombinases and RecA-like proteins (Figure 7A). In contrast, the plasmid-like genes are much more abundant in the shell and especially in the cloud genomes where they are >4.3 times frequent than phage homologs (Figure 7A, Supplementary Table S18). Although the function of most gene families of the shell genome is not known, they also include toxin-antitoxin and restriction modification systems, anti-restriction mechanism (such as ArdA-like proteins) and putative virulence factors like pili assembling proteins (PapC and PapD) (73). The cloud genome of the supergroup is very large (>800 gene families), reflecting the high diversity of these P–Ps (Supplementary Table S18, Supplementary Figure S11B).
Figure 7.

Conserved patterns in genomes of the SSU5 supergroup. (A) Pangenome graph of the SSU5 supergroup. (B) Comparisons between selected replicons. For details, see legend of Figure 5. The pCAV group was excluded from the analysis of the pangenome because it's not included in the SSU5 supergroup (see main text).
The comparison of the supergroup's pangenome with those of the single groups’ revealed conserved regions beyond the abovementioned arrays of genes for phage structural proteins and recombination functions (Figure 8). Some of these regions are specific to a particular group (blue nodes in Figure 8) whereas others are conserved across different groups or even at the level of the whole supergroup (orange/yellow nodes in Figure 8). Most notably, many of the pMT1-like P–Ps share a specific set of co-localized plasmid-like genes (Figure 8, blue nodes in pMT1). These genes are not found in the other three SSU5-related P–P groups (pSLy3, pKpn and SSU5_pHCM2) whose pangenomes show more similar organizations and have more frequent genes (persistent and shell) in common (Figure 8). Nevertheless, this does not translate into larger differences in terms of genetic plasticity, since the pangenome and wGRR matrices of the pKpn and pSLy3 groups show higher diversity of gene repertoires than those of pMT1 and SSU5_pHCM2 groups (Supplementary Figures S12BC, S13B). Interestingly, the SSU5 supergroup shows also some similarity to the P–Ps from the AB group (wGRRmean = 0.08) (Supplementary Figure S14A). Most of the homologous genes are found in the persistent genome of the SSU5 supergroup, especially in the arrays of genes encoding the phage structural genes and the recombinases (Supplementary Figure S14B). Hence, the SSU5 supergroup, the pCAV and the AB groups are evolutionarily related, especially concerning phage and recombination functions. As found for the other defined P–P groups, the SSU5 supergroup has a core of conserved and co-localized phage-like genes that accounts for a large fraction of the persistent genes and a larger number of plasmid-like genes that differ more widely both within and between the single groups.
Figure 8.

Similarity analysis of the SSU5 supergroup and the less-related pCAV group. Pangenome graphs of the single SSU5_pHCM2, pKpn, pMT1, pSLy3 and pCAV groups and the entire SSU5 supergroup were colored in function of the values of PPQ (larger graphs) and similarity to the pangenome of the SSU5 supergroup (smaller graphs next to the arrows). Nodes and edges are as in Figure 5. The average number of homologs of a gene family with phage and/ or plasmid genomes is given in the PPQ graphs. Genes that are specific to one group are shown in blue in the SSU5 similarity graphs. Otherwise, genes and their orthologues (BBH) found in at least two P–P groups are indicated in orange/yellow/light yellow nodes (depending on their average identity) (see Methods). An example: The pMT1 pangenome (top left) is highly related to the one of the SSU5 supergroup (center), since the two similarity pangenome graphs next to the arrows show many similarities (colored in light yellow, orange to yellow). However, some co-localized gene families are only found in the pMT1 group (they are indicated in blue).
Non-curated P–P communities
IEBH
This large community of 83 elements includes the known P–Ps IEBH (74), and was mostly isolated from Bacilli and Clostridia. The replicons are very diverse (mean wGRR = 0.06) and their level of similarity is extremely variable (coefficient of variation (cv) = 267%) (Supplementary Table S7). Their average genome size is 49 kb, but the range of sizes is very large (from 16 to 160 kb) (Supplementary Table S4).
phiGIL16c
This small community of 9 Betatectiviruses from Bacillus includes phiGIL16c was shown to form phage particles and be maintained as a linear plasmid (27). Five of the nine replicons are annotated in RefSeq as linear including phiGIL16c, Bam35c and pBClin15 (27,61). The genomes range between 13 and 15 kb in size (Supplementary Table S4) and are closely related (mean wGRR = 0.59) (Supplementary Table S7). Our screening failed to identify partition or replication systems in these P–P, suggesting that plasmid maintenance uses so far unknown mechanisms. As a result, all these elements were identified in the phage database.
VP882
The P–Ps of this community are too diverse to be put in large groups (mean wGRR = 0.1) (Supplementary Table S7) and their sizes are extremely variable (from 16.6 kb to 241.8 kb (Supplementary Table S4), average = 40.9 kb). They are found across Proteobacteria, including Vibrio (VP882) (26), Arsenophonus, Cupriavidus, Halomonas, Burkholderia (KS-14) (75), Klebsiella or Escherichia (P88) (Supplementary Table S4). It is noteworthy that P88 was isolated from a lysogenic E. coli strain after induction (76). Our screening identifies partition and plasmid-like replication genes, but P88 was previously found to be integrated (76) suggesting that it may have episomal and integrative states. Several of the Vibrio and Halomonas P–Ps have been reported to have linear replicons (26). However, the protelomerase is present in only five P–Ps, suggesting that most of the elements have circular replicons.
BigBertha
This heterogeneous community of P–Ps with 28 members from Bacillus has large replicons (average size 159.7 kb) (Supplementary Table S8). They were all identified in the phage database, and many were previously described as strictly virulent and belonging to the SPO1-like phages (77–79) (Supplementary Table S4). However, all of them had homologs of the partition systems of the IEBH group, which contains a bona fide P–P. Since no clear plasmid state was reported and it was suggested that the partition genes might be involved in host sporulation (80), we are not very confident that this community is constituted of P–Ps.
cp32
These plasmids from Borellia/Borreliella are around 30 kb in size and are quite similar (mean wGRR = 0.72, cv = 17%) (Supplementary Figure S4). They were previously proposed to be P–Ps (66), and one related member (phiBB-1) was experimentally proven to form virions (67). Although phiBB-1 was not sequenced, its genome hybridizes with cp32 DNA (81) and it was demonstrated that it can transduce cp32s (67). However, cp32 elements score poorly in our random forest models (PSC between 0.003 and 0.375) and we found very few proteins with phage homologs (PPQ between 0 and 0.012) (Supplementary Table S4). Moreover, our search in the GenBank database revealed no confident phage homolog. Since the plasmids of Borrelia have been described as recombining very frequently (82), many cp32 may be defective P–Ps.
pLP39
In this diverse community with 17 members, 14 of them were isolated from Lactobacilli. Members of the community are poorly related (wGRR < 0.11, Supplementary Table S7). Their sizes vary between 19.7 and 108.3 kb with an average of 40.0 kb (Supplementary Tables S4 and 8). So far, none of them were experimentally reported to be P–Ps. However, our models predict a high PSC >0.9 for nine P–Ps (Supplementary Table S4) and we could find homologous phages, such as phage Sha1 and PM411 (wGRR 0.39 and 0.76) (Supplementary Table S6), suggesting the pLP39 community contains true P–Ps.
Actinophage_A
These P–Ps were identified from the actinophages of the cluster A. They were known to encode partition systems, lack integration cassettes and remain extrachromosomal (25,83). Some elements infect Gordonia terrae, but the majority infects Mycobacterium smegmatis. Their sizes are quite similar (average of 52.9 kb) (Supplementary Table S8), even if their gene repertoires are only moderately related (mean wGRR = 0.42) (Supplementary Table S7).
PiSa
This heterogeneous community with 41 members was identified exclusively from plasmids of Piscirickettsia salmonis. Their sizes vary widely from 31.9 to 188.3 kb and their gene repertoires are moderately related (mean wGRR = 0.42). There is no experimental evidence that any of its members forms phage particles and, we could not find relatives in the GenBank phage database. In addition, since the phage scores for 37% of the members were relatively low (PSC < 0.7) (Supplementary Table S4), it is possible that some of these elements have lost part of the phage genes. This is consistent with previous observations that Piscirickettsia plasmids are highly mosaic due to a suspected high activity of transposases (84).
F116
This highly diverse community includes the known F116 P–P of Pseudomonas aeruginosa (62). The replicons are poorly related (average wGRR = 0.11) (Supplementary Table S7), their sizes range widely from 21.6 to 243.8 kb (Supplementary Table S4), and their virus taxonomy is inconsistent within the community (due to the presence of Myo-, Podo- and Siphoviridae) (Supplementary Table S8). We could not detect a partition or plasmid replication system in F116, whereas most other elements of the community encoded at least a ParA (including Phages SE1, ST160 and phi297). In two of the other members of the community, D3 and phiSG1 (suspected but not proven to be P–Ps (85,86)), we found homologs to plasmid replicases. The Pseudomonas phage YMC11/02/R656 also encodes a plasmid replicase. Eleven P–Ps were identified among plasmids of Klebsiella and Shigella. Although no experiments proved them to be P–P, some show very high phage score (PSC>0.9) (Supplementary Table S4).
CONCLUSION
P–Ps are numerous and organized in distinct groups or diverse communities. Within groups there are many core genes, even if the sequence divergence can be high. This is consistent with these groups being ancient. Furthermore, while the persistent genes between different communities were usually very divergent, we could systematically identify homologs in key phage functions across them. For example, the AB, pCAV and SSU5 groups have homologous persistent genes, suggesting a distant evolutionary association between them. Hence, P–Ps are not just transient chimeric mobile elements recently created from recombination between phages and plasmids and some of them may have emerged a long time ago. Further work on the very heterogeneous communities of P–Ps that remained non-curated may reveal yet novel groups that will facilitate the study of the evolution of P–Ps.
Intriguingly, most tailed P–Ps in our dataset are Siphoviridae or Myoviridae, and few are Podoviridae. The reasons for this are unclear, but the current genome database does over-represent the first two classes of tailed phages (87). P–Ps can also be found in Tectiviridae opening the possibility of their presence in other types of poorly characterized phages. Inoviridae are known to replicate actively without inducing the lytic cycle, in which they resemble plasmids and P–Ps (88,89). However, these ssDNA phages replicate while actively producing and exporting virions, explaining why we chose to exclude them from this analysis. Hybrids between viruses and plasmids have also been reported in archaea (90,91). Two archaeal plasmids, one from Haloarcula sp. and the other one from Natrialba magadii (has a reported, closely-related halovirus (92)), were identified as P–P singletons by our models, further suggesting that some archaeal viruses are also P–Ps. Metagenomics based studies are uncovering many novel phage genomes and it will be interesting to assess how many of these are P–Ps.
P–Ps are phages and plasmids. Hence, one expects them to carry accessory traits from both. Indeed, some P–P groups have many homologs to phage genes, whereas others tend to have more homologs in plasmids. The study of the pangenomes of P–P groups revealed that phage homologs tend to be more conserved than plasmid homologs. In contrast, the latter tend to be more frequent in variable regions. As a result, even if there are on average more phage than plasmid homologs in P–Ps, the latter are more variable and may thus account for a large fraction of the genes providing adaptive phenotypes to bacterial hosts.
DATA AVAILABILITY
All genomes were taken from public databases. The necessary data are provided in the article and in the supplemental material. Any further requests e.g. on data processing can be sent to eugen.pfeifer@pasteur.fr.
Supplementary Material
ACKNOWLEDGEMENTS
The authors would like to thank Olaya Rendueles-Garcia, Antoine Frenoy and Charles Coluzzi for comments and suggestions. Moreover, many thanks to Jean Cury, Sophie Abby and Bertrand Néron for providing useful tools such as MacSyFinder and a pipeline for annotating plasmid functions.
Contributor Information
Eugen Pfeifer, Microbial Evolutionary Genomics, Institut Pasteur, CNRS, UMR3525, Paris 75015, France.
Jorge A Moura de Sousa, Microbial Evolutionary Genomics, Institut Pasteur, CNRS, UMR3525, Paris 75015, France.
Marie Touchon, Microbial Evolutionary Genomics, Institut Pasteur, CNRS, UMR3525, Paris 75015, France.
Eduardo P C Rocha, Microbial Evolutionary Genomics, Institut Pasteur, CNRS, UMR3525, Paris 75015, France.
SUPPLEMENTARY DATA
Supplementary Data are available at NAR Online.
FUNDING
ANR Labex IBEID [10-LABX-0062 to E.P.]; SALMOPROPHAGE [ANR-16-CE16-0029 to J.M.S.]; INCEPTION project [PIA/ANR-16-CONV-0005]; Fédération pour la Recherche Médicale [Equipe FRM/EQU201903007835]. Funding for open access charge: ANR Labex IBEID [10-LABX-0062].
Conflict of interest statement. None declared.
REFERENCES
- 1. Frost L.S., Leplae R., Summers A.O., Toussaint A.. Mobile genetic elements: the agents of open source evolution. Nat. Rev. Microbiol. 2005; 3:722–732. [DOI] [PubMed] [Google Scholar]
- 2. Touchon M., Moura de Sousa J.A., Rocha E.P.. Embracing the enemy: the diversification of microbial gene repertoires by phage-mediated horizontal gene transfer. Curr. Opin. Microbiol. 2017; 38:66–73. [DOI] [PubMed] [Google Scholar]
- 3. Chiang Y.N., Penadés J.R., Chen J.. Genetic transduction by phages and chromosomal islands: the new and noncanonical. PLoS Pathog. 2019; 15:e1007878. [DOI] [PMC free article] [PubMed] [Google Scholar]
- 4. Smillie C., Garcillán-Barcia M.P., Francia M.V., Rocha E.P.C., de la Cruz F. Mobility of plasmids. Microbiol. Mol. Biol. Rev. 2010; 74:434–452. [DOI] [PMC free article] [PubMed] [Google Scholar]
- 5. Gandon S. Why be temperate: lessons from bacteriophage λ. Trends Microbiol. 2016; 24:356–365. [DOI] [PubMed] [Google Scholar]
- 6. Cury J., Oliveira P.H., de la Cruz F., Rocha E.P.C.. Host range and genetic plasticity explain the coexistence of integrative and extrachromosomal mobile genetic elements. Mol. Biol. Evol. 2018; 35:2230–2239. [DOI] [PMC free article] [PubMed] [Google Scholar]
- 7. Łobocka M.B., Rose D.J., Plunkett G., Rusin M., Samojedny A., Lehnherr H., Yarmolinsky M.B., Blattner F.R.. Genome of bacteriophage P1. J. Bacteriol. 2004; 186:7032–7068. [DOI] [PMC free article] [PubMed] [Google Scholar]
- 8. Utter B., Deutsch D.R., Schuch R., Winer B.Y., Verratti K., Bishop-Lilly K., Sozhamannan S., Fischetti V.A.. Beyond the chromosome: the prevalence of unique extra-chromosomal bacteriophages with integrated virulence genes in pathogenic Staphylococcus aureus. PLoS One. 2014; 9:e100502. [DOI] [PMC free article] [PubMed] [Google Scholar]
- 9. Gilcrease E.B., Casjens S.R.. The genome sequence of Escherichia coli tailed phage D6 and the diversity of Enterobacteriales circular plasmid prophages. Virology. 2018; 515:203–214. [DOI] [PMC free article] [PubMed] [Google Scholar]
- 10. Ravin N.V., Svarchevsky A.N., Dehò G.. The anti-immunity system of phage–plasmid N15: identification of the antirepressor gene and its control by a small processed RNA. Mol. Microbiol. 1999; 34:980–994. [DOI] [PubMed] [Google Scholar]
- 11. Tabassum Khan N. Mechanisms of plasmid replication. J Proteomics Bioinform. 2017; 10:211–213. [Google Scholar]
- 12. Salje J. Plasmid segregation: how to survive as an extra piece of DNA. Crit. Rev. Biochem. Mol. 2010; 45:296–317. [DOI] [PubMed] [Google Scholar]
- 13. Sengupta M., Austin S.. Prevalence and significance of plasmid maintenance functions in the virulence plasmids of pathogenic bacteria. Infect. Immun. 2011; 79:2502–2509. [DOI] [PMC free article] [PubMed] [Google Scholar]
- 14. Ravin N.V. N15: The linear phage–plasmid. Plasmid. 2011; 65:102–109. [DOI] [PubMed] [Google Scholar]
- 15. Lindler L.E., Plano G.V., Burland V., Mayhew G.F., Blattner F.R.. Complete DNA sequence and detailed analysis of the Yersinia pestis KIM5 plasmid encoding murine toxin and capsular antigen. Infect. Immun. 1998; 66:5731–5742. [DOI] [PMC free article] [PubMed] [Google Scholar]
- 16. Venturini C., Zingali T., Wyrsch E.R., Bowring B., Iredell J., Partridge S.R., Djordjevic S.P.. Diversity of P1 phage-like elements in multidrug resistant Escherichia coli. Sci. Rep. 2019; 9:18861. [DOI] [PMC free article] [PubMed] [Google Scholar]
- 17. Bertani G. Studies on lysogenesis I.: the mode of phage liberation by lysogenic Escherichia coli. J. Bacteriol. 1951; 62:293–300. [DOI] [PMC free article] [PubMed] [Google Scholar]
- 18. Lennox E.S. Transduction of linked genetic characters of the host by bacteriophage P1. Virology. 1955; 1:190–206. [DOI] [PubMed] [Google Scholar]
- 19. Skorupski K., Sauer B., Sternberg N.. Faithful cleavage of the P1 packaging site (pac) requires two phage proteins, PacA and PacB, and two Escherichia coli proteins, IHF and HU. J. Mol. Biol. 1994; 243:268–282. [DOI] [PubMed] [Google Scholar]
- 20. Yarmolinsky M., Hoess R.. The legacy of Nat Sternberg: the genesis of Cre- lox technology. Annu. Rev. Viro. 2015; 2:25–40. [DOI] [PubMed] [Google Scholar]
- 21. McLellan M.A., Rosenthal N.A., Pinto A.R.. Cre-loxP-mediated recombination: general principles and experimental considerations. Curr. Protoc. Mouse Biol. 2017; 7:1–12. [DOI] [PubMed] [Google Scholar]
- 22. Ravin N.V. Replication and maintenance of linear phage–plasmid N15. Microbiol. Spectr. 2015; 3:PLAS-0032–2014. [DOI] [PubMed] [Google Scholar]
- 23. Knott S.E., Milsom S.A., Rothwell P.J.. The unusual linear plasmid generating systems of prokaryotes. Bacteriophages - Perspectives and Future. 2019; IntechOpen. [Google Scholar]
- 24. Hammerl J.A., Jäckel C., Funk E., Pinnau S., Mache C., Hertwig S.. The diverse genetic switch of enterobacterial and marine telomere phages. Bacteriophage. 2016; 6:e1148805. [DOI] [PMC free article] [PubMed] [Google Scholar]
- 25. Dedrick R.M., Mavrich T.N., Ng W.L., Cervantes Reyes J.C., Olm M.R., Rush R.E., Jacobs-Sera D., Russell D.A., Hatfull G.F.. Function, expression, specificity, diversity and incompatibility of actinobacteriophage parABS systems. Mol. Microbiol. 2016; 101:625–644. [DOI] [PMC free article] [PubMed] [Google Scholar]
- 26. Lan S.-F., Huang C.-H., Chang C.-H., Liao W.-C., Lin I.-H., Jian W.-N., Wu Y.-G., Chen S.-Y., Wong H.. Characterization of a new plasmid-like prophage in a pandemic Vibrio parahaemolyticus O3:K6 strain. Appl. Environ. Microbiol. 2009; 75:2659–2667. [DOI] [PMC free article] [PubMed] [Google Scholar]
- 27. Verheust C., Fornelos N., Mahillon J.. GIL16, a new gram-positive tectiviral phage related to the Bacillus thuringiensis GIL01 and the Bacillus cereus pBClin15 elements. J. Bacteriol. 2005; 187:1966–1973. [DOI] [PMC free article] [PubMed] [Google Scholar]
- 28. Myers G.S.A., Rasko D.A., Cheung J.K., Ravel J., Seshadri R., DeBoy R.T., Ren Q., Varga J., Awad M.M., Brinkac L.M.et al.. Skewed genomic variability in strains of the toxigenic bacterial pathogen Clostridium perfringens. Genome Res. 2006; 16:1031–1040. [DOI] [PMC free article] [PubMed] [Google Scholar]
- 29. Kim M., Kim S., Ryu S.. Complete genome sequence of bacteriophage SSU5 specific for Salmonella enterica serovar Typhimurium rough strains. J. Virol. 2012; 86:10894–10894. [DOI] [PMC free article] [PubMed] [Google Scholar]
- 30. Kim M., Kim S., Park B., Ryu S.. Core lipopolysaccharide-specific phage SSU5 as an auxiliary component of a phage cocktail for Salmonella biocontrol. Appl. Environ. Microbiol. 2014; 80:1026–1034. [DOI] [PMC free article] [PubMed] [Google Scholar]
- 31. Octavia S., Sara J., Lan R.. Characterization of a large novel phage-like plasmid in Salmonella enterica serovar Typhimurium. FEMS Microbiol. Lett. 2015; 362:fnv044. [DOI] [PubMed] [Google Scholar]
- 32. Kidgell C., Pickard D., Wain J., James K., Diem Nga L.T., Diep T.S., Levine M.M., O’Gaora P., Prentice M.B., Parkhill J.et al.. Characterisation and distribution of a cryptic Salmonella typhi plasmid pHCM2. Plasmid. 2002; 47:159–171. [DOI] [PubMed] [Google Scholar]
- 33. Falgenhauer L., Yao Y., Fritzenwanker M., Schmiedel J., Imirzalioglu C., Chakraborty T.. Complete genome sequence of phage-like plasmid pECOH89, encoding CTX-M-15. Genome Announc. 2014; 2:e00356-14. [DOI] [PMC free article] [PubMed] [Google Scholar]
- 34. Yang L., Li W., Jiang G.-Z., Zhang W.-H., Ding H.-Z., Liu Y.-H., Zeng Z.-L., Jiang H.-X.. Characterization of a P1-like bacteriophage carrying CTX-M-27 in Salmonella spp. resistant to third generation cephalosporins isolated from pork in China. Sci. Rep. 2017; 7:40710. [DOI] [PMC free article] [PubMed] [Google Scholar]
- 35. Santamaría R.I., Bustos P., Sepúlveda-Robles O., Lozano L., Rodríguez C., Fernández J.L., Juárez S., Kameyama L., Guarneros G., Dávila G.et al.. Narrow-host-range bacteriophages that infect Rhizobium etli associate with distinct genomic types. Appl. Environ. Microbiol. 2014; 80:446–454. [DOI] [PMC free article] [PubMed] [Google Scholar]
- 36. Hammerl J.A., Klein I., Appel B., Hertwig S.. Interplay between the temperate phages PY54 and N15, linear plasmid prophages with covalently closed ends. J. Bacteriol. 2007; 189:8366–8370. [DOI] [PMC free article] [PubMed] [Google Scholar]
- 37. O’Leary N.A., Wright M.W., Brister J.R., Ciufo S., Haddad D., McVeigh R., Rajput B., Robbertse B., Smith-White B., Ako-Adjei D.et al.. Reference sequence (RefSeq) database at NCBI: current status, taxonomic expansion, and functional annotation. Nucleic Acids Res. 2016; 44:D733–D745. [DOI] [PMC free article] [PubMed] [Google Scholar]
- 38. Hatcher E.L., Zhdanov S.A., Bao Y., Blinkova O., Nawrocki E.P., Ostapchuck Y., Schäffer A.A., Brister J.R.. Virus variation resource - improved response to emergent viral outbreaks. Nucleic Acids Res. 2017; 45:D482–D490. [DOI] [PMC free article] [PubMed] [Google Scholar]
- 39. Eddy S.R. Accelerated Profile HMM Searches. PLoS Comput. Biol. 2011; 7:e1002195. [DOI] [PMC free article] [PubMed] [Google Scholar]
- 40. El-Gebali S., Mistry J., Bateman A., Eddy S.R., Luciani A., Potter S.C., Qureshi M., Richardson L.J., Salazar G.A., Smart A.et al.. The Pfam protein families database in 2019. Nucleic Acids Res. 2019; 47:D427–D432. [DOI] [PMC free article] [PubMed] [Google Scholar]
- 41. Haft D.H., Loftus B.J., Richardson D.L., Yang F., Eisen J.A., Paulsen I.T., White O.. TIGRFAMs: a protein family resource for the functional identification of proteins. Nucleic Acids Res. 2001; 29:41–43. [DOI] [PMC free article] [PubMed] [Google Scholar]
- 42. Huerta-Cepas J., Szklarczyk D., Heller D., Hernández-Plaza A., Forslund S.K., Cook H., Mende D.R., Letunic I., Rattei T., Jensen L.J.et al.. eggNOG 5.0: a hierarchical, functionally and phylogenetically annotated orthology resource based on 5090 organisms and 2502 viruses. Nucleic Acids Res. 2019; 47:D309–D314. [DOI] [PMC free article] [PubMed] [Google Scholar]
- 43. Grazziotin A.L., Koonin E.V., Kristensen D.M.. Prokaryotic virus orthologous groups (pVOGs): a resource for comparative genomics and protein family annotation. Nucleic Acids Res. 2017; 45:D491–D498. [DOI] [PMC free article] [PubMed] [Google Scholar]
- 44. Abby S.S., Néron B., Ménager H., Touchon M., Rocha E.P.C.. MacSyFinder: A program to mine genomes for molecular systems with an application to CRISPR-Cas systems. PLoS One. 2014; 9:e110726. [DOI] [PMC free article] [PubMed] [Google Scholar]
- 45. Fouts D.E. Phage_Finder: Automated identification and classification of prophage regions in complete bacterial genome sequences. Nucleic Acids Res. 2006; 34:5839–5851. [DOI] [PMC free article] [PubMed] [Google Scholar]
- 46. Söding J. Protein homology detection by HMM–HMM comparison. Bioinformatics. 2005; 21:951–960. [DOI] [PubMed] [Google Scholar]
- 47. Blondel V.D., Guillaume J.-L., Lambiotte R., Lefebvre E.. Fast unfolding of communities in large networks. J. Stat. Mech. 2008; 2008:P10008. [Google Scholar]
- 48. Harrison P.W., Lower R.P.J., Kim N.K.D., Young J.P.W. Introducing the bacterial ‘chromid’: not a chromosome, not a plasmid. Trends Microbiol. 2010; 18:141–148. [DOI] [PubMed] [Google Scholar]
- 49. Cury J., Touchon M., Rocha E.P.C.. Integrative and conjugative elements and their hosts: composition, distribution and organization. Nucleic Acids Res. 2017; 45:8943–8956. [DOI] [PMC free article] [PubMed] [Google Scholar]
- 50. Cury J., Abby S.S., Doppelt-Azeroual O., Néron B., Rocha E.P.C.. Identifying conjugative plasmids and integrative conjugative elements with CONJscan. Methods Mol. Biol. 2020; 2075:265–283. [DOI] [PubMed] [Google Scholar]
- 51. Arndt D., Grant J.R., Marcu A., Sajed T., Pon A., Liang Y., Wishart D.S.. PHASTER: a better, faster version of the PHAST phage search tool. Nucleic Acids Res. 2016; 44:W16–W21. [DOI] [PMC free article] [PubMed] [Google Scholar]
- 52. Roux S., Enault F., Hurwitz B.L., Sullivan M.B.. VirSorter: mining viral signal from microbial genomic data. PeerJ. 2015; 3:e985. [DOI] [PMC free article] [PubMed] [Google Scholar]
- 53. Wright M.N., Ziegler A.. ranger: a fast implementation of random forests for high dimensional data in C++ and R. J. Stat. Softw. 2017; 77:i01. [Google Scholar]
- 54. Robin X., Turck N., Hainard A., Tiberti N., Lisacek F., Sanchez J.-C., Müller M.. pROC: an open-source package for R and S+ to analyze and compare ROC curves. BMC Bioinformatics. 2011; 12:77. [DOI] [PMC free article] [PubMed] [Google Scholar]
- 55. Steinegger M., Söding J.. MMseqs2 enables sensitive protein sequence searching for the analysis of massive data sets. Nat. Biotechnol. 2017; 35:1026–1028. [DOI] [PubMed] [Google Scholar]
- 56. Bobay L.-M., Rocha E.P.C., Touchon M.. The adaptation of temperate bacteriophages to their host genomes. Mol. Biol. Evol. 2013; 30:737–751. [DOI] [PMC free article] [PubMed] [Google Scholar]
- 57. Christensen A.P. NetworkToolbox: methods and measures for brain, cognitive, and psychometric network analysis in R. R J. 2018; 10:422–439. [Google Scholar]
- 58. Carattoli A., Zankari E., García-Fernández A., Voldby Larsen M., Lund O., Villa L., Møller Aarestrup F., Hasman H.. In silico detection and typing of plasmids using PlasmidFinder and plasmid multilocus sequence typing. Antimicrob. Agents Chemother. 2014; 58:3895–3903. [DOI] [PMC free article] [PubMed] [Google Scholar]
- 59. Gautreau G., Bazin A., Gachet M., Planel R., Burlot L., Dubois M., Perrin A., Médigue C., Calteau A., Cruveiller S.et al.. PPanGGOLiN: depicting microbial diversity via a partitioned pangenome graph. PLoS Comput. Biol. 2020; 16:e1007732. [DOI] [PMC free article] [PubMed] [Google Scholar]
- 60. Zhang C., Feng Y., Liu F., Jiang H., Qu Z., Lei M., Wang J., Zhang B., Hu Y., Ding J.et al.. A phage-like IncY plasmid carrying the mcr-1 gene in Escherichia coli from a pig farm in China. Antimicrob. Agents Chemother. 2017; 61:e02035-16. [DOI] [PMC free article] [PubMed] [Google Scholar]
- 61. Strömsten N.J., Benson S.D., Burnett R.M., Bamford D.H., Bamford J.K.H.. The Bacillus thuringiensis linear double-stranded DNA phage Bam35, which is highly similar to the Bacillus cereus linear plasmid pBClin15, has a prophage state. J. Bacteriol. 2003; 185:6985–6989. [DOI] [PMC free article] [PubMed] [Google Scholar]
- 62. Miller R.V., Pemberton J.M., Clark A.J.. Prophage F116: evidence for extrachromosomal location in Pseudomonas aeruginosa strain PAO. J. Virol. 1977; 22:844–847. [DOI] [PMC free article] [PubMed] [Google Scholar]
- 63. Byrne M., Kropinski A.M.. The genome of the Pseudomonas aeruginosa generalized transducing bacteriophage F116. Gene. 2005; 346:187–194. [DOI] [PubMed] [Google Scholar]
- 64. Pourcel C., Midoux C., Hauck Y., Vergnaud G., Latino L.. Large preferred region for packaging of bacterial DNA by phiC725A, a novel Pseudomonas aeruginosa F116-Like bacteriophage. PLoS One. 2017; 12:e0169684. [DOI] [PMC free article] [PubMed] [Google Scholar]
- 65. Goerke C., Wirtz C., Flückiger U., Wolz C.. Extensive phage dynamics in Staphylococcus aureus contributes to adaptation to the human host during infection. Mol. Microbiol. 2006; 61:1673–1685. [DOI] [PubMed] [Google Scholar]
- 66. Casjens S.R., Gilcrease E.B., Vujadinovic M., Mongodin E.F., Luft B.J., Schutzer S.E., Fraser C.M., Qiu W.-G.. Plasmid diversity and phylogenetic consistency in the Lyme disease agent Borrelia burgdorferi. BMC Genomics. 2017; 18:165. [DOI] [PMC free article] [PubMed] [Google Scholar]
- 67. Eggers C.H., Kimmel B.J., Bono J.L., Elias A.F., Rosa P., Samuels D.S.. Transduction by φBB-1, a bacteriophage of Borrelia burgdorferi. J. Bacteriol. 2001; 183:4771–4778. [DOI] [PMC free article] [PubMed] [Google Scholar]
- 68. Wetzel K.S., Aull H.G., Zack K.M., Garlena R.A., Hatfull G.F.. Protein-mediated and RNA-based origins of replication of extrachromosomal mycobacterial prophages. mBio. 2020; 11:e00385-20. [DOI] [PMC free article] [PubMed] [Google Scholar]
- 69. Dutilh B.E., Cassman N., McNair K., Sanchez S.E., Silva G.G.Z., Boling L., Barr J.J., Speth D.R., Seguritan V., Aziz R.K.et al.. A highly abundant bacteriophage discovered in the unknown sequences of human faecal metagenomes. Nat. Commun. 2014; 5:4498. [DOI] [PMC free article] [PubMed] [Google Scholar]
- 70. Shkoporov A.N., Khokhlova E.V., Fitzgerald C.B., Stockdale S.R., Draper L.A., Ross R.P., Hill C.. ΦCrAss001 represents the most abundant bacteriophage family in the human gut and infects Bacteroides intestinalis. Nat. Commun. 2018; 9:4781. [DOI] [PMC free article] [PubMed] [Google Scholar]
- 71. Shintani M., Sanchez Z.K., Kimbara K.. Genomics of microbial plasmids: classification and identification based on replication and transfer systems and host taxonomy. Front Microbiol. 2015; 6:242. [DOI] [PMC free article] [PubMed] [Google Scholar]
- 72. Dziewit L., Pyzik A., Szuplewska M., Matlakowska R., Mielnicki S., Wibberg D., Schlüter A., Pühler A., Bartosik D.. Diversity and role of plasmids in adaptation of bacteria inhabiting the Lubin copper mine in Poland, an environment rich in heavy metals. Front. Microbiol. 2015; 6:152. [DOI] [PMC free article] [PubMed] [Google Scholar]
- 73. Allen W.J., Phan G., Waksman G.. Pilus biogenesis at the outer membrane of Gram-negative bacterial pathogens. Curr. Opin. Struct. Biol. 2012; 22:500–506. [DOI] [PubMed] [Google Scholar]
- 74. Smeesters P.R., Drèze P.-A., Bousbata S., Parikka K.J., Timmery S., Hu X., Perez-Morga D., Deghorain M., Toussaint A., Mahillon J.et al.. Characterization of a novel temperate phage originating from a cereulide-producing Bacillus cereus strain. Res. Microbiol. 2011; 162:446–459. [DOI] [PubMed] [Google Scholar]
- 75. Lynch K.H., Stothard P., Dennis J.J.. Genomic analysis and relatedness of P2-like phages of the Burkholderia cepacia complex. BMC Genomics. 2010; 11:599. [DOI] [PMC free article] [PubMed] [Google Scholar]
- 76. Chen M., Zhang L., Xin S., Yao H., Lu C., Zhang W.. Inducible prophage mutant of Escherichia coli can lyse new host and the key sites of receptor recognition identification. Front. Microbiol. 2017; 8:147. [DOI] [PMC free article] [PubMed] [Google Scholar]
- 77. Lee J.-H., Shin H., Son B., Heu S., Ryu S.. Characterization and complete genome sequence of a virulent bacteriophage B4 infecting food-borne pathogenic Bacillus cereus. Arch. Virol. 2013; 158:2101–2108. [DOI] [PubMed] [Google Scholar]
- 78. Gillis A., Mahillon J.. Phages preying on Bacillus anthracis, Bacillus cereus, and Bacillus thuringiensis: Past, present and future. Viruses. 2014; 6:2623–2672. [DOI] [PMC free article] [PubMed] [Google Scholar]
- 79. Klumpp J., Lavigne R., Loessner M.J., Ackermann H.-W.. The SPO1-related bacteriophages. Arch. Virol. 2010; 155:1547–1561. [DOI] [PubMed] [Google Scholar]
- 80. El-Arabi T.F., Griffiths M.W., She Y.-M., Villegas A., Lingohr E.J., Kropinski A.M.. Genome sequence and analysis of a broad-host range lytic bacteriophage that infects the Bacillus cereus group. Virol J. 2013; 10:48. [DOI] [PMC free article] [PubMed] [Google Scholar]
- 81. Eggers C.H., Samuels D.S.. Molecular evidence for a new bacteriophage of Borrelia burgdorferi. J. Bacteriol. 1999; 181:7308–7313. [DOI] [PMC free article] [PubMed] [Google Scholar]
- 82. Casjens S., Palmer N., Vugt R.V., Huang W.M., Stevenson B., Rosa P., Lathigra R., Sutton G., Peterson J., Dodson R.J.et al.. A bacterial genome in flux: the twelve linear and nine circular extrachromosomal DNAs in an infectious isolate of the Lyme disease spirochete Borrelia burgdorferi. Mol. Microbiol. 2000; 35:490–516. [DOI] [PubMed] [Google Scholar]
- 83. Mavrich T.N., Hatfull G.F.. Evolution of superinfection immunity in cluster A mycobacteriophages. mBio. 2019; 10:e00971-19. [DOI] [PMC free article] [PubMed] [Google Scholar]
- 84. Pesesky M.W., Tilley R., Beck D.A.C.. Mosaic plasmids are abundant and unevenly distributed across prokaryotic taxa. Plasmid. 2019; 102:10–18. [DOI] [PubMed] [Google Scholar]
- 85. Miller R.V., Pemberton J.M., Richards K.E.. F116, D3 and G101: temperate bacteriophages of Pseudomonas aeruginosa. Virology. 1974; 59:566–569. [DOI] [PubMed] [Google Scholar]
- 86. Clark A.J., Pontes M., Jones T., Dale C.. A possible heterodimeric prophage-like element in the genome of the insect endosymbiont Sodalis glossinidius. J. Bacteriol. 2007; 189:2949–2951. [DOI] [PMC free article] [PubMed] [Google Scholar]
- 87. Ackermann H.-W., Prangishvili D. Prokaryote viruses studied by electron microscopy. Arch. Virol. 2012; 157:1843–1849. [DOI] [PubMed] [Google Scholar]
- 88. Krupovic M. Networks of evolutionary interactions underlying the polyphyletic origin of ssDNA viruses. Curr. Opin. Virol. 2013; 3:578–586. [DOI] [PubMed] [Google Scholar]
- 89. Fauquet C.M. The diversity of single stranded DNA viruses. Biodiversity. 2006; 7:38–44. [Google Scholar]
- 90. Arnold H.P., She Q., Phan H., Stedman K., Prangishvili D., Holz I., Kristjansson J.K., Garrett R., Zillig W.. The genetic element pSSVx of the extremely thermophilic crenarchaeon Sulfolobus is a hybrid between a plasmid and a virus. Mol. Microbiol. 1999; 34:217–226. [DOI] [PubMed] [Google Scholar]
- 91. Iranzo J., Koonin E.V., Prangishvili D., Krupovic M.. Bipartite network analysis of the archaeal virosphere: evolutionary connections between viruses and capsidless mobile elements. J. Virol. 2016; 90:11043–11055. [DOI] [PMC free article] [PubMed] [Google Scholar]
- 92. Siddaramappa S., Challacombe J.F., DeCastro R.E., Pfeiffer F., Sastre D.E., Giménez M.I., Paggi R.A., Detter J.C., Davenport K.W., Goodwin L.A.et al.. A comparative genomics perspective on the genetic content of the alkaliphilic haloarchaeon Natrialba magadii ATCC 43099T. BMC Genomics. 2012; 13:165. [DOI] [PMC free article] [PubMed] [Google Scholar]
- 93. Guy L., Roat Kultima J., Andersson S.G.E.. genoPlotR: comparative gene and genome visualization in R. Bioinformatics. 2010; 26:2334–2335. [DOI] [PMC free article] [PubMed] [Google Scholar]
Associated Data
This section collects any data citations, data availability statements, or supplementary materials included in this article.
Supplementary Materials
Data Availability Statement
All genomes were taken from public databases. The necessary data are provided in the article and in the supplemental material. Any further requests e.g. on data processing can be sent to eugen.pfeifer@pasteur.fr.