

Abstract
Background:
There is a great concern on potential adverse effects of exposure to perfluorooctane sulfonate (PFOS) in sensitive subpopulations, such as pregnant women, fetuses, and neonates, due to its reported transplacental and lactational transfer and reproductive and developmental toxicities in animals and humans.
Objectives:
This study aimed to develop a gestational and lactational physiologically based pharmacokinetic (PBPK) model in rats and humans for PFOS to aid risk assessment in sensitive human subpopulations.
Methods:
Based upon existing PBPK models for PFOS, the present model addressed a data gap of including a physiologically based description of basolateral and apical membrane transporter–mediated renal reabsorption and excretion in kidneys during gestation and lactation. The model was calibrated with published rat toxicokinetic and human biomonitoring data and was independently evaluated with separate data. Monte Carlo simulation was used to address the interindividual variability.
Results:
Model simulations were generally within 2-fold of observed PFOS concentrations in maternal/fetal/neonatal plasma and liver in rats and humans. Estimated fifth percentile human equivalent doses (HEDs) based on selected critical toxicity studies in rats following U.S. Environmental Protection Agency (EPA) guidelines ranged from 0.08 to . These values are lower than the HEDs estimated in U.S. EPA guidance () using an empirical toxicokinetic model in adults.
Conclusions:
The results support the importance of renal reabsorption/excretion during pregnancy and lactation in PFOS dosimetry and suggest that the derivation of health-based toxicity values based on developmental toxicity studies should consider gestational/lactational dosimetry estimated from a life stage-appropriate PBPK model. This study provides a quantitative tool to aid risk reevaluation of PFOS, especially in sensitive human subpopulations, and it provides a basis for extrapolating to other per- and polyfluoroalkyl substances (PFAS). All model codes and detailed tutorials are provided in the Supplemental Materials to allow readers to reproduce our results and to use this model. https://doi.org/10.1289/EHP7671
Introduction
Perfluorooctane sulfonate (PFOS) is a synthetic chemical that has been widely used in consumer and industrial products over 60 y since the 1950s. It can also be generated by the degradation of a large group of related chemicals, such as fluorochemical materials and precursor compounds (Lau et al. 2007). PFOS has been detected globally in the environment (Giesy and Kannan 2002), wildlife (Giesy and Kannan 2001), and serum samples in various human populations throughout the world (Kannan et al. 2004). In the general U.S. population, more than 98% of the population has measurable levels of PFOS in serum samples from the 1999–2000 (Calafat et al. 2007a), 2003–2004 (Calafat et al. 2007b), and 2013–2014 National Health and Nutrition Examination Surveys (NHANES) (Calafat et al. 2019). Despite the fact that the use and production of PFOS have been phased out in the United States since 2002 (U.S. EPA 2009; FDA 2017), there is still a great concern regarding its human health risk because of environmental persistence (Giesy and Kannan 2002), bioaccumulation (Giesy and Kannan 2001), long half-life in humans (3.3–6.9 y) (Olsen et al. 2007), and reported toxicity in animals and humans (Darrow et al. 2013; Feng et al. 2015; Gallo et al. 2012; Peden-Adams et al. 2008; Takacs and Abbott 2007; Uhl et al. 2013). Exposure to PFOS during pregnancy and lactation is of particular concern because of its frequent detection in the maternal plasma and umbilical cord blood (Beesoon et al. 2011; Cariou et al. 2015; Chen et al. 2017; Fei et al. 2007; Fromme et al. 2010; Gützkow et al. 2012; Inoue et al. 2004a; Kato et al. 2014; Lee et al. 2013; Mamsen et al. 2017, 2019; Midasch et al. 2007; Monroy et al. 2008; Yang et al. 2016; Zhang et al. 2013b) and breast milk (Cariou et al. 2015; Kim et al. 2011; Lee et al. 2018).
In recent risk assessment reports from U.S. Environmental Protection Agency (EPA) and European Food Safety Authority (EFSA), developmental toxicities were considered as the most sensitive end points for PFOS (EFSA CONTAM Panel 2018; U.S. EPA 2016). Specifically, the 2016 U.S. EPA Health Effects Support Document for Perfluorooctane Sulfonate (U.S. EPA 2016) included several developmental toxicity studies in rodents as a basis for the derivation of the reference dose (RfD). The most sensitive end points in these studies are decreased pup body weight (BW) with a no observed adverse effect level (NOAEL) of (Luebker et al. 2005a), developmental neurotoxicity (i.e., increased motor activity and decreased habituation) with a NOAEL of (Butenhoff et al. 2009), and decreased pup survival with a NOAEL of (Lau et al. 2003). Human epidemiological studies have also reported potential associations between prenatal and early life PFOS exposure with various adverse outcomes. There is relatively stronger evidence for the potential effects of PFOS on lower vaccine effectiveness (Grandjean et al. 2012) and dyslipidemia (Lin et al. 2019; Rappazzo et al. 2017; Sunderland et al. 2019), yet findings are mixed with some studies reporting no associations for other health outcomes, including reduced birth weight (Dzierlenga et al. 2020), allergies (Impinen et al. 2018), asthma (Humblet et al. 2014), and cognitive functions (Skogheim et al. 2020). Because PFOS is known to have substantial interspecies toxicokinetic (TK) differences, extrapolating dosimetry and toxicity from animals to the human population and considering the TK changes during different life stages are critical in its risk assessment, but they are difficult and of high uncertainty. This can be addressed through a physiologically based pharmacokinetic (PBPK) model that is validated across species and different life stages.
During pregnancy, significant alterations in serum PFOS levels compared with nonpregnant levels have been reported (Glynn et al. 2012; Nielsen et al. 2020; Pan et al. 2017), a finding which has been partially attributed to the changes of physiological parameters and renal mechanisms (Han et al. 2012; Loccisano et al. 2013; Verner et al. 2015). Renal mechanisms influence the serum PFOS levels mainly through excretion mediated by the glomerular filtration rate (GFR) and renal tubular reabsorption and excretion (Han et al. 2012). A previous human PBPK model for PFOS showed that model-predicted PFOS concentrations were lower and might be caused by a faster excretion due to a higher GFR during pregnancy (Loccisano et al. 2013). Renal reabsorption and excretion of PFOS are mainly governed by the expression of organic anion transporters (OATs) on the apical and basolateral membranes of the proximal tubule cells (PTCs) (Harada et al. 2005; Yang et al. 2010), whose activity might also be altered during pregnancy and lactation. Past modeling studies have demonstrated the potential role of saturable renal reabsorption in the TK behavior for PFOS and its structurally similar compound, perfluorooctanoic acid (PFOA), in rodents (Chou and Lin 2019; Harris and Barton 2008; Kieskamp et al. 2018; Loccisano et al. 2012a; Tan et al. 2008; Worley and Fisher 2015), monkeys (Andersen et al. 2006; Chou and Lin 2019; Tan et al. 2008), and humans (Brochot et al. 2019; Chou and Lin 2019; Fàbrega et al. 2014; Loccisano et al. 2013; Ngueta et al. 2017; Rovira et al. 2019; Ruark et al. 2017; Verner et al. 2015; Worley et al. 2017; Wu et al. 2015). For example, Loccisano et al. (2011) developed a basic PBPK model that was able to describe the TK behavior of PFOA and PFOS and was subsequently expanded to include the simulation during pregnancy (Verner et al. 2015) and lactation (Loccisano et al. 2012b, 2013). In these models, only a single transporter [i.e., organic anion transporting protein 1a1 (OATP1a1)] was used to describe the saturable reabsorption of PFOA and PFOS from the filtrate compartment back into the kidney, but the transporter-mediated renal excretion has not been parameterized in their models. Considering this limitation, Worley et al. (2017) and Worley and Fisher (2015) included both the renal reabsorption and excretion pathways of PFOA by accounting for transporter activities in proximal tubule apical (i.e., OATP1a1) and basolateral sides (i.e., OAT1 and OAT3) from in vitro studies (Nakagawa et al. 2008; Weaver et al. 2010) to simulate the process of reabsorption/excretion kinetics of PFOA in a rat PBPK model. Subsequently, the rat model was extrapolated to humans to describe the TK behavior of PFOA following drinking-water exposure (Worley et al. 2017). Although previous studies have made great efforts, none has accounted for the process of transporter-mediated renal reabsorption and excretion for PFOS during gestation and lactation.
Based upon past modeling efforts, we expanded the PFOA PBPK model by Worley et al. (2017) and Worley and Fisher (2015) to develop a comprehensive PBPK model for PFOS during adulthood in multiple species, including mice, rats, monkeys, and humans, within a Bayesian framework (Chou and Lin 2019). This model has been integrated with a newly developed dose–response model within a Bayesian framework, thereby creating a probabilistic risk assessment approach that has been shown to be useful in the risk assessment of PFOS (Chou and Lin 2020). This model can characterize the uncertainties across and within species to provide data-driven parameters in renal transporter kinetics, and it can also serve as a basis for extrapolating to other life stages such as gestation and lactation to support risk assessment of sensitive subpopulations. Based on our adulthood PBPK model, the objective of this study was to develop a gestational and lactational PBPK model for PFOS during gestation and lactation in rats and humans that can address the abovementioned limitation of prior PBPK modeling efforts for PFOS. Specifically, because of the important role that renal transporters play in the TK behavior of PFOS during pregnancy, we included a data-driven physiologically based description of renal reabsorption and excretion pathways in the present model. Monte Carlo (MC) simulations were also incorporated into the model to evaluate the uncertainty and variability of parameters on PFOS dosimetry during pregnancy and lactation. This model was then applied to predict internal dosimetry relevant to risk assessment for reducing the uncertainty of extrapolation from animals to humans in the derivation of acceptable exposure levels during gestation and lactation. All model code and raw data, as well as detailed tutorials on how to run different PBPK analyses, are provided in the Supplemental Zipped file of the Supplemental Materials to enable replication of our results and facilitate the application and extrapolation of this model to other PFAS chemicals.
Methods
Selected Experimental Studies
Animal experimental data.
Four animal experimental studies were available and used for model development and evaluation (Table 1). In the first study (Thibodeaux et al. 2003), Sprague-Dawley rats were orally administered 1, 2, 3, 5, or PFOS from gestational day (GD) 2 through GD20. Blood samples were collected from the dams on GD7, GD14, and GD21 for PFOS analysis. On GD21, the dams were sacrificed and liver and blood samples were collected from both dams and fetuses. The second study was a developmental neurotoxicity study (Chang et al. 2009). In that study, pregnant Sprague-Dawley rats were given daily oral doses of PFOS at 0.1, 0.3, or from GD0 (the day of confirmed mating) through postnatal day (PND) 20. Blood and tissue samples from dams and pups were collected on PND4, PND21, and PND72. To determine the PFOS concentration in the blood and liver samples of pregnant rats and fetuses at the end of gestation, an additional group of pregnant rats were treated with 0.1, 0.3, or PFOS from GD0 through GD19 and sacrificed on GD20. The third study was a cross-foster and dose–response study in the rat (Luebker et al. 2005b). Briefly, male and female Sprague-Dawley rats were administrated by oral gavage with 0.1, 0.4, 0.8, 1, 1.2, 1.6, 2, or PFOS for 6 wk before mating and during mating (maximum of 14 d) and subsequently the female rats were dosed continuously from GD0 to PND4. Serum and urine samples during pregnancy (GD1, GD7, GD15, and GD21) were taken from the dams and fetuses from the dose groups of 0.1, 0.4, 1.6, and , whereas the blood samples during lactation (PND5) were sampled from the dose groups of 0.4, 0.8, 1, 1.2, 1.6, and . The liver samples of dams and fetuses/pups were obtained only at the end of gestation (GD21) from the dose groups of 0.1, 0.4, 1.6, and and on PND5 from 0.4, 1.6, and dose groups. The fourth study was a companion study of Luebker et al. (2005b) using the dosing regimen of 0.1, 0.4, 1.6, and to conduct a two-generation reproduction and cross-foster experiment (Luebker et al. 2005a). In that study, blood and liver samples were taken from the dams on PND21, and only liver samples were taken from pups on PND21.
Table 1.
Summary of pharmacokinetic studies in rats and human biomonitoring studies used for calibration and evaluation of the PBPK model.
| Reference/type of study | Dose (mg/kg per day)/population | Matrix (time for which the concentration was measured) | Purpose |
|---|---|---|---|
| Sprague-Dawley rat | |||
| Thibodeaux et al. 2003 | 1, 2, 3, 5, 10 | MP (GD7, GD14, GD21), ML (GD21), FL (GD21) | Calibration |
| Chang et al. 2009 | 0.1, 0.3, 1 | MP (PND4, PND21, PND72), NP (PND4, PND21, PND72), NL (PND4, PND21, PND72) | Calibration |
| Chang et al. 2009 | 0.1, 0.3, 1 | MP (GD20), NP (GD20), ML (GD20), NL (GD20) | Evaluation |
| Luebker et al. 2005b | 0.1, 0.4, 0.8, 1, 1.2, 1.6, 2, 3.2 | MP (GD1, GD7, GD15, GD21, PND5), ML (GD21), NP (GD21, PND5) | Evaluation |
| Luebker et al. 2005a | 0.1, 0.4, 1.6, 3.2 | MP (PND21), ML (PND21), NL (PND21) | Evaluation |
| Human biomonitoring | |||
| Gestational | |||
| Inoue et al. 2004a | Japanese | MP (GA39, GA40), CB (GA39, GA40) | Calibration |
| Fei et al. 2007 | Danish | MP (GA12, GA40), CB (GA40) | Calibration |
| Kato et al. 2014 | American | MP (GA16, GA39), CB (GA39) | Calibration |
| Pan et al. 2017 | Chinese | MP (GA13, GA26, GA38), CB (GA39, GA40) | Calibration |
| Mamsen et al. 2019 | Sweden | MP(GA9, GA25, GA37), Pla (GA9, GA25, GA37), FL (GA9, GA25, GA37) | Calibration |
| Midasch et al. 2007 | German | MP (GA39, GA40), CB (GA39, GA40) | Calibration |
| Monroy et al. 2008 | German | MP (GA39, GA40), CB (GA39, GA40) | Evaluation |
| Fromme et al. 2010 | German | MP (GA39, GA40), CB (GA39, GA40) | Evaluation |
| Gützkow et al. 2012 | Norwegian | MP (GA39, GA40), CB (GA39, GA40) | Evaluation |
| Lee et al. 2013 | South Korean | MP (GA39, GA40), CB (GA39, GA40) | Evaluation |
| Zhang et al. 2013b | Chinese | MP (GA16, 39), CB (GA39), Pla (GA39) | Evaluation |
| Cariou et al. 2015 | French | MP (GA39, GA40), CB (GA39, GA40), Milk (GA39) | Evaluation |
| Yang et al. 2016 | Chinese | MP (GA39, GA40), CB (GA39, GA40) | Evaluation |
| Chen et al. 2017 | Chinese | MP (GA39, GA40), CB (GA39, GA40), Pla (GA39, GA40) | Evaluation |
| Mamsen et al. 2017 | Danish | MP (GA7), Pla (GA7), FO (GA7) | Evaluation |
| Lactational | |||
| Kärrman et al. 2007 | Swedish | MP (3 wk postpartum), Milk (3 wk postpartum) | Calibration |
| von Ehrenstein et al. 2009 | American | MP (6 wk and 13 wk postpartum) | Calibration |
| Fromme et al. 2010 | German | MP (6 months postpartum), NP (6 months postpartum) | Calibration |
| Lee et al. 2018 | South Korean | Milk (1, 2, 4, and 13 wk postpartum) | Calibration |
| Kim et al. 2011 | South Korean | Milk (1 wk postpartum) | Evaluation |
| Liu et al. 2011 | Chinese | MP (1 wk postpartum), Milk (1 wk postpartum) | Evaluation |
Note: All graphic pharmacokinetic data and human biomonitoring data were extracted from selected studies by using WebPlotDigitizer (version 4.10; https://automeris.io/WebPlotDigitizer/). CB, cord blood; FL, fetal liver; FO, fetal organs; GA, gestational age by week; GD, gestational day; ML, maternal liver; MP, maternal plasma; NL, neonatal liver; NP, neonatal plasma; PBPK, physiologically based pharmacokinetic; Pla, placenta; PND, postnatal day.
Human biomonitoring data.
Multiple human biomonitoring studies with the maternal plasma, cord blood, milk, and fetal tissue samples collected at different time points during gestation and lactation from different countries were used for model calibration (Fei et al. 2007; Fromme et al. 2009; Inoue et al. 2004a; Kärrman et al. 2007; Kato et al. 2014; Lee et al. 2018; Mamsen et al. 2019; Midasch et al. 2007; Pan et al. 2017; von Ehrenstein et al. 2009) and evaluation (Cariou et al. 2015; Chen et al. 2017; Fromme et al. 2010; Gützkow et al. 2012; Kim et al. 2011; Lee et al. 2013; Liu et al. 2011; Mamsen et al. 2017; Monroy et al. 2008; Yang et al. 2016; Zhang et al. 2013b). Specifically, the studies of Midasch et al. (2007), Mamsen et al. (2019), Kato et al. (2014), Inoue et al. (2004a), Pan et al. (2017), and Fei et al. (2007) that reported PFOS concentration data in maternal plasma and placental and fetal tissues taken at different time points during pregnancy including first, second, and third trimesters were used for model calibration in the gestational model. For the lactational model, if the studies reported PFOS concentrations in maternal plasma after delivery, cord blood or neonatal plasma after birth, and monthly breast milk samples, the data sets were included in the lactational model calibration (Fromme et al. 2010; Kärrman et al. 2007; Lee et al. 2018; von Ehrenstein et al. 2009). Other studies with sparse data, such as one or very few data points during pregnancy or lactation were used for evaluation of the gestational (Cariou et al. 2015; Chen et al. 2017; Fromme et al. 2010; Gützkow et al. 2012; Lee et al. 2013; Mamsen et al. 2017; Monroy et al. 2008; Yang et al. 2016; Zhang et al. 2013b) and lactational models (Kim et al. 2011; Liu et al. 2011).
Model Development
Overview.
The published PBPK model for PFOS in adult male rats and humans (Chou and Lin 2019) was used as a basis to extrapolate to adult females (prepregnant) and then to other life stages (i.e., gestation and lactation). Based on prior modeling studies (Chou and Lin 2019; Worley et al. 2017; Worley and Fisher 2015), a physiologically based description of basolateral and apical transporters associated with renal reabsorption and excretion was included in the prepregnant, gestational, and lactational models. Because PFOS is very stable in the body and the environment, metabolism was not included in our model; this approach is consistent with earlier PBPK studies for PFOA and PFOS (Loccisano et al. 2012a, 2012b, 2013; Worley et al. 2017; Worley and Fisher 2015). The equations below, along with the parameter values in Table 2 and Tables S1–S6, specify the PFOS PBPK model in rats and humans during gestation and lactation. Key equations used in the PBPK model are described below.
Table 2.
Chemical parameters for the gestational and lactational PBPK models for PFOS in rats and humans.
| Parameters | Units | Rats | Humans | ||||
|---|---|---|---|---|---|---|---|
| Before pregnancy | Pregnant | Lactating | Before pregnancy | Pregnant | Lactating | ||
| Plasma protein binding | |||||||
| Free | Unitless | 0.09a | 0.019b | 0.0037b | 0.014c | 0.0027b | 0.037b |
| Absorption | |||||||
| K0C | 1/h per | 1a | 1a | 1a | 1d | 1d | 1d |
| KabsC | 1/h per | 2.12a | 2.12a | 2.12a | 2.12d | 2.12d | 2.12d |
| KunabsC | 1/h per | a | a | a | d | d | d |
| Partition coefficient | |||||||
| PL | Unitless | 3.66c | 3.17b | 2.72b | 2.03c | 2.03c | 2.03c |
| PK | Unitless | 0.80e | 0.80e | 0.80e | 1.26b | 1.26b | 1.26b |
| PM | Unitless | 0.16e | 0.16e | 0.16e | 0.16f | 0.16f | 0.16f |
| PF | Unitless | 0.13e | 0.13e | 0.13e | 0.13f | 0.13f | 0.13f |
| PPla | Unitless | — | 0.41e | — | — | 0.13b | 0.41f |
| PRest | Unitless | 0.26b | 0.22g | 0.03b | 0.20f | 0.20f | 0.20f |
| Milk transfer and clearance parameters | |||||||
| PMilkM | Unitless | — | — | 1.9e | — | — | 1.9g |
| PMilkP | Unitless | — | — | 0.11e | — | — | 0.11g |
| PAMilkC | Unitless | — | — | 0.5e | — | — | 0.0028b |
| KMilk0 | Unitless | — | — | 0.28b | 0.021f | ||
| Placental transfer and amniotic fluid transfer rate constant | |||||||
| Ktrans1C | L/h per | — | 1.27b | — | — | 0.79b | — |
| Ktrans2C | L/h per | — | 1g | — | — | 1.12b | — |
| Ktrans3C | L/h per | — | 0.23b | — | — | 0.006f | — |
| Ktrans4C | L/h per | — | 0.001g | — | — | 0.001f | — |
| Elimination | |||||||
| KbileC | 1/h per | 0.0026c | 0.007b | 0.0026c | 0.00013c | 0.00013c | 0.00013c |
| KurineC | 1/h per | 1.60a | 1.60a | 1.60a | 0.096c | 0.096c | 0.096c |
| Renal reabsorption parameters | |||||||
| Vmax_baso_invitro | pmol/mg protein/min | 393.45a,h | 221b | 393.45a,h | 479c | 479c | 479c |
| Km_baso | mg/mL | 27.2a,h | 19.9b | 27.2a,h | 20.1d,h | 20.1d,h | 20.1d,h |
| Vmax_apical_invitro | pmol/mg protein/min | 1,808c | 1,808c | 4,141b | 51,803c | 51,803c | 51,803c |
| Km_apical | mg/mL | 278c | 278c | 278c | 64.4c | 248b | 64.4c |
| RAFapi | Unitless | 4.15c | 4.15c | 4.15c | 0.001c | 0.001c | 0.525b |
| RAFbaso | Unitless | 1.90c | 1.90c | 1.90c | 1d | 1d | 1d |
| Kdif | L/h | 0.001a | 0.001a | 0.001a | 0.001d | 0.001d | 0.001d |
| KeffluxC | 1/h per | 2.09c | 2.09c | 2.09c | 0.15c | 0.015b | 0.15c |
| Fetal or neonatal parameters | |||||||
| Free_Fet/Free_neo | Unitless | — | 0.022i | 0.022i | — | 0.0038b | 0.014i |
| PL_Fet/PL_neo | Unitless | — | 1.30b | 2.55b | — | 0.58b | 2.03i |
| PK_neo | Unitless | — | — | 0.80i | — | 1.26i | |
| PRest_Fet/PRest_neo | Unitless | — | 0. 11b | 0.22i | — | 2.3b | 0.2i |
| Vmax_baso_invitro_neo | pmol/mg protein/min | — | — | 393.45i | — | — | 479i |
| Km_baso_neo | mg/mL | — | — | 27.2i | — | — | 20.1i |
| Vmax_apical_invitro_neo | pmol/mg protein/min | — | — | 1,808i | — | — | 51,803i |
| Km_apical_neo | mg/mL | — | — | 278i | — | — | 64.4i |
| KeffluxC_neo/ KeffluxC_p | 1/h per | — | — | 2.09i | — | — | 0.15i |
| KbileC_neo/KbileC_pup | 1/h per | — | — | 0.0026i | — | — | 0.00013i |
| KurineC_neo/ KurineC_pup | 1/h per | — | — | 1.6i | — | — | 0.001f |
| KabsC_pup/ KabsC_neo | 1/h per | — | — | 2.12i | — | — | 2.12i |
| Kdif_pup/ Kdif_neo | L/h | — | — | 0.001i | — | — | 0.001i |
Note: BW, body weight; Free, free fraction of PFOS in maternal plasma; K0C, rate constant of absorption of PFOS in stomach; KabsC, rate constant of absorption of PFOS in small intestine; KbileC, biliary elimination rate constant; Kdif, diffusion rate from proximal tubule cells (PTCs) to kidney serum; KeffluxC, rate constant of clearance of PFOS from PTCs into blood; Km_apical, Michaelis constant (Km) of apical transporters; Km_apical_neo, Michaelis constant (Km) of apical transporters for the human neonate; Km_baso, Michaelis constant (Km) of basolateral transporters; Km_baso_neo, Michaelis constant (Km) of basolateral transporters for the human neonate; KMilk0, zero-order milk suckling rate constant (for one individual pup); Ktrans1C, mother-to-fetus placental transfer rate constant; Ktrans2C, fetus-to-mother placental transfer rate constant; Ktrans3C, fetus-to-amniotic fluid transfer rate constant; Ktrans4C, amniotic fluid-to-fetus transfer rate constant; KunabsC, rate constant of unabsorbed PFOS dose to appear in feces; KurineC, urinary elimination rate constant; PAMilkC, permeability area cross product (mammary to milk); PBPK, physiologically based pharmacokinetic; PF, fat-to-plasma partition coefficient; PFOS, perfluorooctane sulfonate; PK, kidney-to-plasma partition coefficient; PK_neo, kidney-to-plasma partition coefficient for the human neonate; PL, liver-to-plasma partition coefficient; PM, mammary gland-to-plasma partition coefficient; PMilkM, milk-to-mammary gland partition coefficient; PMilkP, milk-to-plasma partition coefficient; PPla, placenta-to-plasma partition coefficient; PRest, rest of body-to-plasma partition coefficient; RAFapi, relative activity factor for apical transporters; RAFbaso, relative activity factor for basolateral transporters; Vmax_apical_invitro, Vmax of apical transporters; Vmax_apical_invitro_neo, Vmax of apical transporters for the human neonate; Vmax_baso_invitro, Vmax of basolateral transporters; Vmax_baso_invitro_neo, Vmax of basolateral transporters for the neonate. Free_Fet/Free_neo, free fraction of PFOS in fetal or neonatal plasma; KabsC_pup/KabsC_neo, rate constant of absorption of PFOS in small intestine for the pup or neonate; KbileC_neo/KbileC_pup, biliary elimination rate constant for the neonate or pup; Kdif_pup/Kdif_neo, diffusion rate from PTCs to kidney serum for the pup or neonate; KeffluxC_neo/ KeffluxC_P, rate constant of clearance of PFOS from PTCs into blood for the neonate or pup; KurineC_neo/ KurineC_pup, urinary elimination rate constant for the neonate or pup; PL_Fet/PL_neo, liver-to-plasma partition coefficient for the fetus or neonate; PRest_Fet/PRest_neo, rest of body-to-plasma partition coefficient for the fetus or neonate.
Worley and Fisher (2015).
These parameters were calibrated in the present study.
Chou and Lin (2019).
Worley et al. (2017).
Loccisano et al. (2012a).
Loccisano et al. (2013).
Loccisano et al. (2012b).
Nakagawa et al. (2008).
Fetal or neonatal parameter was assumed to be same as the dam or mother.
Uptake and elimination.
After oral gavage, a two-compartment gastrointestinal (GI) model was used to describe the process of uptake of PFOS. In brief, PFOS enters the stomach via oral administration and then enters the small intestine with gastric emptying rate (GE; per hour). A first-order constant, K0 (per hour) was used to describe the uptake from stomach, whereas the first-order rate constant Kabs (per hour) was used to describe the uptake of PFOS in the small intestine (per hour). After absorption, the PFOS is transported directly to the liver from the GI tract through the portal vein. Equations describing oral uptake are provided and explained below:
| (1) |
| (2) |
| (3) |
where RST, RSI, and RabsSI are the rates of change in the amount of PFOS (in milligrams per hour) in the stomach, small intestine, and absorbed dose transported to the liver, respectively; AST and ASI are the amount of PFOS in the stomach and small intestine (in milligrams), respectively; and Kunabs is the rate constant of unabsorbed PFOS to appear in the feces (per hour).
Kurine, a first-order urinary elimination rate, was used to describe the excretion of PFOS from the filtrate compartment via the urine. Similarly, Kbile, a first-order biliary excretion rate, was used to account for PFOS excreted into the feces via the bile. Equations describing the urinary and fecal excretion processes are as follows:
| (4) |
| (5) |
where Rurine and Rfeces are the urine and fecal elimination rates of PFOS (in milligrams per hour), respectively; AFil (in milligrams) is the amount of PFOS in the filtrate compartment; and AL (in milligrams) is the amount of PFOS in the liver.
Transport in the kidney compartment.
The kidney can be described as a three-compartment model: a) proximal tubule lumen/filtrate, b) PTCs, and c) the rest of the kidney. Passive and active transport processes of PFOS in the kidney compartment were described based on the equations reported from previous studies (Chou and Lin 2019; Worley et al. 2017; Worley and Fisher 2015) as explained below:
| (6) |
| (7) |
| (8) |
| (9) |
| (10) |
| (11) |
| (12) |
where RKb and RCl are the rates of change in the amount of PFOS in kidney plasma and the clearance via the GFR (in milligrams per hour), respectively; Rdif is the diffusion rate from kidney plasma to the PTCs (in milligrams per hour); RA_baso is the rate of PFOS transport from the plasma to PTCs through basolateral transporters (in milligrams per hour); RA_apical is the rate of PFOS transport from the filtrate to PTCs through apical membrane transporters (in milligrams per hour); Cfil is the concentration of PFOS in the filtrate compartment (mg/L); CKb is the concentration of PFOS in the kidney plasma; RAefflux is the efflux rate of PFOS from PTCs back into the systemic circulation (in milligrams per hour). The transport rates of basolateral (RA_baso) and apical transporters (RA_apical) were described by Michaelis-Menten equations. The amounts of PFOS in the kidney plasma (AKb) and PTCs (APTC) subcompartments, and the clearance amount (ACl) via glomeruli were obtained by integration of the rate Equations 10–12.
Prepregnant PBPK model.
The prepregnant female model was composed of six compartments, including plasma, liver, fat, mammary gland, kidney, and a lumped compartment representing the rest of the body tissues (Figure 1A without the placenta and fetus compartments). To parameterize the female rat and human models, sex-specific physiological parameters (e.g., BW, cardiac output (QC), the volume of mammary gland and fat, and glomerular filtration rate) were applied in the model based on data from the literature (Loccisano et al. 2012b; Worley et al. 2017; Worley and Fisher 2015). All physiological parameter values in rats and humans for different life stages (e.g., prepregnant adult, pregnant, and lactating) are provided in Tables S1–S2. The prepregnant human model was used to run a simulation for 30 y from birth to 30 years of age to achieve steady-state concentrations of PFOS in plasma and tissues that were then used as initial amounts in the gestational model. In the prepregnant model, age-dependent changes in BW from birth to 30 years of age were described using the equation reported by Haddad et al. (2001) and the dynamic changes of other physiological parameters were considered by scaling with the BW (refer to Equation 24 in the section “Model Parameterization” for additional description of the age-dependent changes in BW of prepregnant women). Given that the growth functions of individual physiological parameters (i.e., organ weights) were not used, the present prepregnant model is a simplified model. This simplified approach of an age-dependent PBPK model is consistent with the approach used in the latest guidance document for PFAS from the EFSA CONTAM Panel (2020).
Figure 1.
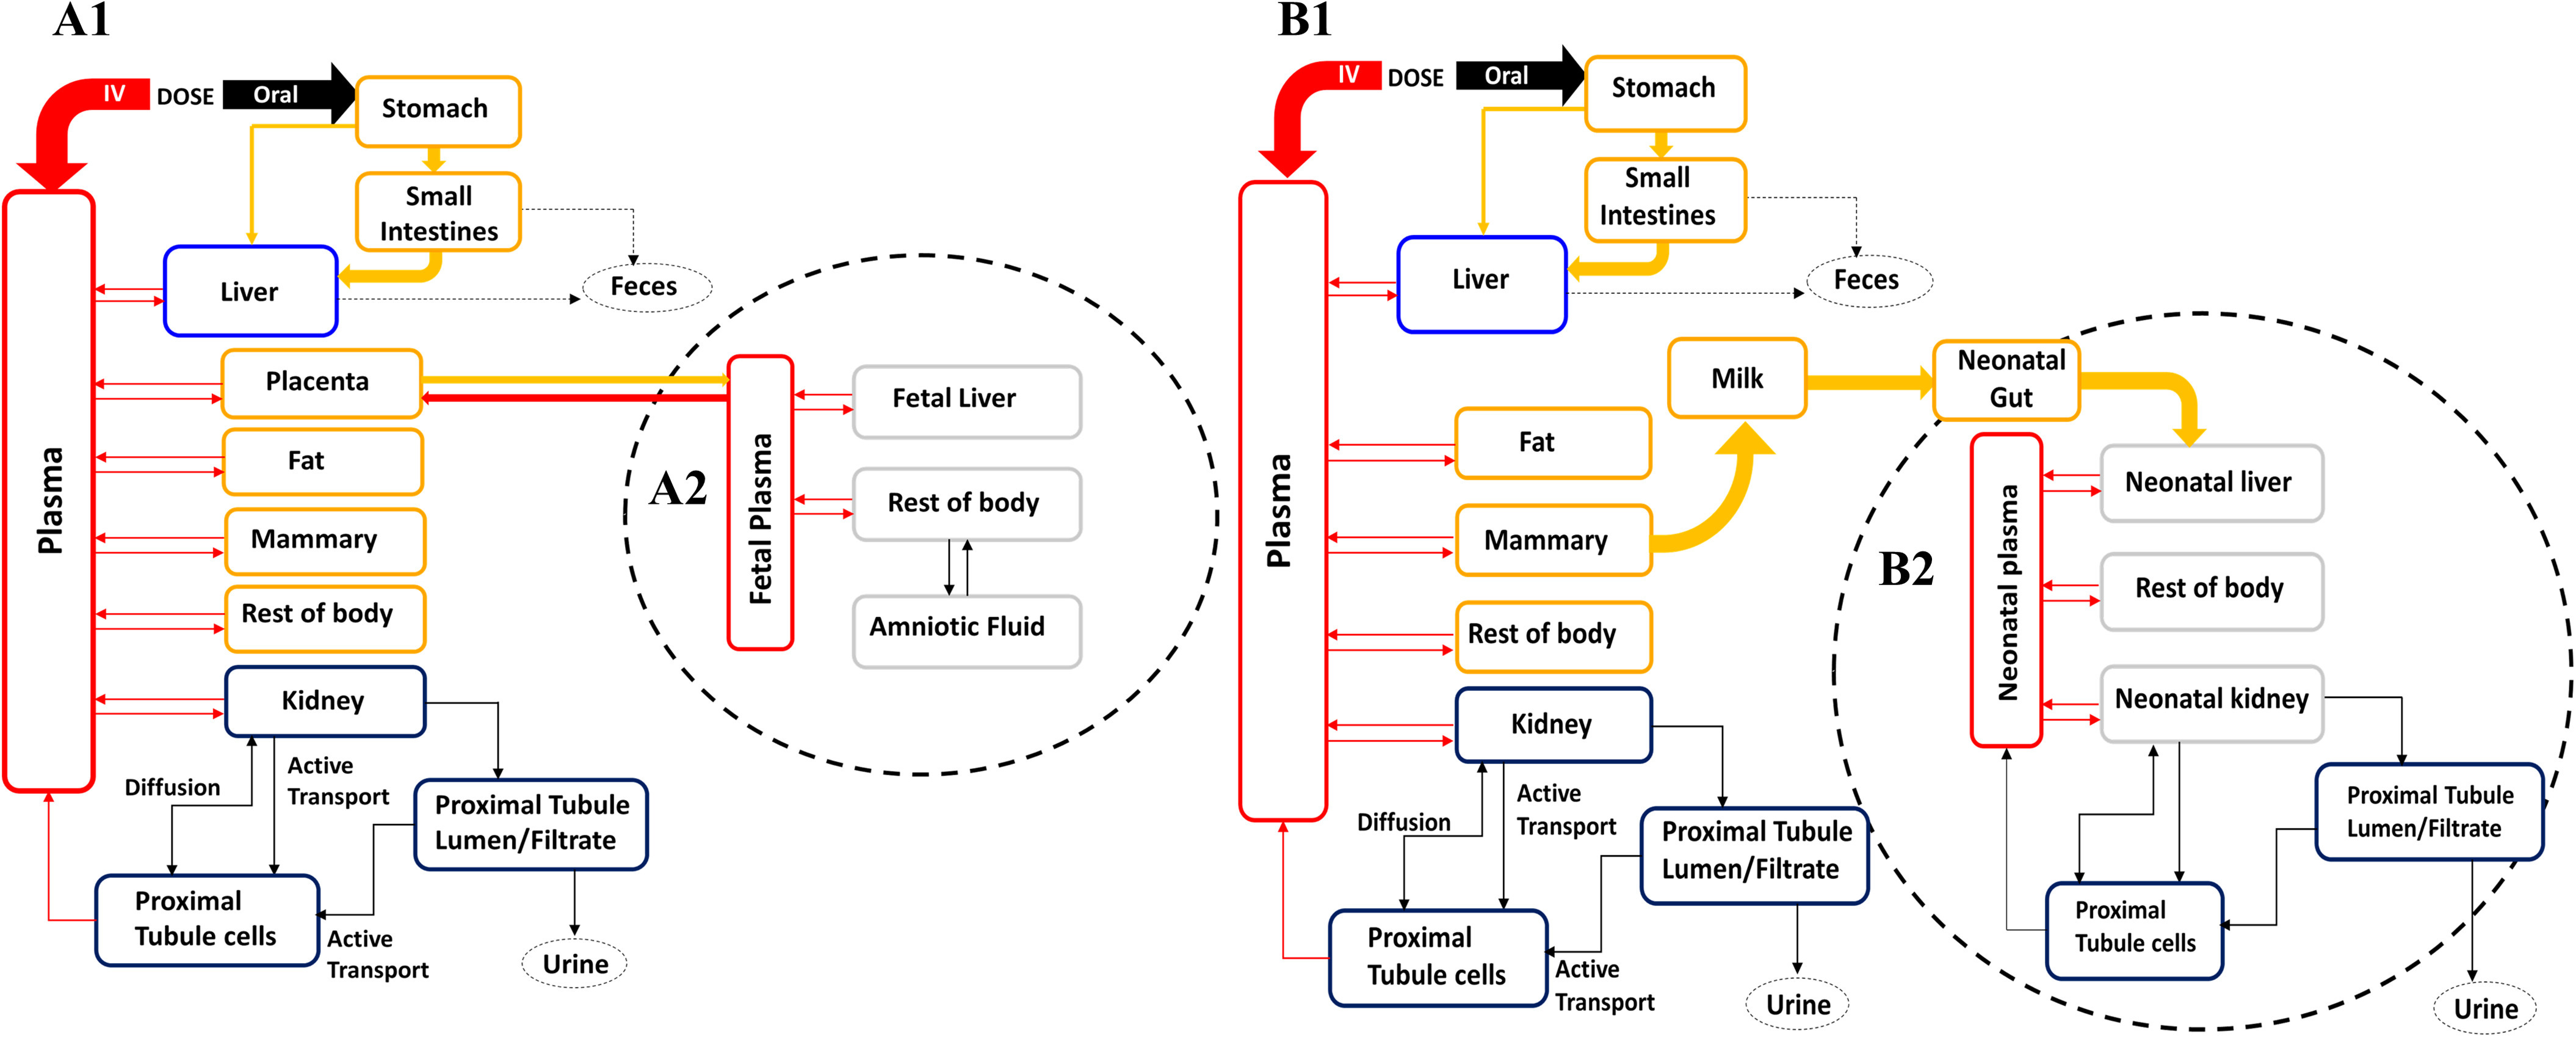
PBPK model structure for simulating PFOS exposure during (A) gestation and (B) lactation in rats and humans. (A1) and (B1) represent the maternal model during gestational and lactational periods, respectively. (A2) and (B2) represent fetal and neonatal submodels that are connected to the maternal circulation through the placenta and milk, respectively. In the gestational model, only the mother is exposed while the fetal exposure is via placental transfer. In the lactational model, the mother is exposed to PFOS by oral intake and the neonate is exposed through milk. Note: IV, intravenous injection; PBPK, physiologically based pharmacokinetic; PFOS, perfluorooctane sulfonate.
Gestational PBPK model.
A consistent PBPK model structure during gestation was used for both rats and humans (Figure 1A). The gestational PBPK model was extended from the prepregnant female model described above by adding the placenta and fetus compartments. Thus, the gestational model was composed of eight compartments, including plasma, liver, kidney, fat, mammary gland, placenta, fetus, and the rest of the body. The fetus submodel and its circulation were described as being separate compartments from the maternal compartments. The fetus submodel included four compartments: plasma, liver, the rest of the fetal tissues, and amniotic fluid.
In the fetus compartment, fetal exposure to PFOS is via placental transfer, and the excretion of PFOS is from the fetal plasma to the placenta, and then back into the maternal circulation. The transfer between the placenta and fetal plasma of free PFOS was therefore described as a bidirectional diffusion process with first-order rate constants (Ktrans1 and Ktrans2); the transfer process between the rest of the fetal body and the amniotic fluid compartment was also described with first-order diffusion rate constants (Ktrans3 and Ktrans4) (Lin et al. 2013; Loccisano et al. 2012a, 2013; Yoon et al. 2009). The transfer processes between the placenta and fetus during gestation are described with Equations 13–20:
| (13) |
| (14) |
| (15) |
| (16) |
| (17) |
| (18) |
| (19) |
| (20) |
where the Rtrans1, Rtrans2, Rtrans3, and Rtrans4 are the rates of transfer of PFOS from maternal plasma to fetal plasma via the placenta, from the fetal plasma to maternal plasma via the placenta, from the amniotic fluid to the rest of fetal body, and from the rest of fetal body to the amniotic fluid (in milligrams per hour), respectively; CVPla is the concentration of PFOS in the maternal plasma compartment leaving the placenta (mg/L); CPlas_Fet is the concentration of PFOS in the fetal plasma (mg/L); CVRest_Fet is the concentration of PFOS in the plasma leaving the rest of fetal body compartment (mg/L). CAm is the concentration of PFOS in the amniotic fluid compartment (mg/L). Free and Free_Fet are the free fraction of PFOS in maternal and fetal plasma, respectively. The amounts of PFOS for transfer across the placenta (Atrans1 and Atrans2) or to and from the amniotic fluid (Atrans3 and Atrans4) were obtained by integration of the rate Equations 17–20.
Lactational PBPK model.
The PBPK model structure for PFOS during lactation in rats and humans (Figure 1B) was similar to the gestational model without the placenta and with an additional milk compartment, and the fetus submodel became the pup/neonatal submodel. The pup/neonatal tissue compartments were the same as those of the dam/maternal submodel, including plasma, gut, liver, kidney, and the rest of the pup/neonatal body. The pup/neonatal exposure to PFOS was only through the milk compartment. Transfer of PFOS from the mammary tissue to the milk compartment was described as a diffusion process with a transfer rate (PAMilk) from mammary tissue to the milk and the partition coefficient parameter between milk and the mammary tissue (PMilkM). The milk production rate constant (KMilk) was assumed to be equal to the infant suckling rate by the nursing pups/neonates (assuming 100% intake by the pups/neonates with no delay time between production and consumption). PFOS that entered into the neonatal GI tract from the milk compartment was directly absorbed into the liver with a first-order rate constant (Kabs_neo). The renal reabsorption subcompartments in the neonates were the same as the mother’s subcompartments including the filtrate, PTCs, and rest of the kidney. The transfer processes between the mammary tissue, milk and pups or neonates during lactation were described with Equations 21–23:
| (21) |
| (22) |
| (23) |
where the RM, RMilk, and Rtrans are rates of change in the amount of PFOS in mammary tissues, milk compartment, and the rate of transfer of PFOS from milk compartment to pup/neonate’s GI tract (in milligrams per hour), respectively; CVM is the concentration of PFOS in the plasma leaving the mammary gland compartment (mg/L); and CMilk is the concentration of PFOS in the milk compartment.
Model Parameterization
The changes of physiological parameters during pregnancy and lactation were based on previously published rat and human gestational and lactational PBPK models (Lin et al. 2013; Loccisano et al. 2012b, 2013; Yoon et al. 2009, 2011) and the recently published empirical models for anatomical and physiological changes in humans during gestation (Kapraun et al. 2019; Yang et al. 2019). Equations for the physiological changes were added to the model to account for the dynamic changes of fat, mammary tissue, placenta, plasma volume, fetuses, and neonates. The physiological and chemical-specific parameters are presented in Table S2 and Table 2, respectively, and the growth equations are provided in Tables S3–S6.
Growth equations for physiological parameters.
To consider the physiological changes during gestation and lactation, growth equations for physiological parameters were used in the PBPK model. The duration of the gestational and lactational model was modeled as about 16 months (40 wk for the gestational period plus 6 months postpartum up to the end of breastfeeding) in humans and about 42 d (21 d for the gestational period plus 21 d for the lactational period) in rats. Physiological parameters for nonpregnant and nonlactating adult female rats and humans (Loccisano et al. 2012b, 2013; Worley et al. 2017; Worley and Fisher 2015; Yoon et al. 2011) were used as initial values for pregnant females on GD0 to simulate the gestational period. The parameters for the fetus at the end of gestation were used as initial parameter values on PND0 to simulate the neonate. Maternal parameters that are changing during pregnancy and the values at the end of gestation were directly used at the begin of lactation. Dynamic changes in maternal/fetal/neonatal organ/tissue volumes, tissue growth, and blood flow rates during the gestational and lactational period were described mathematically based on existing models for rats and humans (Kapraun et al. 2019; Lin et al. 2013; Loccisano et al. 2012b, 2013; Yoon et al. 2009, 2011). Values and equations for describing growth and changing physiological parameters during pregnancy and lactation are provided in Tables S3–S6 along with the references.
Pregnant rats and fetuses.
The growth equations of pregnant rats and fetuses are provided in Table S3. Briefly, maternal BW during gestation was estimated as the sum of the initial BW (BW0) and the increased volumes of the placenta, mammary tissue, fat and the growing fetal tissues based on previous studies (Clewell et al. 2003; Lin et al. 2013; Loccisano et al. 2012b; Yoon et al. 2009). Other tissues of dams including liver and kidney remained constant fractions of BW during gestation. The QC during gestation was calculated by multiplying the QC index (QCI) by BW and [1-hematocrit (Htc)], whereas the initial QC (QC_0) for GD0 was calculated by multiplying initial QCI (QCI_0) at GD0 by BW0 and (1 − Htc). The initial volumes of fat and mammary tissues were calculated by multiplying the fraction of volumes of fat and mammary and BW0 (Brown et al. 1997; Lin et al. 2013; Loccisano et al. 2012b; Yoon et al. 2009). The volume of fat (VF) and mammary tissues (VM) were assumed to increase linearly with GD; the VF was increased from 7% of BW to of BW, whereas the volume of mammary tissues was increased from 1% to of BW by GD21 (Loccisano et al. 2012b; Rosso et al. 1981; Yoon et al. 2009). The volume of placenta (VPla) for each fetus was assumed as the sum of the yolk sac and chorioallantoic placenta, and the growth and decay equation of each placenta was adopted from previous studies (Clewell et al. 2003; O’Flaherty et al. 1992; Yoon et al. 2009). The volume of the rest of the body was calculated by subtracting the sum of the volume of liver (VL), kidney (VK), VM, VF, VPla, amniotic fluid (VAm), and fetus (VFet). Plasma flow to the mammary tissue (QM) and fat (QF) were proportional to the respective tissue volumes and thus were described by multiplying the ratio between the volume during gestation (VM and VF) and the initial volume (VM0 and VF0). The data of changing plasma flow to the pregnant rat kidney (QK) was adapted from Conrad (1984) and was thus described as a polynomial equation in the model. The fraction of QC to the placenta (QPla) was a sum of blood flow changes to the yolk sac and chorioallantoic placentas as described by previous studies (Clewell et al. 2003; Lin et al. 2013; Loccisano et al. 2012b; O’Flaherty et al. 1992; Yoon et al. 2009). Plasma flow to the rest of the body tissues (QRest) was calculated by subtracting the sum of the plasma flows to liver (QL), kidney (i.e., QK), fat (i.e., QF), mammary tissue (i.e., QM), and placenta (i.e., QPla) from the total QC.
The fetus was assumed to be a single compartment for a whole litter. Eight fetuses were assumed to be the average litter size based on a previous study (Loccisano et al. 2012b). Individual fetal BW growth (VFet_1) was modeled by a Gompertz curve during gestational development based on fetal growth data adopted from Sikov and Thomas (1970) and O’Flaherty et al. (1992), the main equation described by Yoon et al. (2009). The weight of each fetus (VFet_1) was then multiplied by the number of fetuses in the litter in order to model the growth of the whole litter (i.e., VFet). The data of changing VAm was taken from previous studies (Clewell et al. 2008; Loccisano et al. 2012b; Wykoff 1971), and the data points were described by polynomial equations (listed in Table S3) in the model. The fractional volume of fetal liver (VL_Fet) was adopted from the data of Schneidereit (1985) (GD17–21), which were described as a polynomial equation (listed in Table S3) in the model. The VRest_Fet was calculated by subtracting the fetal plasma (VPlas_Fet) and liver volume (VL_Fet) from the volume of the fetus.
Lactating dams and nursing pups.
The descriptions of the physiological parameter changes during lactation were adopted from previous studies (Lin et al. 2013; Loccisano et al. 2012b; Yoon et al. 2009) and modified to be consistent with the study design of PFOS and present model use (Table S4). The parameter values on PND0 were matched with the values obtained on GD22 from the gestational model in rats. The changes of the dam’s BW were taken from the data of Shirley (1984) and were described as a linear regression equation in the model. Initial lactational BW (BW0 in Table S4) was defined as the dam BW on GD22 minus the weight of placenta, fetuses, and amniotic fluid. The QCI on PND0 (QCI0) was based on data from nonpregnant Sprague-Dawley rats (Dowell and Kauer 1997). The subsequent changes of QCI during lactation were based on the data of Wistar rats from the study of Hanwell and Linzell (1973) and were incorporated into the model using a polynomial equation (listed in Table S4). Blood flows to the mammary tissue (i.e., QM), liver (i.e., QL), and kidney (i.e., QK) were also described as polynomial equations based on the data of Wistar rats (Hanwell and Linzell 1973). The VM, VF, VL, and VK as a fraction of BW were described as polynomial equations based on the data of Rosso et al. (1981), Hanwell and Linzell (1973), and Naismith et al. (1982). The remaining body tissue volume was calculated as the difference between the BW and the sum of the VL, VK, VM, VF, and VPlas.
For nursing pups, the generalized Michaelis-Menten (GMM) model was used to describe the increasing BW (BW_pup) and increasing volumes of liver (VL_pup) and kidney (VK_pup) in the growing pups based on the study of Mirfazaelian and Fisher (2007). The initial BW (e.g., Wt0) and tissue volumes (e.g., Wt_LIV0 for liver, Wt_KID0 for kidney) were assumed to be the values on GD22 of the gestational model. The changing plasma volume (VPlas_pup) and Htc (Htc_pup) of the growing pups were taken from the data of Garcia (1957) and implemented in the model using a polynomial function. The equation of QC in the pup (QC_pup_i) was adopted from the method used by Yoon et al. (2009), Loccisano et al. (2012b), and Lin et al. (2013), and developed by Rodriguez et al. (2007). The fraction of QC going to the liver (QLC_pup) and kidney (QKC_pup) was adapted from the data of Štulcová (1977) and incorporated into the model using polynomial equations. The milk compartment carries PFOS to the pups with variable milk production rates. Based on the method of Yoon et al. (2009), the milk production rate by the dam was equal to the suckling rate by the nursing pups by assuming 100% intake by the pups. Thus, the changes in milk suckling rate constants per kilogram BW of the pups (KMilkC) during lactation were described using a polynomial equation based on the data of Hinderliter et al. (2005).
Prepregnant and pregnant women, and fetuses.
In the prepregnant model, only the age-dependent changes in BW from birth to 30 years of age were considered in the model; then the dynamic changes of other physiological parameters were considered by scaling with the BW. The equation describing the age-dependent BW for prepregnant women was collected from Haddad et al. (2001):
| (24) |
where the represents the calculated prepregnant women BW. This equation can describe the dynamic changes of female BW from birth to 18 years of age. By assuming that female BW does not have large variations after 18 years of age, the BW from 19 to 30 years of age was assumed to be the same as the predicted BW at 18 years of age ().
For the pregnant model, the descriptions of the physiological parameter changes in pregnant women and fetuses were adopted from the study of Kapraun et al. (2019) and modified to be consistent with the use in present model (Table S5). The equation of QC in humans during gestation was described as a cubic model. The QC on gestational age (GA) 0 (QC0) was based on data from nonpregnant women. The QC was modified for plasma flow by multiplying QC by 1-Htc. Similarly, the maternal GFR during gestation was described as a quadratic model based on the data of Abduljalil et al. (2012) and varied with GA (weeks). Because the unit of the original equation for GFR was milliliters per minute, the value of 0.06 was used to convert the unit milliliters per minute to liters per hour for model use. Based on the data of Abduljalil et al. (2012), the equation of maternal Htc was described as a quadratic model, as in Kapraun et al. (2019). The equations describing the expanding mammary tissues (i.e., VM) during pregnancy were adopted from Gentry et al. (2003). The polynomial equations describing the changes of fat (i.e., VF), plasma (i.e., VPlas), amniotic fluid (i.e., VAm), and placenta (i.e., VPla) during gestation were adopted from Kapraun et al. (2019) based on the data of Abduljalil et al. (2012). VL and VK were assumed to remain constant fractions of the prepregnant (nonpregnant) maternal BW (BW0). The volume of the rest of the body tissues (VRest) was calculated by subtracting the sum of all other tissues from the total maternal BW. Increasing blood flows to the fat (i.e., QF), mammary tissue (i.e., QM), and placenta (i.e., QPla) were calculated by the method of Gentry et al. (2003). The equations describing increased blood flows to the liver (i.e., QL) and kidney (i.e., QK) were adopted from the method of Kapraun et al. (2019). QRest was calculated by subtracting the sum of the plasma flows to all other tissues from the total QC.
The fetal growth parameters were described by the several equations based on the studies of Gentry et al. (2003) and Kapraun et al. (2019). The VFet was described as a Gompertz model from the method of Kapraun et al. (2019). Given that the average density of a human fetus is approximately throughout gestation, the volume of fetal tissues also represents the mass. Fetal QC (QFet) was defined as a function of fetal blood volume and adjusted by the fetal Htc (Htc_Fet) from the method of Clewell et al. (1999). The equations describing the changes of Htc_Fet, VL_Fet, and blood flow of fetal liver (QL_Fet) were adopted from the method of Kapraun et al. (2019).
Lactating women and nursing neonates.
The descriptions of the physiological parameter changes in lactating women and nursing neonates were adopted from the study of Yang et al. (2019) and modified to be consistent with the use in the present model (Table S6). The equation describing the decreased maternal BW for up to 6 months postpartum was modeled as a polynomial equation based on the data of Wosje and Kalkwarf (2004). The changing fractional values of fat, as a percent of maternal BW (VFC), were modeled as a linear equation based on the data of Wosje and Kalkwarf (2004). The VM during lactation was calculated as an increased tissue volume from post-pregnancy to the end of lactation (6 months postpartum) as described by previous studies (Gentry et al. 2002; Yoon et al. 2011). Thus, the increment in the VM (expressed as a fraction of maternal BW) was modeled as a polynomial equation based on the data used in Yoon et al. (2011) and then was used to calculate VM in lactating women. Decreasing plasma volume was described as a polynomial equation based on the data of Salas et al. (2006). Volume of the remaining maternal tissues was calculated as the total maternal BW minus liver, kidney, mammary gland, fat, plasma, and milk. The total QC during lactation was described as a sum of the initial QC at term (QC0) plus the change of blood flow in mammary tissues and fat during lactation. The changes of blood flows in mammary tissues (i.e., QM) and fat (i.e., QF) were described as proportional to their volume changes during lactation based on the assumptions from Gentry et al. (2003) and Yoon et al. (2011). Blood flow to the QRest was calculated by subtracting the sum of the plasma flows to all other tissues from the total QC. The equation describing the change of the GFR after pregnancy was described as a polynomial model based on the data from Sims and Krantz (1958) and returned to the prepregnancy level at 6 wk postpartum. KMilk was described as a polynomial equation based on the data of Dewey et al. (1991), and the rates were assumed to be equal to infant suckling rates.
For the physiological parameters in infants during lactation, the equations describing the growth of QC (QC_neo), Htc (Htc_neo), blood flow to kidney (QK_neo) and liver (QL_neo), and the changes of neonatal liver (VL_neo) and kidney (VK_neo) volumes were described as polynomial equations in the model, as described in the study of Yang et al. (2019). The volume of plasma (VPlas_neo) in neonates was described as a polynomial equation based on the data of Yoon et al. (2011). BW of the neonate (BW_neo) were described as a polynomial equation based on the data of a previous study (Clewell et al. 2004).
Chemical-specific parameters.
The chemical-specific parameters used in the gestational and lactational model for PFOS are given in Table 2, with additional definitions in Table S1. The parameters used in the rat and human gestational model were the same as those used in the adult model (Chou and Lin 2019) with the exception of selected sensitive parameters that were recalibrated and optimized with the available animal experimental data and human biomonitoring data in pregnant/lactating/fetal/neonatal rats and humans, which are explained in detail in the following sections. The data sets used in the model calibration are listed in Table 1.
Uptake and elimination.
For the uptake and elimination rate constants, because experimentally measured values of these parameters were not available in the pregnant/lactating rats/humans, the values from the previously developed adult model (Chou and Lin 2019) were retained in the present model for pregnant/lactating rats/humans (e.g., K0C, KabsC, KunabsC, KbileC, KurineC listed in Table 2). Among these parameters, the parameter KbileC in pregnant rat model was sensitive to selected model outputs, and was therefore recalibrated with available in vivo rat data (Table 1).
Renal reabsorption in the kidney compartment.
It is known that renal organic anion transporters Oatp1a1 and Oat1 (Slc22a6) or Oat3 (Slc22a8) are expressed on the apical and basolateral membranes of PTCs (Buist and Klaassen 2004; Weaver et al. 2010). A complete description of how the renal reabsorption parameters were incorporated into the PBPK models for PFOA and PFOS in different species has been reported in recent studies (Chou and Lin 2019; Worley et al. 2017; Worley and Fisher 2015). In brief, renal reabsorption was described by the Michaelis-Menten equation, and the parameters included the and of basolateral (Vmax_basoC, Km_baso) and apical transporters (Vmax_apicalC, Km_apical). These parameters were derived from the in vitro studies and translated to in vivo values by multiplying with a relative activity factor (RAFbaso and RAFapi) and an estimated mass of PTCs (L) based on an estimated 60 million PTCs/g kidney (Hsu et al. 2014). Due to a lack of relevant data on these parameters for PFOS, all reabsorption parameter values for PFOA were used as the initial values for PFOS, and these values were then calibrated with available in vivo rat studies or human biomonitoring data (Table 1).
Free fraction of PFOS in plasma.
It is well known that PFOA and PFOS are highly bound to plasma proteins () such as albumin in rats, monkeys, and humans (Han et al. 2003). Only the free fraction of PFOA or PFOS can freely circulate throughout the body. This was accounted for in the PBPK model using a free fraction constant (Free), which has been described in previous studies for adult PFOA and PFOS PBPK models in rats, monkeys, and humans (Chou and Lin 2019; Worley et al. 2017; Worley and Fisher 2015). However, there was no detailed information on PFOA or PFOS binding to plasma proteins during gestation or lactation in rats and humans. Therefore, the same free fraction constant in the adult model was used as initial value in the gestational and lactational models for the free fraction in the plasma of pregnant, fetal, and neonatal rats/humans (i.e., Free, Free_Fet, and Free_neo), and then these parameters were further calibrated with available animal studies and human biomonitoring studies because they were identified as sensitive parameters to key model outputs.
Tissue partitioning.
Partition coefficients (PCs) for PFOS in the kidney (PK), liver (PL), and rest of the body (PR) estimated for the adult rat and human PBPK model from our previous study (Chou and Lin 2019) were used in the gestational and lactational model. The initial values of PCs for mammary tissue (PM), fat (PF) and placenta (PPla) in the gestational and lactational PFOS model were based on previous gestational and lactational PBPK models for PFOS (Loccisano et al. 2012b, 2013), and then these parameters were optimized by fitting to the calibrated data sets if the PCs of certain tissues were sensitive to the model outputs of interest (highlighted in bold in Table 2). Due to a lack of data on fetal tissue-to-plasma PC for PFOS, these parameters were set to the same values as in the adult model (Chou and Lin 2019).
Placental transfer.
A simple diffusion model was used to describe the process of transfer of PFOS across the placenta between maternal and fetal plasma. In the rat model, the parameters for transfer to and from the fetal plasma (Ktrans1C and Ktrans2C) were obtained from a previous study (Loccisano et al. 2012b) that estimated these parameters by fitting the gestational model to fetal liver and maternal plasma PFOS concentration data from Thibodeaux et al. (2003) and Chang et al. (2009). Parameters for transfer to and from the amniotic fluid (Ktrans3C and Ktrans4C) were also obtained from the study by Loccisano et al. (2012b), which estimated these parameters by using the whole embryo/fetus and amniotic fluid concentration data for PFOA from Hinderliter et al. (2005). All parameters for placental transfer were scaled to fetal BW () because it has been assumed that the transfer of nutrients and other substances across the placenta would increase as gestation progresses (Lin et al. 2013; Loccisano et al. 2012b, 2013; Rosso 1975; Yoon et al. 2009). For the human model, due to a lack of data in humans, the rates for the parameters of transfer to and from the fetal plasma (Ktrans1C and Ktrans2C) and parameters for transfer to and from the amniotic fluid (Ktrans3C and Ktrans4C) were assumed to be equal to those estimated from the pregnant rat model in a previous study (Loccisano et al. 2012b). Similar to the rat model, all parameters for placental transfer were scaled to fetal BW (i.e., ). Placental transfer rate constants were sensitive to selected model outputs in the pregnant rat and human model, and thus were recalibrated with available in vivo rat and human biomonitoring data, as listed in Table 1.
Nursing pups/neonates.
In the present study, the litter size was assumed to be eight pups based on the assumption from a previous lactational PBPK study (Loccisano et al. 2012b). There were no relevant data on the nursing pups and neonates in the lactating rat and human model, and thus most of the parameters were assumed to be equal to those used in the pregnant or lactating rat/woman model. For example, the uptake and elimination rate constants (e.g., KabsC_pup, KabsC_neo, KbileC_pup, KbileC_neo, KurineC_pup, KurineC_neo), the parameters of PFOS binding to serum proteins (Free_neo and Free_pup), the partition coefficients of tissues (PL_neo, PK_neo, and PRest_neo) and the renal reabsorption parameters of pups and neonates (Vmax_baso_invitro_neo, Km_baso_neo, Vmax_apical_invitro_neo, Km_apical_neo, KeffluxC_neo/KeffluxC_p, Kdif_pup/Kdif_neo) were assumed to be the same as the values of pregnant or lactating rats/women. The partition coefficients of liver (PL_neo) and rest of the body (PRest_neo) for neonates in lactating rat and human model were sensitive to the model output and thus were recalibrated with available in vivo rat data and human biomonitoring data listed in Table 1. All chemical-specific parameter values of nursing pups/neonates are shown in Table 2.
Model Calibration
Preliminary sensitivity analysis.
A preliminary sensitivity analysis for the gestational and lactational PBPK model was performed to select sensitive parameters to key model outputs before calibration. The purpose was to compare and select sensitive model parameters whose values were unknown to be included in subsequent calibration, starting with the likely sensitive parameters to reduce the computational burden and improve the performance quality. Once the sensitive parameters with unknown values were selected, the Levenberg-Marquardt algorithm was used for model calibration. The preliminary sensitivity analysis and subsequent calibration were conducted using R package FME (Soetaert and Petzoldt 2010).
Levenberg-Marquardt algorithm.
Following initial model parameterization, the model was further optimized using the Levenberg-Marquardt nonlinear least-squares algorithm (Chou and Lin 2019). In brief, highly sensitive parameters were selected by using the sensitivity analysis method of the FME R package (Soetaert and Petzoldt 2010) and these parameters (estimated parameters indicated in Table 2) were calibrated by comparing the simulation results to the mean experimental concentration values at any time point of the data set . The weighted and scaled residuals (Soetaert and Petzoldt 2010) and least-squares function between the observed data and simulated data were estimated using the following equation:
| (25) |
where the is a weighting factor that adjusts for the different units or magnitudes from different data sets. The values of can be estimated from the standard deviation of measurements. represents the number of data points for data set and can be used to scale the residuals to avoid the abundant data set dominating the analysis. The model was fitted with all data sets simultaneously, and the was estimated as the sum of squared residuals for all data points in all data sets.
Calibration simulation.
Simulations of the rat model for the calibration data sets were performed based on the three different dosing regimens as described in the four selected rat studies above (Table 1). In the first study by Thibodeaux et al. (2003), the pregnant rats were exposed to PFOS from GD2 to GD20 and animals were sacrificed on GD21 to collect samples, and the model was therefore run until GD21 to compare with the experimental data. For the second scenario described by Chang et al. (2009), the gestational model was used to simulate 22 d of gestation (i.e., to the end of gestation), and then the tissue amounts were used as the initial values for the lactational model to continue the simulation during lactation. In the third scenario, based on the study design of Luebker et al. (2005a, 2005b), the rats were exposed to PFOS for 6 wk before mating/cohabitation plus the additional 14 d allowed in the period of mating (total of 56 d); these simulations were conducted in the adult female PFOS PBPK model. The tissue amounts of PFOS at the end of this simulation period were used as initial values for the gestational model. The gestational model was then used to simulate the gestational period, and again the tissue amounts of PFOS at the end of the gestational period were used as the initial values for the lactational model, which was simulated for 22 d.
The simulation of the human gestational PBPK model was based on the simulation of the prepregnant female model for 30 y from birth to 30 years of age to achieve the steady-state concentration of PFOS as initial concentrations/amounts in the plasma and tissues at the start of gestation. For the lactational model, the tissue concentrations/amounts at delivery (at Week 39) were used as initial values for the lactational model. Due to a lack of detailed exposure information in the human population, the exposure dose was based on the estimated doses from previous studies. Loccisano et al. (2013) predicted daily intake of PFOS for pregnant and lactating women resulting from worldwide human biomonitoring data. The estimated daily PFOS exposure for pregnant women were 1.2, 3.7, and deriving from the Japanese (Inoue et al. 2004a), Danish (Fei et al. 2007), and German (Midasch et al. 2007) populations, whereas the PFOS exposure of 2.3, 2.25, 0.38, and for lactating women were estimated from Swedish (Kärrman et al. 2007), American (von Ehrenstein et al. 2009), German (Fromme et al. 2010), and South Korean populations (Kim et al. 2011), respectively. The population-specific dose was used and input to the stomach compartment in our model and the same dose level was used before, during, and after pregnancy for the same study.
Model Evaluation
The performance of the PBPK model was evaluated by comparing model simulations with experimental data. On the basis of World Health Organization (WHO) PBPK guidelines (WHO 2010), we compared the predicted with the observed concentration–time kinetic profiles visually and calculated the predicted-to-observed ratio for each observed time point to check whether the predicted values were generally within a factor of 2 of the observed values. The goodness of fit between -transformed values of observed and predicted concentrations was further analyzed with the linear regression model, and adjusted -square coefficients (adj. ) were calculated.
Sensitivity Analysis
A local sensitivity analysis was performed on the gestational and lactational model for PFOS in rats and humans to estimate the influence of each parameter on the area under the curve (AUC) of maternal, fetal, and neonatal plasma. The influence of each parameter on the maternal/fetal/neonatal plasma AUC was based on the simulation results at the end of Week 39 of GA in humans, GD20 in rats, 6 months postpartum in humans, and PND20 in rats with an assumed maternal exposure level of in humans (Loccisano et al. 2013) and (Luebker et al. 2005b) in rats for both the gestational and lactational models. This analysis was conducted by varying each parameter by 1% of the original value and then examining the impact on the selected model outputs by calculating the normalized sensitivity coefficient (NSC) using the equation reported in our previous studies (Li et al. 2018; Lin et al. 2011) as shown below:
| (26) |
where is the response variable; is the change of the response variable resulting from 1% increase in the parameter value; is the original value of the parameter of interest; and is 1% of the original value of the parameter. For growth function parameters that describe the physiological changes during pregnancy and lactation, a 1% increase in the parameter was described using Equation 27, as shown below:
| (27) |
where is the growth equation with 1% increase; and is the original growth equation. This equation can allow for the parameter value to increase by 1% of the original value during the entire simulation. The results for sensitivity analysis are shown in Table S7.
Monte Carlo Analysis
MC simulation was incorporated into the gestational and lactational PBPK model in rats and humans to assess the effects of parameter uncertainty and interindividual variability on the model outputs. The relatively sensitive parameters that were identified from the local sensitivity analysis (described above) were randomly sampled based on predefined probability distributions, with the mean values (central tendencies) estimated from the model calibration or based on experimental data. Based on previously reported methods of MC analysis in PBPK models (Clewell et al. 2000; Li et al. 2017; Shankaran et al. 2013; Sterner et al. 2013; Worley et al. 2017), normal distribution was assumed for physiological parameters including BW, the fraction of the volume of the liver (VLC), the glomerular filtration rate constant (GFRC), and QC constant (QCC). A lognormal distribution was assumed for partition coefficients (PL, PRest, PL_pup), placenta transfer rate constants (Ktrans1C and Ktrans2C), and other chemical-specific parameters (Free, Free_Fet/neo, PMilkM, and KMilk0 are defined in Table S1 and Table 2). A default coefficient of variation (CV) of 20% was assigned for partition coefficients, whereas a CV of 30% was assumed for other chemical-specific parameters and physiological parameters. To ensure the biological plausibility of the randomly selected parameters, the distribution of each parameter was truncated at the 2.5th and 97.5th percentiles to represent the upper and lower bounds, respectively, and listed in Tables S8–S9. For age-dependent parameters, the variation for growth equations is described below:
where was randomly sampled from a normal distribution with a mean of 1.00 and a standard deviation of 0.2 (CV of 20% was assumed).
To address the uncertainties and variabilities in our model and due to a lack of detailed exposure information from different human populations, the PFOS exposure doses were sampled from a probabilistic uniform distribution based on the range of PFOS intake estimated from a previous study (Loccisano et al. 2013), and the simulated results were compared with worldwide measurements of PFOS concentrations in human populations from the model evaluation data sets (listed in Table 1). Although a uniform distribution was assumed due to limited data in this study, it is possible that the true variation in exposure is not a uniform distribution, but additional data are needed in order to fully characterize the exact distribution pattern of exposure data.
The 30-y simulation from the prepregnant PBPK model was also performed using a uniform distribution based on the exposure dose range of (Loccisano et al. 2013). To verify that the initial amounts for the gestational model generated using the prepregnant model were reasonable, we compared the predicted serum PFOS levels at steady-state from the prepregnant PBPK model with the measured serum PFOS concentrations in the general U.S. woman population reported by NHANES (CDC 2018). Because the calibration and evaluation data sets of humans in this study were all published in or after 2004 (Table 1), the NHANES data sets from 2005 to 2018 were used to compare with our simulation results.
Application of the Model for the Derivation of the HED
The validated PBPK model was used to simulate the exposure of rats and humans to derive the HED based on the critical animal studies (Butenhoff et al. 2009; Lau et al. 2003; Luebker et al. 2005a, 2005b) reported by the U.S. EPA (2016). In line with our model design, only NOAEL values derived from the developmental studies in rats were selected as the point of departure (POD) for the derivation of HED using the gestational and lactational PBPK model and compared with the HED values published by the U.S. EPA (2016). The NOAEL values from the selected rat studies were derived based on the end points of decreases of pup BW (Luebker et al. 2005a, 2005b), survival (Lau et al. 2003), motor activity, and habituation (Butenhoff et al. 2009). In order to compare the results from the U.S. EPA report and determine whether there is any potential impact of using the adult TK model (Wambaugh et al. 2013) to derive the HED based on developmental toxicity studies, we also derived the HED using the same equation from the U.S. EPA (2016). In brief, the PFOS AUC in maternal plasma was determined by the rat gestational and lactational PBPK models, and then the average serum concentration (ASC) in rats was estimated using the equation (i.e., ASC ) from the U.S. EPA (2016). Subsequently, the ASC value was multiplied by the clearance (CL) derived from human studies (Olsen et al. 2007) to estimate the HED. This U.S. EPA method required only the gestational and lactational model in rats.
In addition, we applied another method to estimate HED based on the gestational and lactational PBPK model in both rats and humans (Andersen et al. 1999; Cheng et al. 2018; Chou and Lin 2019; EFSA CEF Panel 2015; Lin et al. 2016). The HED values were derived by the serum AUC predicted by rat and human gestational and lactational models to derive the AUC ratios between rats and humans (e.g., ). Next, the HED values were estimated by the NOAEL values multiplied by the ratio of AUCs. With the incorporation of MC simulation in our gestational and lactational PBPK model, the median HED values with the 95% confidence intervals were estimated and then compared with the reported HED values from the U.S. EPA (2016).
Software
All model simulations were implemented in R (version 3.5.3; R Development Core Team). The PBPK model was written under the mrgsolve package in R (Elmokadem et al. 2019). Local sensitivity analysis and Levenberg-Marquardt algorithm were implemented in the R software package FME, which was developed particularly for the nonlinear model. All model code is open-source and available in the Supplemental Zipped file of the Supplemental Materials and in GitHub (https://github.com/KSUICCM/PFOS-Ges-Lac). Refer to Section 4, “Supplemental Zipped file, Supplemental Excel file, instructions, and tutorials,” of the Supplemental Material Word file for specific instructions on how to access the code. In addition, the model code will be available on our website (https://iccm.k-state.edu/) upon publication.
Results
Comparison of Model Predictions with Calibration Data Sets
Global evaluation of model goodness of fit.
Following model calibration, the model-predicted maternal and fetal/neonatal plasma concentrations of PFOS in rats and humans during gestational and lactational periods were compared with measured data in rats and human biomonitoring studies. The overall goodness-of-fit plot between model predictions and observed data is shown in Figure 2A. The variations of the predicted-to-observed ratios for each of the observed data points are illustrated in Figure 2B. Overall, the model predictions showed a very good agreement with the available experimental data (adj. was 0.98) and the variations of predicted-to-observed ratios were, in general, within a factor of 2, which met the WHO PBPK model precision criteria (WHO 2010). Comparisons of the predicted time-varying kinetic profiles of PFOS concentrations with the calibrated data for both the rat and human models are shown in Figures S1–S3.
Figure 2.
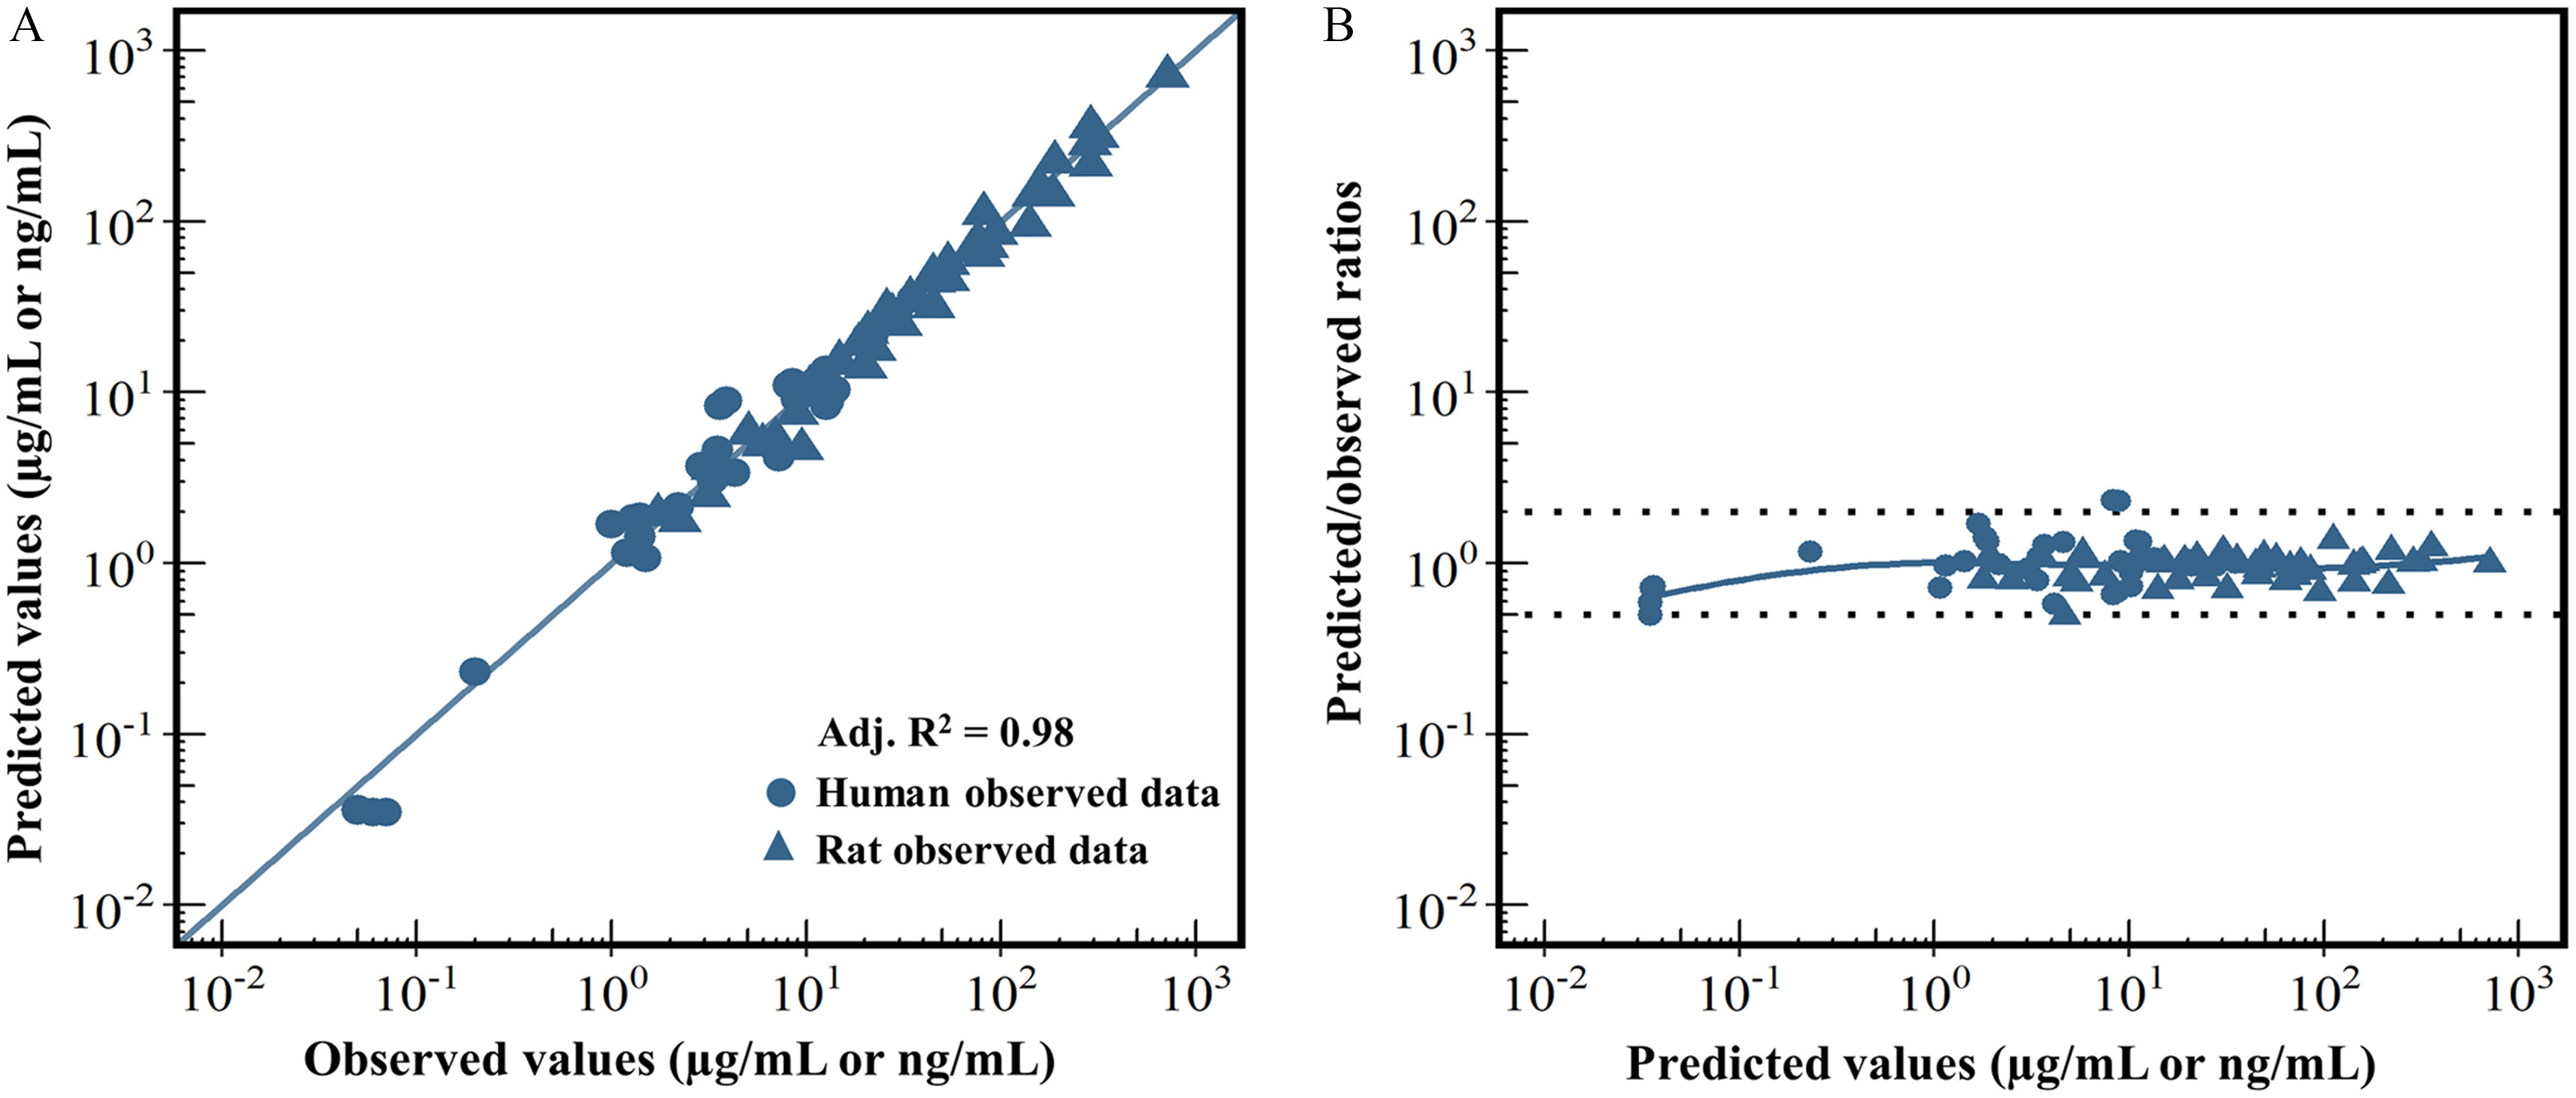
Model calibration results. (A) represents a global evaluation of goodness of model fit between the model-predicted (y-axis) and the observed data (x-axis). (B) represents a plot of the predicted-to-observed ratio vs. the model-predicted value. In (A), different symbol shapes are used for rat (triangle) and human (circle) data. The solid blue diagonal line represents the unity line where the observed value and the predicted value are equal. In (B), the dashed line represents a predicted-to-observed ratio of or , and the solid blue line is the smoothed high-order polynomial curve. Adj. represents the adjusted -square value estimated by the linear regression model. The corresponding numeric data of this figure are available in the “Excel Figure 2” tab of the Supplemental Material Excel file.
Sensitivity Analysis
The parameters with absolute values of normalized sensitivity coefficients (NSCs) on at least one of selected dose metrics in both the gestational and lactational models in rats and humans are shown in Table 3. The normalized sensitivity coefficients (NSCs) for all parameters are presented in Table S7. For the rat gestational model, the placental transfer rate constants (Ktrans1C and Ktrans2C) had a relatively high influence on fetal plasma AUC. The maternal BW, biliary elimination rate constant (KbileC), partition coefficient of liver (PL), and VLC each had a significant contribution to both maternal and fetal plasma AUCs in rats. Similarly, in the human, placental transfer rate constants and the free fraction of PFOS in fetal plasma (Free_Fet) had a high impact on the fetal plasma AUC, whereas the maternal BW, free fraction of PFOS in plasma (Free), QC, and blood flow to kidney (QK_P) for mothers during pregnancy were also sensitive parameters for both human maternal and fetal plasma AUCs. In the rat lactational model, the parameters of maternal BW, the partition coefficient of the liver (PL), and the fraction of VLC were sensitive to both maternal and neonatal plasma AUCs. In addition, the distribution coefficient for milk-to-mammary gland (PMilkM), the milk production parameters (KMilkC and KMilk0), the partition coefficient of the rest of the body in pups (PRest_pup), and the free fraction of PFOS in maternal plasma were highly sensitive to neonatal plasma AUC in rats. For the human lactational model, the most sensitive parameters for the neonatal plasma AUC were the transfer rate constant of mammary tissue to milk (PAMilkC). Several parameters such as maternal BW, free fraction of maternal plasma (Free), renal reabsorption parameter (KeffluxC), QC scalar (QCC), and the fraction of blood flow to kidney (QKC) had a great impact on both maternal and neonatal plasma AUCs.
Table 3.
Normalized sensitivity coefficients (NSCs) of relatively sensitive parameters on the area under curves (AUCs) for concentrations of PFOS in maternal, fetal, and neonatal plasma for rats and humans during gestation and lactation.
| Parameter | Maternal NSCs | Fetal or neonatal NSCs |
|---|---|---|
| Rat gestation | ||
| Maternal body weight (BW) | ||
| Biliary elimination rate constant (KbileC) | ||
| Mother-to-fetus placental transfer rate constant (Ktrans1C) | 0.87 | |
| Fetus-to-mother placental transfer rate constant (Ktrans2C) | ||
| Liver-to-plasma (PL) PC | ||
| Fraction of liver tissue (VLC) | ||
| Rat lactation | ||
| Maternal BW | ||
| Free fraction in maternal plasma (Free) | 0.77 | |
| Free fraction in plasma for rat pups (Free_pup) | ||
| Zero-order milk suckling rate constant for one individual pup (KMilk0) | 0.51 | |
| Milk suckling rate constant (KMilkC) | 0.50 | |
| Liver-to-plasma (PL) PC | ||
| Liver-to-plasma for rat pups (PL_pup) PC | ||
| Milk-to-mammary gland (PMilkM) PC | 0.50 | |
| Rest of body-to-plasma for rat pups (PRest_pup) PC | ||
| Fraction of VLC | ||
| Human gestation | ||
| Maternal BW | ||
| Free | 0.41 | |
| Free fraction in fetal plasma (Free_Fet) | ||
| Rate constant of clearance from PTCs to blood (KeffluxC) | 0.50 | |
| Mother-to-fetus placental transfer rate constant (Ktrans1C) | 0.98 | |
| Fetus-to-mother placental transfer rate constant (Ktrans2C) | ||
| Cardiac output (QC) | ||
| CO scalar (QCC) | ||
| Maternal blood flows of kidney during pregnancy (QK_P) | ||
| Maternal BW | ||
| Human lactation | ||
| Maternal BW | ||
| Neonatal BW (BW_neo) | ||
| Free | 0.50 | |
| Free fraction in neonatal plasma (Free_neo) | ||
| Mother KeffluxC | 0.54 | 0.54 |
| Neonate KeffluxC (KeffluxC_neo) | 0.34 | |
| Permeability area cross product from mammary to milk (PAMilkC) | 0.83 | |
| Rest of body-to-plasma PC for the neonate (PRest_neo) | ||
| QCC | ||
| Fractional blood flow to kidney (QKC) | ||
| Fraction of kidney tissue (VKC) | ||
Note: Only parameters with on at least one of the maternal, fetal, and neonatal plasma AUCs are shown in this table. The maternal/fetal/neonatal plasma AUCs were calculated based on the simulation results at 39 wk of gestational age in humans, 20 d of gestational days in rats, 6 months postpartum in humans, and PND20 in rats with an assumed maternal exposure dose of in humans (Loccisano et al. 2013) and in rats (Luebker et al. 2005b) for both the gestational and lactational models. PC, partition coefficient; PFOS, perfluorooctane sulfonate; PND, postnatal day; PTCs, proximal tubule cells.
Comparison of Model Predictions with Evaluation Data Sets
Rat data.
Model simulations of maternal plasma, liver, and fetal/neonatal concentrations of PFOS were compared with the measured data from the studies by Luebker et al. (2005a, 2005b) and Chang et al. (2009) (Figure 3 and Table 4). The simulated PFOS concentrations in maternal and neonatal plasma in comparison with the experimental data (Luebker et al. 2005a, 2005b) resulting from 0.1, 0.4, and doses to the dam are shown in Figure 3. The predictions were in good agreement with the experimental data for both the maternal and neonatal plasma during gestation and lactation. The comparisons of model predictions with measured maternal plasma, maternal liver, fetal, and neonatal plasma concentrations of PFOS on GD20, GD21, PND5, and PND21 at different dose levels (0.1, 0.3, 0.4, 1, 1.6, and ) (Chang et al. 2009; Luebker et al. 2005a, 2005b) are shown in Table 4. Overall, there was a very good agreement between predicted and observed data (within a 2-fold range of the experimental data) for the majority of the maternal and fetal plasma/tissue data points across dose groups, except an underestimation ( difference from experimental data) of the fetal plasma on GD21 at dose levels of 0.1, 0.4, and and the overestimation of maternal liver at the dose group on PND5.
Figure 3.
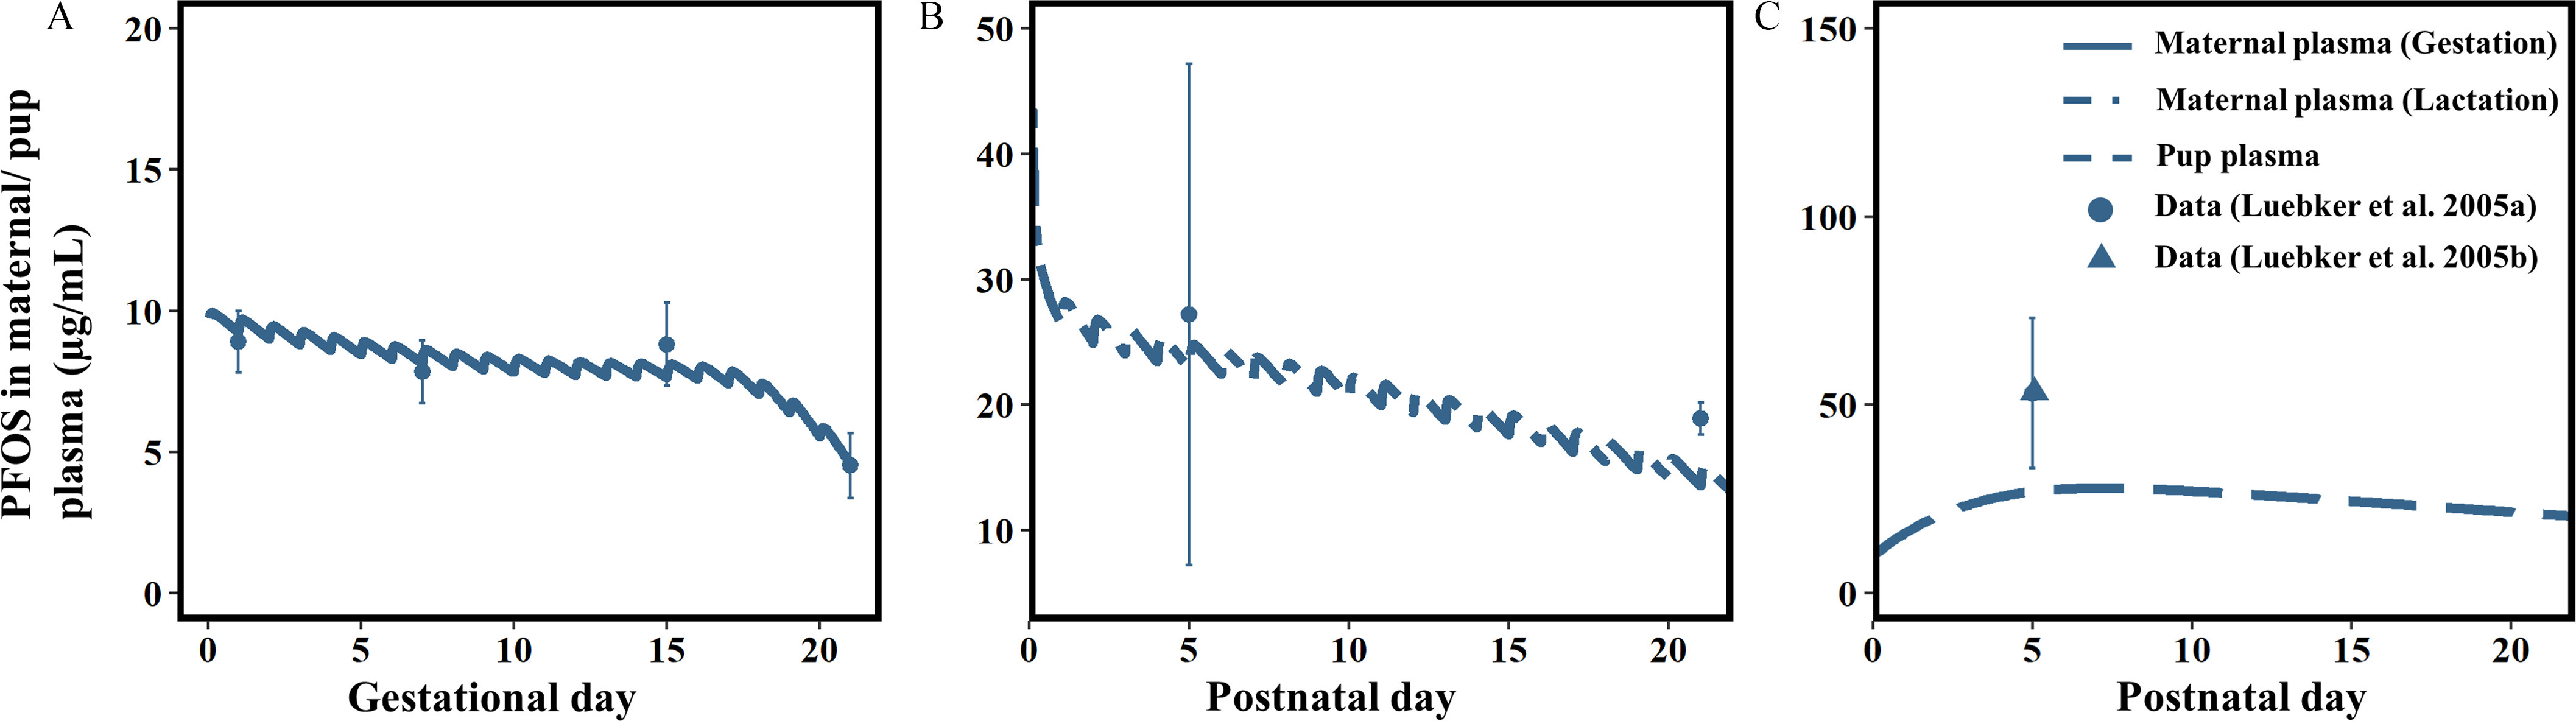
Model evaluation results in rats. Comparisons of the model-predicted vs. the observed PFOS levels () in maternal plasma during (A) gestation [maternal dose was as an example; data collected from Luebker et al. (2005a)] and (B) lactation [maternal dose was as an example; data collected from Luebker et al. (2005a)]; and (C) pup plasma in rats [maternal dose was as an example; data collected from Luebker et al. (2005b)]. The corresponding numeric data of this figure are available in the “Excel Figure 3” tab of the Supplemental Material Excel file. Note: PFOS, perfluorooctane sulfonate; SD, standard deviation.
Table 4.
Model-predicted and measured concentration of PFOS in maternal plasma, maternal liver, fetal/neonatal plasma, and fetal/neonatal liver at the end of gestation (GD21), early (PND5), and later lactation (PND21) periods.
| Tissue | Gestation (GD20)a | Gestation (GD21)b | Lactation (PND5)b | Lactation (PND21)c | ||||
|---|---|---|---|---|---|---|---|---|
| Simulated | Experimental | Simulated | Experimental | Simulated | Experimental | Simulated | Experimental | |
| Maternal plasma (mg/L) | d | d | — | d | ||||
| Maternal liver () | d | d | — | d | ||||
| Fetal/neonatal plasma (mg/L) | d | — | — | |||||
| Fetal/neonatal liver () | d | d | — | d | ||||
| Maternal plasma (mg/L) | d | — | — | — | ||||
| Maternal Liver () | d | — | — | — | ||||
| Fetal/neonatal plasma (mg/L) | d | — | — | — | ||||
| Fetal/neonatal liver () | — | — | — | |||||
| Maternal plasma (mg/L) | — | d | d | d | ||||
| Maternal Liver () | — | d | d | d | ||||
| Fetal/neonatal plasma (mg/L) | — | d | — | |||||
| Fetal/neonatal liver () | — | — | d | d | ||||
| Maternal plasma (mg/L) | d | — | d | — | ||||
| Maternal Liver () | d | — | — | — | ||||
| Fetal/neonatal plasma (mg/L) | d | — | d | — | ||||
| Fetal/neonatal liver () | — | — | — | |||||
| Maternal plasma (mg/L) | — | d | d | d | ||||
| Maternal Liver () | — | d | — | |||||
| Fetal/neonatal plasma (mg/L) | — | d | — | — | ||||
| Fetal/neonatal liver () | — | — | d | d | ||||
| Maternal plasma (mg/L) | — | d | — | — | ||||
| Maternal Liver () | — | d | — | — | ||||
| Fetal/neonatal plasma (mg/L) | — | — | — | |||||
| Fetal/neonatal liver ()) | — | — | — | — | ||||
Note: —, value not available in the experimental study; GD, gestational day; PFOS, perfluorooctane sulfonate; PND, postnatal day; SD, standard deviation.
Sprague-Dawley rats were exposed to PFOS (0.1, 0.3, and ) by daily oral gavage from gestational day (GD) 0 (day positive for mating) through GD19 and sacrificed on GD20 (Chang et al. 2009). Measured and simulated values are expressed as .
Sprague-Dawley rats were exposed to PFOS (0.1, 0.4, 0.8, 1, 1.2, 1.6, 2, or ) by daily oral gavage from 6 wk prior to mating and during mating (maximum of 14 d) to PND4 (total of 82 d), and then concentrations were determined on PND5 (Luebker et al. 2005b). Serum and urine samples during gestation (GD1, GD7, GD15, and GD21) were taken from the dams and fetuses from the dose groups of 0.1, 0.4, 1.6, and , and the serum samples during lactation (PND5) were sampled on the dose groups of 0.4, 0.8, 1, 1.2, 1.6, and . The liver samples of dams and fetuses/pups were obtained only at the end of gestation (GD21) from the dose groups of 0.1, 0.4, 1.6, and and on PND5 from the 0.4, 1.6, and dose groups. Only data from commonly used dose groups and commonly sampled time points are presented.
Sprague-Dawley rats were exposed to PFOS (0.1, 0.4, 1.6, ) by daily oral gavage from 6 wk prior to mating and during mating (maximum of 14 d) to postnatal day PND20 (total of 98 d), and then concentrations were determined on PND21 (Luebker et al. 2005a).
Simulated values are within a 2-fold range of the experimentally-measured values.
Human biomonitoring data.
The comparisons of the predicted PFOS concentrations from the prepregnant PBPK model after a 30-y simulation with the measured levels in the U.S. woman population reported by NHANES from 2005 to 2014 (CDC 2018) are shown in Figure S4. The results showed that the predicted serum PFOS concentrations (median: ) were within a 2-fold difference of the observed median levels in the U.S. woman population (14.4, 10.7, 7.65, 5.1, and reported in 2005–2006, 2007–2008, 2009–2010, 2011–2012, 2013–2014 NHANES data sets, respectively) (Figure S4). Figure 4A describes the trend of predicted PFOS levels in maternal and fetal/neonatal plasma following 30 y of prepregnant PFOS exposure, and then exposure during gestation and lactation at an environmentally relevant exposure level of (Loccisano et al. 2013). As pregnancy progresses, the plasma PFOS levels in the mother and fetus were decreased and then were increased at the time of delivery. Upon delivery, the mother’s predicted PFOS plasma concentrations were increased because the plasma volume contraction in the mother occurs immediately after giving birth. The predicted neonatal PFOS concentrations in plasma were increased during lactation (the first 6 months of the breastfeeding period), reached a level close to the maternal level at the end of lactation, and then the modeled PFOS concentrations were decreased after breastfeeding ended. Figure 4B shows the predicted PFOS concentrations in milk slowly increased to the end of breastfeeding (25 wk postpartum).
Figure 4.
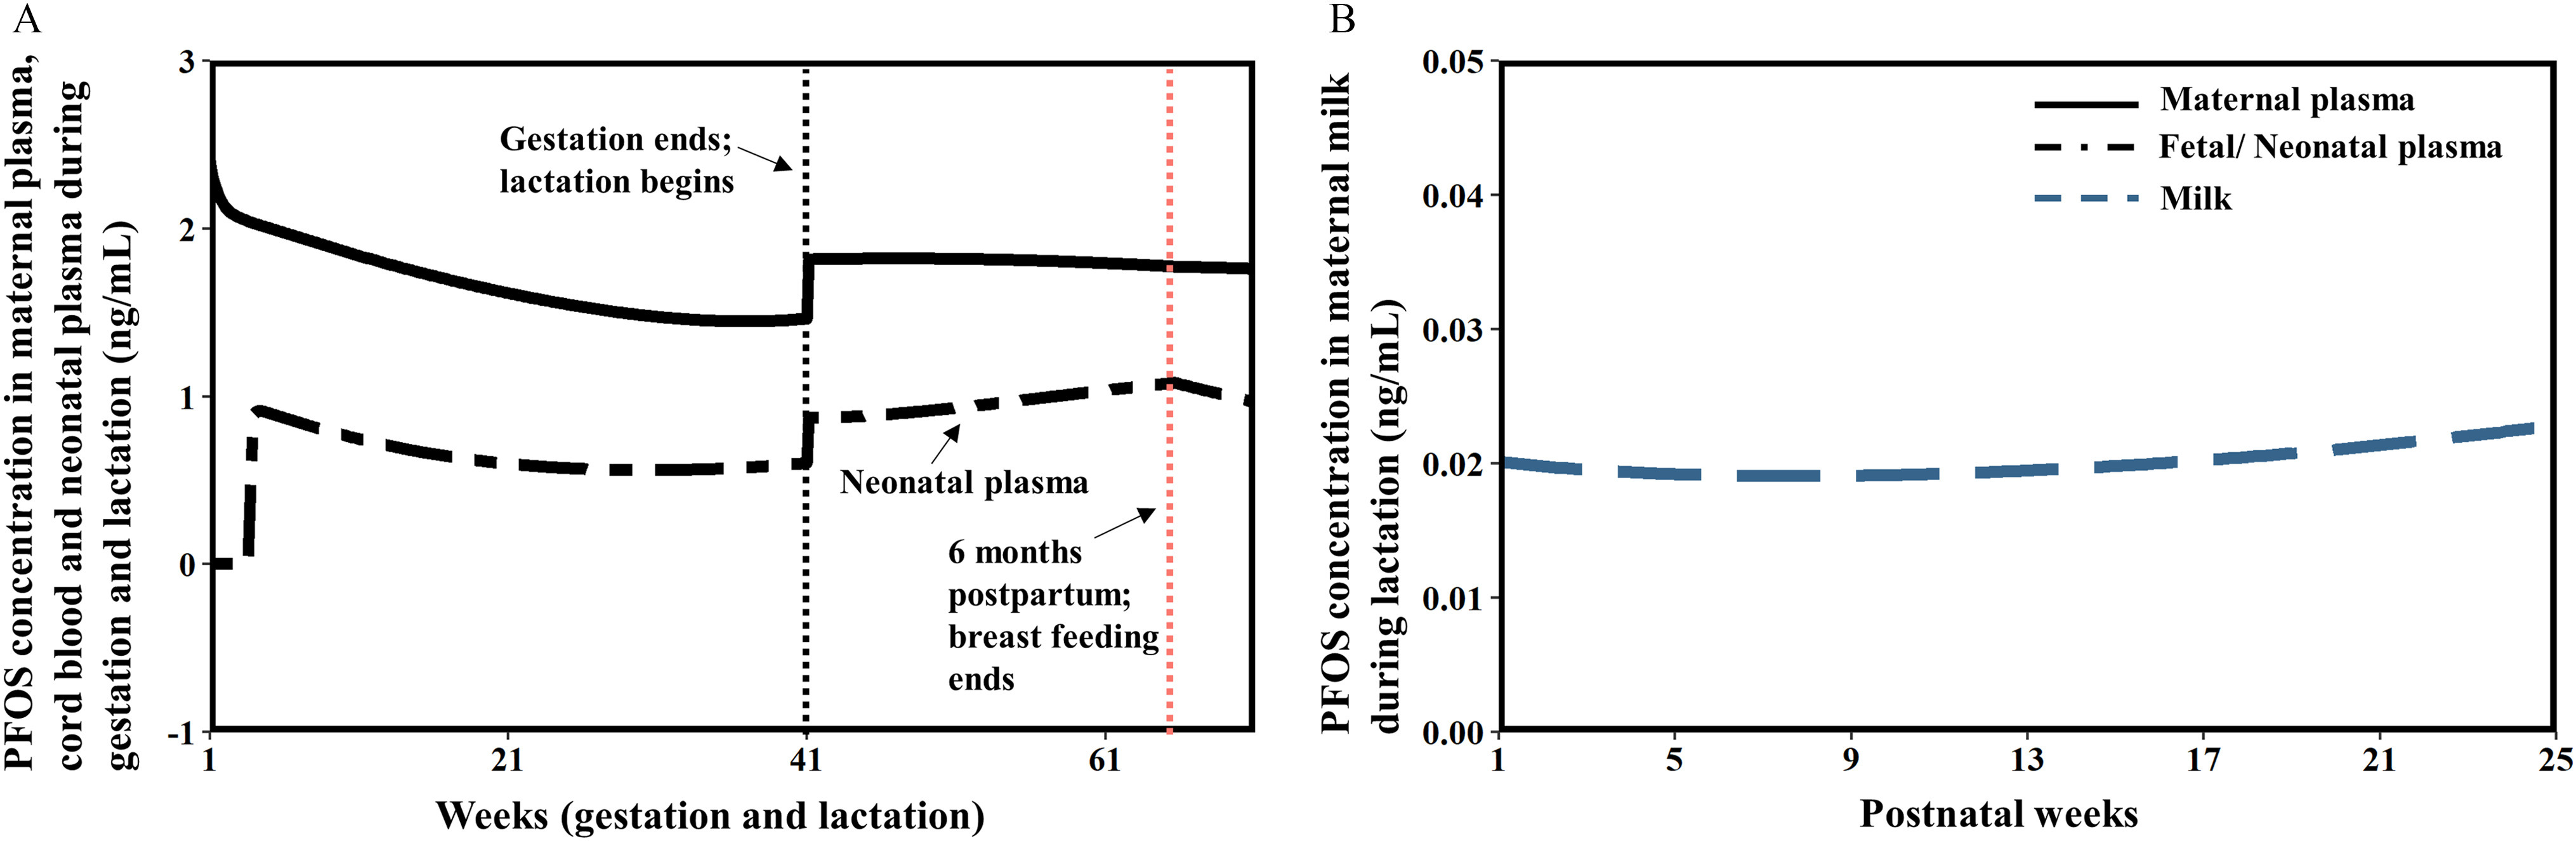
Model evaluation results in humans. General trends of model predictions for PFOS concentrations during gestation and lactation in humans (maternal dose was for these simulations; the assumed dose was collected from Loccisano et al. 2013). (A) Model-predicted PFOS levels in maternal plasma, cord blood, neonatal plasma, and (B) milk during gestation and lactation in humans. The corresponding numeric data of this figure are available in the “Excel Figure 4” tab of the Supplemental Material Excel file. Note: PFOS, perfluorooctane sulfonate.
Figure 5 shows a histogram of model simulations compared with global measurements of PFOS concentrations in maternal plasma, fetal plasma, and milk from different studies involving a variety of human populations. By varying relevant physiological parameters and with the optimized parameters, the human PBPK model generated a population (1,000 individuals) simulation of PFOS concentrations in maternal, fetal plasma, and milk, which were compared with available biomonitoring data based on the possible exposure scenarios and doses (ranging from 0.19 to ) obtained from the literature (Loccisano et al. 2013). The median values ( for maternal plasma, for fetal plasma, and for milk) and ranges of model prediction ( for maternal plasma, for fetal plasma, and for milk) were quite close to the values reported in the literature [median: for maternal plasma, for fetal plasma, and median for milk] (Cariou et al. 2015; Chen et al. 2017; Fromme et al. 2010; Gützkow et al. 2012; Lee et al. 2013; Liu et al. 2011; Mamsen et al. 2017; Midasch et al. 2007; Monroy et al. 2008; Yang et al. 2016; Zhang et al. 2013b).
Figure 5.
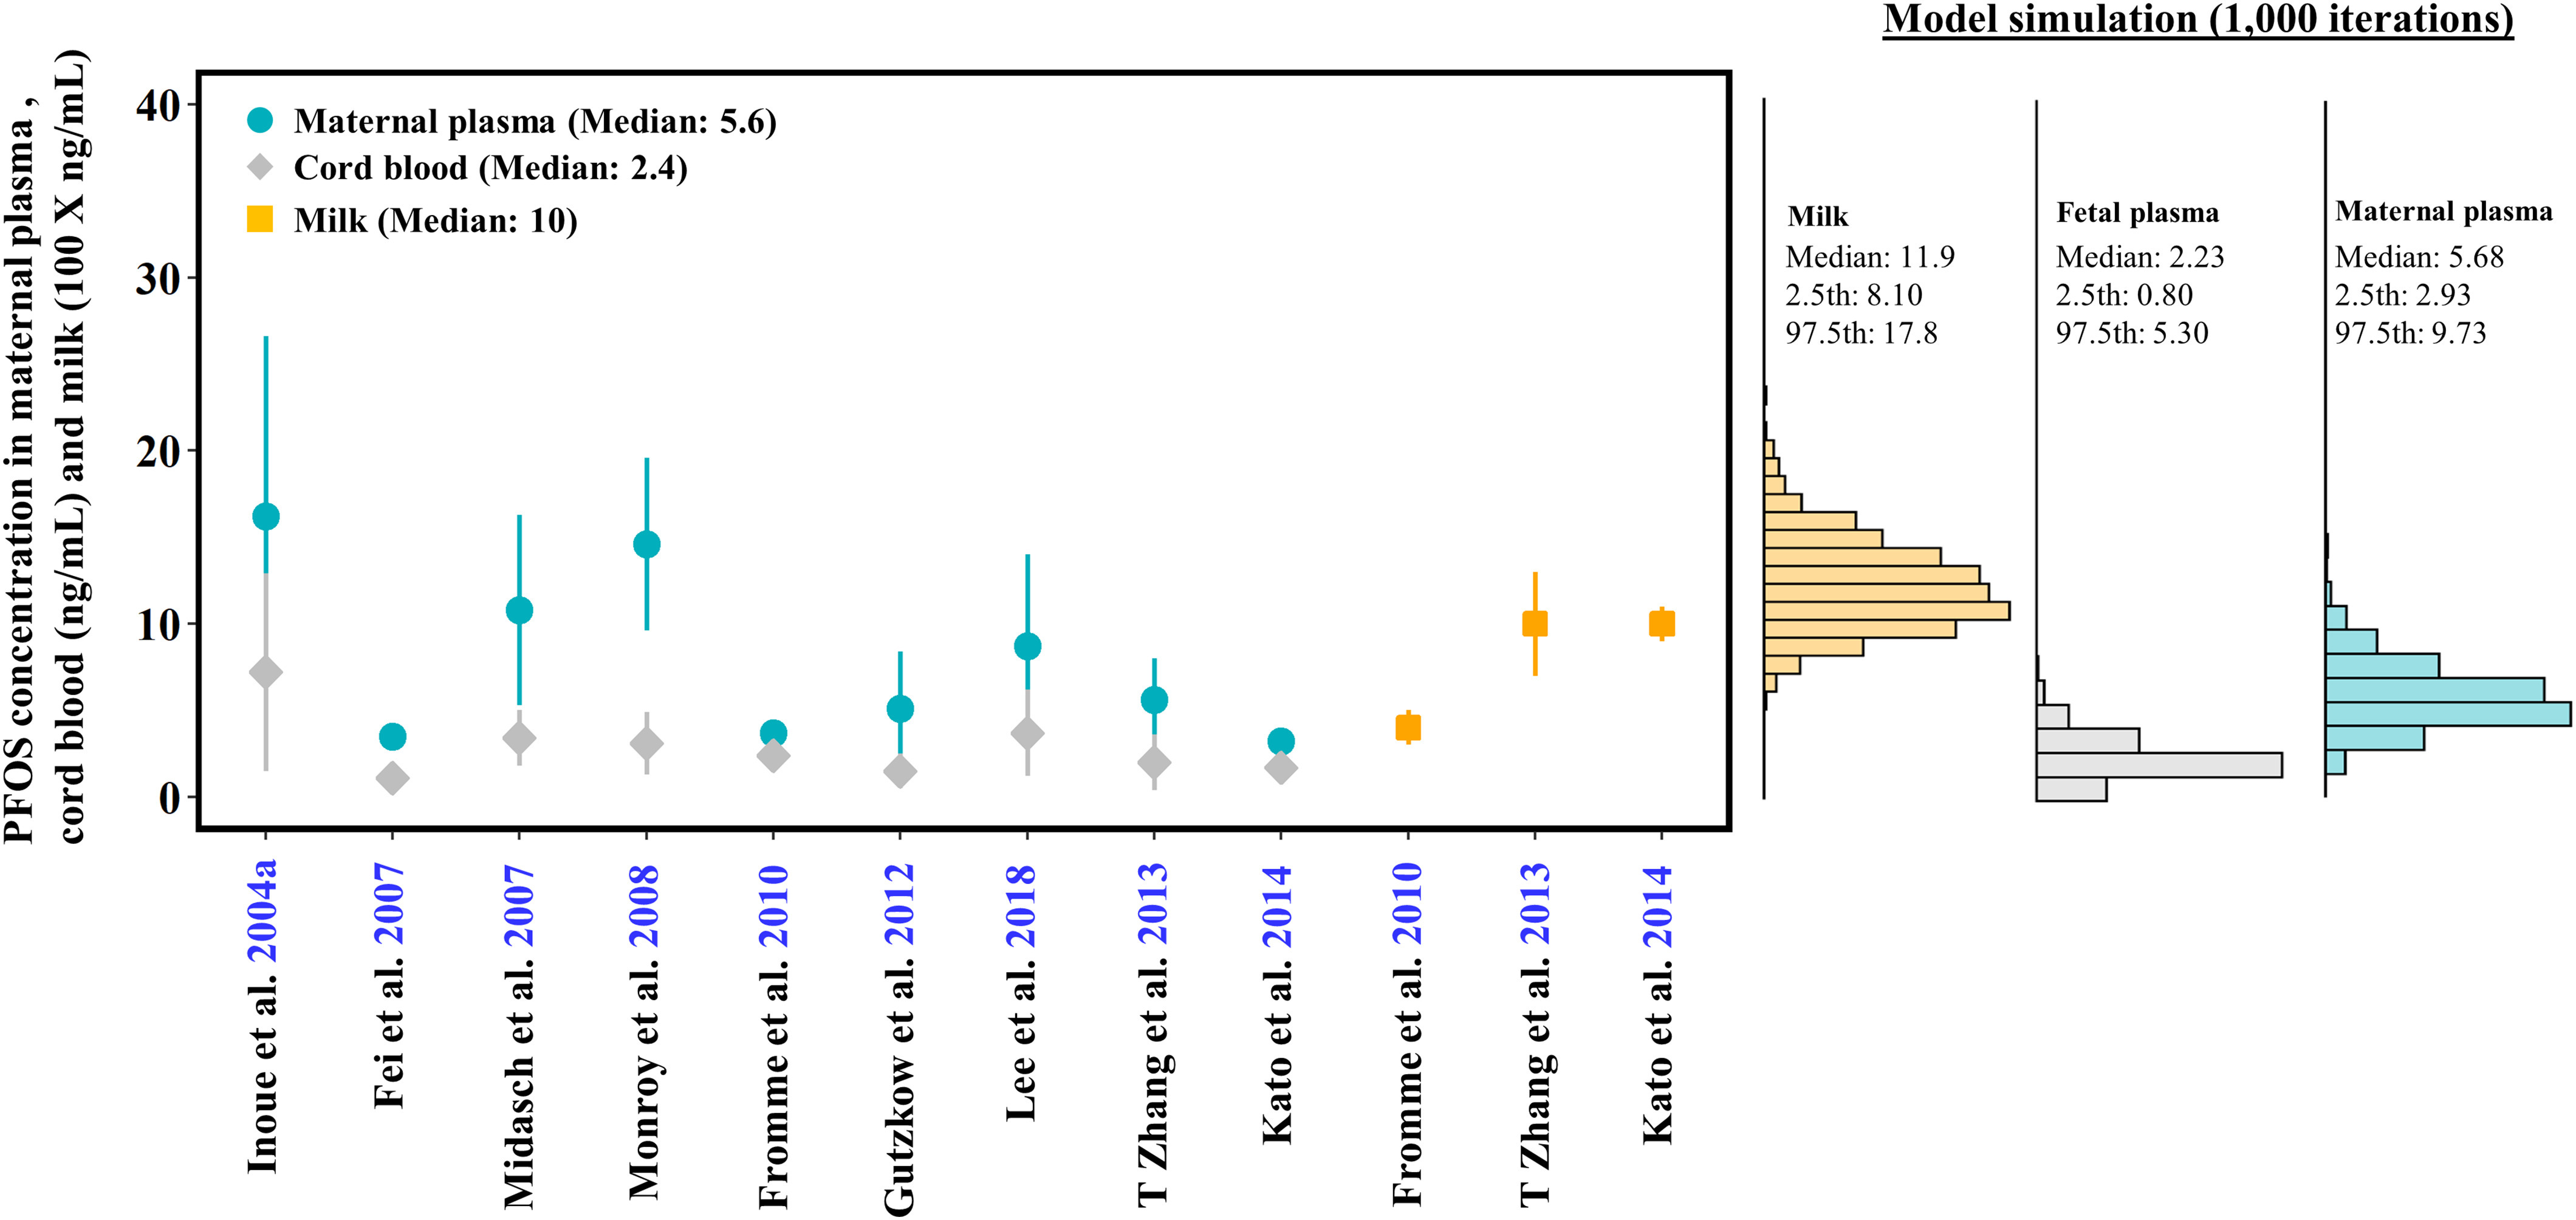
Histogram of model simulations compared with measured values of PFOS concentrations () in maternal plasma (circle), cord blood (diamond), and breast milk (square) from different studies using different human populations from all over the world. The dose range for the simulation was . Note that the units for maternal plasma and cord blood (ng/mL) vs. milk () data are 100-fold different, so that the data can be presented on a similar scale in the same figure. The corresponding numeric data of this figure are available in the “Excel Figure 5” tab of the Supplemental Material Excel file. Note: PFOS, perfluorooctane sulfonate; SD, standard deviation.
Model Application to Predict the HED
Table 5 compares the human equivalent dose (HED) values for the selected critical developmental toxicity studies in rats from the current U.S EPA guidance (U.S. EPA 2016) with the HED values derived in the present study. In this study, the HED values were derived using reverse dosimetry with the gestational and lactational PBPK models coupled with MC simulations. The fifth percentile of estimated HED based on the ASC approach (i.e., Method 1 in Table 5) and incorporated with our gestational and lactational model in rats ranged from 0.08 to , which were about 1.5- to 8-fold lower than the U.S. EPA guideline values derived from the same rat studies. When using the AUC method (Method 2 in Table 5), the fifth percentile of estimated HED levels ranged from 0.19 to , which were also lower than the values (0.51 to ) from the U.S. EPA (2016).
Table 5.
Comparison of the derived average serum concentration (ASC) and human equivalent dose (HED) and 95% confidence interval from the rat and human models with the values from U.S. EPA guidance.
| References | Species/critical effects | Dosing duration (days) | NOAEL (mg/kg/day) | ASCa (mg/L) | HED () | |||
|---|---|---|---|---|---|---|---|---|
| U.S. EPA | This study | U.S. EPA | Method 1b | Method 2c | ||||
| Luebker et al. 2005a | Rat (decreased pup BW) | 98 | 0.1 | 6.26 | 1.57 (0.97, 2.48) | 0.51 | 0.13 (0.08, 0.20) | 0.37 (0.19, 0.67) |
| Luebker et al. 2005b | Rat (decreased maternal BW, gestation length, and pup survival) | 78 | 0.4 | 19.9 | 4.56 (2.67, 9.69) | 1.6 | 0.37 (0.22, 0.78) | 1.79 (0.91, 4.64) |
| Butenhoff et al. 2009 | Rat (decreased pup motor activity and habituation) | 41 | 0.3 | 10.4 | 9.91 (6.29, 15.8) | 0.84 | 0.80 (0.51, 1.28) | 1.21 (0.64, 2.07) |
| Lau et al. 2003 | Rat (decreased pup survival and BW) | 20 | 1.0 | 17.5 | 19.06 (11.3, 41.2) | 1.4 | 1.54 (0.91, 3.34) | 2.15 (1.09, 4.96) |
Note: AUC, area under the curve; BW, body weight; CL, clearance; EPA, Environmental Protection Agency; NOAEL, no observed adverse effect level.
ASC represents the average serum concentration at the NOAEL exposure level for rat. ).
HED () was estimated based on the average serum concentration , where (U.S. EPA 2016).
This study estimated HED by the NOAEL multiplied by the ratios of serum area under between rats and humans (e.g., ).
Discussion
The present gestational and lactational PBPK model successfully simulated PFOS disposition and kinetics during pregnant and lactating periods in both rats and humans. Dynamic changes of physiological parameters during gestation and lactation that may affect the kinetics and placental/lactational transfer of PFOS were described in this model. Based upon past modeling efforts, a physiologically based description of transporter-mediated renal reabsorption and excretion of PFOS was first included in the present gestational and lactational PBPK model. Uncertainty and variability of the sensitive and estimated parameters were accounted for using MC simulation. The final PBPK model was applied to derive HEDs based on selected critical developmental toxicity studies from the U.S. EPA report (U.S. EPA 2016), and the derived HED values were either similar to or lower than the values from the U.S. EPA report depending on the method used. This model can be used to aid in the risk assessment of PFOS in sensitive subpopulations, such as pregnant women, fetuses, and infants; this model also serves as a basis for extrapolating to other PFAS chemicals to support the risk assessment of this important family of environmental contaminants.
Gestational and Lactational PBPK Model for PFOS
Several gestational and lactational PBPK models for PFOA and PFOS have been published (Brochot et al. 2019; Loccisano et al. 2012a, 2013; Verner et al. 2015), and most of these models were developed based on the basic PBPK model from Loccisano et al. (2012a) (a summary comparing features of our model with existing PFOA and PFOS PBPK models is presented in Table S10 and Section 1, “Summary of existing PBPK models for PFOA and PFOS,” of the Supplemental Material Word file). These earlier models have already included the dynamic changes of physiological parameters in women during pregnancy and lactation as well as the development of the fetus and neonate, and underlined the importance of renal elimination mechanisms during pregnancy and lactation through a single transporter describing Oatp1a1 uptake of PFOA and PFOS, but these models have not accounted for transporter-mediated renal excretion. Given the important role that renal elimination mechanisms (i.e., the excretion via GFR and reabsorption/excretion via transporters) play in the TK behavior of PFOS during gestation and lactation, incorporation of a physiologically based description of transporter-mediated reabsorption and excretion may potentially increase the physiological relevance of the present model compared with existing models. Our results demonstrated that the renal reabsorption/excretion governed by transporters influenced the model outputs in humans and supported the findings that this process might be critical drivers to affect the serum PFOS concentrations during gestation and lactation (Loccisano et al. 2013). In addition, key chemical-specific parameters and the known mechanisms that determine the TK of PFOS (e.g., renal reabsorption/excretion) were included in the present model, and all uncertain chemical parameter values were optimized by fitting to multiple data sets simultaneously. These efforts allowed us to simulate PFOS TK behavior appropriately during gestation and lactation, and the final model was able to adequately simulate observed data in multiple animal (Chang et al. 2009; Luebker et al. 2005a, 2005b) and human biomonitoring studies (Cariou et al. 2015; Chen et al. 2017; Fromme et al. 2010; Gützkow et al. 2012; Kim et al. 2011; Lee et al. 2013; Liu et al. 2011; Mamsen et al. 2017; Monroy et al. 2008; Yang et al. 2016; Zhang et al. 2013b).
Sensitivity Analysis
Sensitivity analysis is a useful approach to provide a quantitative comparison of the influences of different parameters on the model predictions during different life stages. Our results showed that the sensitivities of most parameters were quite similar between the rat and human models during gestation. The most sensitive parameters to fetal exposure were the bidirectional placental transfer rate constants (Ktrans1C and Ktrans2C) for both rats and humans. These parameters determine how much and how quickly PFOS could be transferred from the mother to the fetus (or back to the mother from the fetus). Similarly, previous studies also identified the placental transfer rate constants as the key determinant of fetal exposure to PFOS in rats (Loccisano et al. 2012b) and humans (Brochot et al. 2019; Loccisano et al. 2013). The mammary-to-milk permeability rate constant (PAMilkC) specific to the lactational model also had a great impact on the neonatal plasma in humans. The PAMilkC determines how much PFOS could be transferred from the mammary gland to breast milk. This result was in agreement with the observations from epidemiological studies that showed milk was a major excretion route of PFOS for the mother and an important exposure source for the infant (Mondal et al. 2014; Thomsen et al. 2010). For the renal reabsorption/excretion parameters, the clearance rate of PFOS from PTCs to blood (KeffluxC) was highly sensitive to plasma AUC for the mother and fetus/neonate in the human gestational and lactational model. These results indicate that the renal excretion parameter is important and should be considered in the model simulation for PFOS, especially for the gestational and lactational periods for humans. In addition, several physiological parameters were also sensitive in the human gestational and lactational model including the maternal BW, QC, and blood flow of the kidney (i.e., QK).
In the present study, multiple parameters, such as those related to renal transport, oral absorption, and biliary excretion had to be mathematically optimized because of a lack of experimental data that directly inform them, that is, these parameters are not well identified. To decrease uncertainty of these parameters, we optimized these unknown parameters by fitting to all available calibration data sets simultaneously (i.e., global optimization) with the starting values of these parameters derived from earlier models for the same chemical PFOS (Loccisano et al. 2012a, 2013) or a structurally similar chemical PFOA (Worley et al. 2017; Worley and Fisher 2015), that is, the starting values of these parameters were tested and verified in earlier studies and thus already had some degree of biological relevance to begin with. This optimization approach could, to some degree, decrease the uncertainty of these unknown parameters that were then trained to be able to achieve a local optimum. However, we cannot rule out the possibility that there is not another optimum that has similar prediction performance, but with greater biological relevance. Additional experimental studies that directly measure these parameters’ values would be helpful to increase the realism of the present model.
Model Evaluation
Although the present model was able to adequately simulate the majority of available data, it slightly overestimated PFOS levels in the maternal liver during the lactational period (PND5) in rats (Table 4). The reason for this overestimation is unknown, but it could be due to the lack of appropriate parameters to simulate the TK behavior of PFOS in the liver. The liver is the primary target organ and a site of accumulation for PFOS (Fai Tse et al. 2016; Han et al. 2018; Wan et al. 2016). It has been reported that PFOS can bind to the liver fatty acid-binding protein (L-FABP) and interfere with the accumulation of PFOS in the liver (Luebker et al. 2002; Zhang et al. 2013a). Although the influence of PFOS binding to L-FABP on its liver dosimetry remains to be elucidated, a previous study used the Michaelis-Menten equation to describe the protein binding of PFOS in the liver and simulated the liver concentration in the pregnant rat (Loccisano et al. 2012b). The simulated result from this study appears to be in agreement with the observed data. Additional information on changes in the levels of liver L-FABP protein or changes in binding kinetics, and also information on any changes in the expression and dynamics of liver transporters that may affect the disposition of PFOS in the liver, would help to improve our model (Zhao et al. 2017).
For the human model, the time-varying PFOS profiles in pregnant women and fetuses decreased as gestation progressed. However, during lactation, the simulated PFOS concentration in the neonatal plasma was increased to reach a level close to the levels of the mother before the end of breastfeeding. This result is consistent with previous findings that the serum PFOS levels in breastfed infants are similar to or higher than those found in the mother (Fromme et al. 2010; Gyllenhammar et al. 2018; Haug et al. 2011). This result raises a concern of neonatal exposure to PFOS and suggests that the potential risks of neonatal exposure to PFOS through breastfeeding need to be considered relative to the known benefits of breastfeeding, particularly when considering that the developmental effects from early life exposures may be sensitive windows for PFOS toxicity (Kärrman et al. 2007; Llorca et al. 2010).
The human model simulation results were also compared with multiple biomonitoring studies. Because the biomonitoring data were collected from different human populations from different countries and the exposure doses and sources were unknown, the PBPK model was extended to become a population model by accounting for the variability of parameters between individuals with various exposure scenarios via MC simulation (exposure doses ranging from 0.19 to , estimated by Loccisano et al. 2013); the population model simulation results were compared with the observed maternal plasma, cord blood, and milk data from human biomonitoring studies (Fei et al. 2007; Fromme et al. 2010; Gützkow et al. 2012; Inoue et al. 2004b; Kato et al. 2014; Lee et al. 2013; Midasch et al. 2007; Monroy et al. 2008; Zhang et al. 2013b). As shown in Figure 5, the simulated population results correlated with observed data quite well, although there were still some uncertainties associated with the exposure dose. Additional studies on exposure information of PFOS in the mother, fetus, and infant should improve the ability of the model to recapitulate human studies.
Comparison of Estimated HED and RfD Values with the Guidance Values from U.S. EPA and EFSA
Health-based toxicity values (e.g., RfD) are estimated by governmental agencies to serve as an acceptable exposure level to protect the general population, including sensitive subpopulations (e.g., pregnant women or fetuses), from adverse health outcomes resulting from exposure to chemicals. However, the reference dose for PFOS derived from the U.S. EPA (2016) is of high uncertainty (Dong et al. 2017; Dong and Naidu 2019; Wambaugh 2018). Specifically, an empirical TK model was developed by Wambaugh et al. (2013) and then the model was used by the U.S. EPA to derive the chronic oral RfD of for PFOS (U.S. EPA 2016). The model was used to predict the ASCs achieved in toxicity studies conducted using various animal models (e.g., CD-1 mouse, C57BL/6 mouse, Sprague-Dawley rat, cynomolgus monkey). The ASCs of animals were then extrapolated to calculate equivalent steady-state concentrations in humans by multiplying a conservative factor of clearance () derived from a traditional TK model with a first-order elimination of PFOS from plasma (Olsen et al. 2007; Thompson et al. 2010; U.S. EPA 2016). However, there are some limitations and uncertainties of this approach because the traditional TK model is not physiologically based and the parameters are not biologically plausible; therefore, it is not suitable for species extrapolation and the result may be of high uncertainty (Dong et al. 2017; Dong and Naidu 2019; Wambaugh 2018).
Pregnancy is associated with physiological and biochemical changes that might affect the pharmacokinetic properties of PFOS. Not taking account of the parameter changes during pregnancy and prenatal or lactational exposure could underestimate the potential risk for sensitive populations. The present study allows for estimation of the potential impact of the use of only the adult TK model for the derivation of the HED for developmental effects given that this study and the study by the U.S. EPA(2016) used the same critical toxicity end points in animals. The results indicated that the derived fifth percentile HEDs (Method 1 in Table 5) were 1.5–8 fold lower than the values estimated by the U.S. EPA. Using the estimated fifth percentile of HED values resulting from the NOAEL of rat developmental toxicity studies as PODs and the same uncertainty factor of 30 (a factor of 10 to account for the intra-species variability and a factor of 3 to account for interspecies variability in pharmacodynamics) as used in the U.S. EPA guidance (U.S. EPA 2016), the estimated RfD values ranged from 2.67 to . The lowest RfD () derived from the present study is lower than those currently recommended by the U.S. EPA () (U.S. EPA 2016) for the developmental end point (Luebker et al. 2005a), but it is close to the values derived from our previous study (Chou and Lin 2019, 2020) (3 and ) and the health-based guidance value of the EFSA (tolerable daily intake) of ) derived from human studies based on the serum cholesterol end point (EFSA CONTAM Panel 2018). The fifth percentile of HED values derived from another method based on the AUC ratios (Method 2 in Table 5) that were estimated from the developed gestational and lactational model in rats and humans were also lower than the values derived from U.S. EPA report (Table 5). Because the health-based guidance values estimated from U.S. EPA, EFSA, and the present study were based on the different TK or PBPK models, such comparisons would be helpful to serve as a basis for the estimation of guidance values by governmental agencies. In addition, our study suggests that it is important to use a life-stage-appropriate PBPK model to derive HED of age-specific toxicity end points for PFAS.
Limitations
Several limitations of this study should be considered when interpreting our results. First, biomonitoring data reflect an internal dose that corresponds with the external exposure from all possible sources and by all routes. The use of such data, for which exposure data are not available, is challenging. In the present study, we had to assume the exposure level was constant before pregnancy, during gestation, and lactation for each selected biomonitoring study due to a lack of accurate time-dependent exposure information in each of the selected human biomonitoring studies during different periods. However, variations of maternal dietary consumption, water intake, and PFOS exposure during different periods may cause differences, and thus uncertainty, on estimated PFOS internal dosimetry. To reduce the uncertainty associated with the human exposure dose, in this study the human exposure dose used to simulate each selected biomonitoring study was collected based on a previous PBPK modeling study (Loccisano et al. 2013). The use of a consistent approach for human exposure dose estimations makes the results comparable between our study and the study by Loccisano et al. (2013). In addition, in the Loccisano et al. (2013) model, exposure to PFOS was modeled as a direct input into the maternal plasma compartment (as a way of modeling overall input through all possible exposure routes). Yet, our model assumed that the exposure sources of PFOS were mainly through oral exposure routes and the absorption of PFOS occurred mainly in the stomach and small intestine. We ran additional simulations to compare the maternal plasma concentration and the total absorbed amount between these two methods (i.e., dose input to the stomach vs. directly into the plasma), and we found the discrepancy was very minor (i.e., ) (Table S11).
Second, our model did not account for the other possible elimination pathways of PFOS during gestation and lactation such as the blood loss due to childbirth. Menstruation and blood loss during delivery is a possible additional elimination pathway of PFAS (Lorber et al. 2015; Wong et al. 2014; Wu et al. 2015). However, in our model the amounts of PFOS in plasma and organs at the end of pregnancy were conserved and used as the initial values in the lactational model. As a result, the initial PFOS levels in plasma for lactating women might be somewhat overestimated without considering the excretion of PFOS due to the blood loss at childbirth (the volume of plasma loss was calculated to be 0.7 L from 3.7 L at 40 wk of pregnancy to 3.0 L at the beginning of lactation). Another model uncertainty is that the prepregnant model was a simplified model and the dynamic changes of individual physiological parameters were only based on the changes of BW. Nevertheless, this approach is similar to the approach used in the lifetime PBPK model for PFAS in the latest EFSA guideline (EFSA CONTAM Panel 2020), and the predicted serum PFOS concentrations from the prepregnant female model were very similar to the measured serum PFOS concentrations in the U.S. woman population reported by NHANES from 2005 to 2014 (CDC 2018) (Figure S4).
Third, there is a lack of experimentally measured kinetic parameters for the mother, fetus, and infant. For example, there are no available kinetic data on the alteration of renal reabsorption of PFOS during gestation and lactation. Thus, the relevant renal reabsorption/excretion parameters during gestation and lactation had to be assumed to be the same as in the adult model and used for model calibration for the gestational and lactational model in rats and humans. Despite that the renal reabsorption/excretion parameters were optimized and model predictions were in agreement with the observed data, additional experimentally measured data on key parameters such as plasma protein binding and renal reabsorption/excretion in mothers, fetuses, and neonates will help increase the reliability of the model. Fourth, the placental transporter system (transporter proteins, including the OAT) was not described in the present model. As in the rat model, the placental transfer of PFOS was described as a simple diffusion process. However, the human placenta is known to express several transporter proteins (including the OAT) (Kummu et al. 2015). Based on the fact that OAT4 can transport PFOS (Yang et al. 2010), there may be a possible active transport mechanism for the removal of PFOS from the fetus in addition to simple diffusion. Further studies are needed to refine the model if the transporter kinetic data in placenta become available. Furthermore, development of gestational and lactational PBPK models for PFOS in mice are also needed to facilitate the derivation of POD in risk assessment because most of immunotoxicity data are from mice (Dong et al. 2009, 2011). Finally, the present model is focused only on PFOS. Additional studies are needed to extend the present model to become a generic model that can describe the kinetics of other PFAS chemicals.
Conclusion
In this study, we developed a population PBPK model for PFOS in rats and humans during gestation and lactation. The model included a physiologically based description of transporter-mediated renal reabsorption/excretion and adequately simulated the observed concentration data of PFOS in maternal, fetal, and neonatal plasma, as well as in the milk, from multiple independent data sets that were not used in the model calibration. The model was used to estimate HEDs associated with the PODs of several selected critical developmental toxicity studies in rats based on the latest risk assessment report from U.S. EPA. The HEDs derived from the present gestational and lactational model were lower than the current HED values that were based on an adult TK model recommended by the U.S. EPA (2016). The present model highlights the need of understanding the impact of the life-stage-specific dosimetry on the risk assessment of PFOS, especially in sensitive subpopulations of pregnant women, fetuses, and infants. This study also provides a framework for extrapolating to other PFAS chemicals to support the risk assessment of this important family of environmental contaminants.
Supplemental Materials
Supplemental Materials include the a) Supplemental Material Word file b) Supplemental Zipped file, and c) Supplemental Excel file. The Supplemental Material Word file includes the additional explanation on the model parameters and equations (Tables S1–S6 and S8–S9), supplemental results (Tables S7 and S11 and Figures S1–S4), and a summary of existing PBPK models for PFOA and PFOS (Section 1, “Summary of existing PBPK models for PFOA and PFOS,” and Table S10). The Supplemental Zipped file contains all PBPK model codes in rats and humans, including codes used to generate results presented in Figures 2–5, Figures S1–S4, Tables 3–5, and Table S11, all raw experimental data used in the model calibration and optimization and the instructions and tutorials on how to use the present model and how to reproduce the results presented in this manuscript. The Supplemental Excel file includes all raw model-derived numeric simulation data used in the creation of Figures 2–5 and S1–S4. Supplemental Materials to this article can be found online at the journal’s website.
Supplementary Material
Acknowledgments
This study was supported by Kansas State University College of Veterinary Medicine New Faculty Startup funds. This project started as a course project for the AP 873 PBPK modeling class in the Spring 2019 semester at Kansas State University. The authors thank the students and teaching assistants for their comments.
References
- Abduljalil K, Furness P, Johnson TN, Rostami-Hodjegan A, Soltani H. 2012. Anatomical, physiological and metabolic changes with gestational age during normal pregnancy: a database for parameters required in physiologically based pharmacokinetic modelling. Clin Pharmacokinet 51(6):365–396, PMID: 22515555, 10.2165/11597440-000000000-00000. [DOI] [PubMed] [Google Scholar]
- Andersen ME, Clewell HJ III, Tan YM, Butenhoff JL, Olsen GW. 2006. Pharmacokinetic modeling of saturable, renal resorption of perfluoroalkylacids in monkeys—probing the determinants of long plasma half-lives. Toxicology 227(1–2):156–164, PMID: 16978759, 10.1016/j.tox.2006.08.004. [DOI] [PubMed] [Google Scholar]
- Andersen ME, Sarangapani R, Frederick CB, Kimbell JS. 1999. Dosimetric adjustment factors for methyl methacrylate derived from a steady-state analysis of a physiologically based clearance-extraction model. Inhal Toxicol 11(10):899–926, PMID: 10509026, 10.1080/089583799196709. [DOI] [PubMed] [Google Scholar]
- Beesoon S, Webster GM, Shoeib M, Harner T, Benskin JP, Martin JW. 2011. Isomer profiles of perfluorochemicals in matched maternal, cord, and house dust samples: manufacturing sources and transplacental transfer. Environ Health Perspect 119(11):1659–1664, PMID: 21757419, 10.1289/ehp.1003265. [DOI] [PMC free article] [PubMed] [Google Scholar]
- Brochot C, Casas M, Manzano-Salgado C, Zeman FA, Schettgen T, Vrijheid M, et al. 2019. Prediction of maternal and foetal exposures to perfluoroalkyl compounds in a Spanish birth cohort using toxicokinetic modelling. Toxicol Appl Pharmacol 379:114640, PMID: 31251942, 10.1016/j.taap.2019.114640. [DOI] [PubMed] [Google Scholar]
- Brown RP, Delp MD, Lindstedt SL, Rhomberg LR, Beliles RP. 1997. Physiological parameter values for physiologically based pharmacokinetic models. Toxicol Ind Health 13(4):407–484, PMID: 9249929, 10.1177/074823379701300401. [DOI] [PubMed] [Google Scholar]
- Buist SCN, Klaassen CD. 2004. Rat and mouse differences in gender-predominant expression of organic anion transporter (Oat1–3; Slc22a6–8) mRNA levels. Drug Metab Dispos 32(6):620–625, PMID: 15155553, 10.1124/dmd.32.6.620. [DOI] [PubMed] [Google Scholar]
- Butenhoff JL, Ehresman DJ, Chang SC, Parker GA, Stump DG. 2009. Gestational and lactational exposure to potassium perfluorooctanesulfonate (K+PFOS) in rats: developmental neurotoxicity. Reprod Toxicol 27(3–4):319–330, PMID: 19162172, 10.1016/j.reprotox.2008.12.010. [DOI] [PubMed] [Google Scholar]
- Calafat AM, Kato K, Hubbard K, Jia T, Botelho JC, Wong LY. 2019. Legacy and alternative per- and polyfluoroalkyl substances in the U.S. general population: paired serum–urine data from the 2013–2014 National Health and Nutrition Examination Survey. Environ Int 131:105048, PMID: 31376596, 10.1016/j.envint.2019.105048. [DOI] [PMC free article] [PubMed] [Google Scholar]
- Calafat AM, Kuklenyik Z, Reidy JA, Caudill SP, Tully JS, Needham LL. 2007a. Serum concentrations of 11 polyfluoroalkyl compounds in the U.S. population: data from the National Health and Nutrition Examination Survey (NHANES) 1999–2000. Environ Sci Technol 41(7):2237–2242, PMID: 17438769, 10.1021/es062686m. [DOI] [PubMed] [Google Scholar]
- Calafat AM, Wong LY, Kuklenyik Z, Reidy JA, Needham LL. 2007b. Polyfluoroalkyl chemicals in the U.S. population: data from the National Health and Nutrition Examination Survey (NHANES) 2003–2004 and comparisons with NHANES 1999–2000. Environ Health Perspect 115(11):1596–1602, PMID: 18007991, 10.1289/ehp.10598. [DOI] [PMC free article] [PubMed] [Google Scholar]
- Cariou R, Veyrand B, Yamada A, Berrebi A, Zalko D, Durand S, et al. 2015. Perfluoroalkyl acid (PFAA) levels and profiles in breast milk, maternal and cord serum of French women and their newborns. Environ Int 84:71–81, PMID: 26232143, 10.1016/j.envint.2015.07.014. [DOI] [PubMed] [Google Scholar]
- CDC (Centers for Disease Control and Prevention). 2018. Fourth National Report on Human Exposure to Environmental Chemicals. Updated Tables, March 2018, Volume One. Atlanta, GA: CDC, Department of Health and Human Services. https://www.cdc.gov/exposurereport/pdf/FourthReport_UpdatedTables_Volume1_Mar2018.pdf [accessed 11 October 2020]. [Google Scholar]
- Chang SC, Ehresman DJ, Bjork JA, Wallace KB, Parker GA, Stump DG, et al. 2009. Gestational and lactational exposure to potassium perfluorooctanesulfonate (K+PFOS) in rats: toxicokinetics, thyroid hormone status, and related gene expression. Reprod Toxicol 27(3–4):387–399, PMID: 19429409, 10.1016/j.reprotox.2009.01.005. [DOI] [PubMed] [Google Scholar]
- Chen F, Yin S, Kelly BC, Liu W. 2017. Chlorinated polyfluoroalkyl ether sulfonic acids in matched maternal, cord, and placenta samples: a study of transplacental transfer. Environ Sci Technol 51(11):6387–6394, PMID: 28482666, 10.1021/acs.est.6b06049. [DOI] [PubMed] [Google Scholar]
- Cheng YH, Riviere JE, Monteiro-Riviere NA, Lin Z. 2018. Probabilistic risk assessment of gold nanoparticles after intravenous administration by integrating in vitro and in vivo toxicity with physiologically based pharmacokinetic modeling. Nanotoxicology 12(5):453–469, PMID: 29658401, 10.1080/17435390.2018.1459922. [DOI] [PMC free article] [PubMed] [Google Scholar]
- Chou WC, Lin Z. 2019. Bayesian evaluation of a physiologically based pharmacokinetic (PBPK) model for perfluorooctane sulfonate (PFOS) to characterize the interspecies uncertainty between mice, rats, monkeys, and humans: development and performance verification. Environ Int 129:408–422, PMID: 31152982, 10.1016/j.envint.2019.03.058. [DOI] [PubMed] [Google Scholar]
- Chou WC, Lin Z. 2020. Probabilistic human health risk assessment of perfluorooctane sulfonate (PFOS) by integrating in vitro, in vivo toxicity, and human epidemiological studies using a Bayesian-based dose-response assessment coupled with physiologically based pharmacokinetic (PBPK) modeling approach. Environ Int 137:105581, PMID: 32087483, 10.1016/j.envint.2020.105581. [DOI] [PubMed] [Google Scholar]
- Clewell HJ, Gearhart JM, Gentry PR, Covington TR, VanLandingham CB, Crump KS, et al. 1999. Evaluation of the uncertainty in an oral reference dose for methylmercury due to interindividual variability in pharmacokinetics. Risk Anal 19(4):547–558, PMID: 10765421, 10.1111/j.1539-6924.1999.tb00427.x. [DOI] [PubMed] [Google Scholar]
- Clewell HJ III, Gentry PR, Covington TR, Gearhart JM. 2000. Development of a physiologically based pharmacokinetic model of trichloroethylene and its metabolites for use in risk assessment. Environ Health Perspect 108(suppl 2):283–305, PMID: 10807559, 10.1289/ehp.00108s2283. [DOI] [PMC free article] [PubMed] [Google Scholar]
- Clewell HJ, Gentry PR, Covington TR, Sarangapani R, Teeguarden JG. 2004. Evaluation of the potential impact of age- and gender-specific pharmacokinetic differences on tissue dosimetry, PMID: 15056818, 10.1093/toxsci/kfh109. [DOI] [PubMed]
- Clewell RA, Kremer JJ, Williams CC, Campbell Jr JL, Andersen ME, Borghoff SJ. 2008. Tissue exposures to free and glucuronidated monobutylyphthalate in the pregnant and fetal rat following exposure to di-n-butylphthalate: evaluation with a pbpk model. Toxicol Sci 103:241–259, PMID: 18344531, 10.1093/toxsci/kfn054. [DOI] [PubMed] [Google Scholar]
- Clewell RA, Merrill EA, Yu KO, Mahle DA, Sterner TR, Mattie DR, et al. 2003. Predicting fetal perchlorate dose and inhibition of iodide kinetics during gestation: a physiologically-based pharmacokinetic analysis of perchlorate and iodide kinetics in the rat. Toxicol Sci 73(2):235–255, PMID: 12700398, 10.1093/toxsci/kfg081. [DOI] [PubMed] [Google Scholar]
- Conrad KP. 1984. Renal hemodynamics during pregnancy in chronically catheterized, conscious rats. Kidney Int 26(1):24–29, PMID: 6332938, 10.1038/ki.1984.129. [DOI] [PubMed] [Google Scholar]
- Darrow LA, Stein CR, Steenland K. 2013. Serum perfluorooctanoic acid and perfluorooctane sulfonate concentrations in relation to birth outcomes in the Mid-Ohio Valley, 2005–2010. Environ Health Perspect 121(10):1207–1213, PMID: 23838280, 10.1289/ehp.1206372. [DOI] [PMC free article] [PubMed] [Google Scholar]
- Dewey KG, Heinig MJ, Nommsen LA, Lönnerdal B. 1991. Adequacy of energy intake among breast-fed infants in the DARLING study: relationships to growth velocity, morbidity, and activity levels. J Pediatr 119(4):538–547, PMID: 1919883, 10.1016/S0022-3476(05)82401-1. [DOI] [PubMed] [Google Scholar]
- Dong GH, Liu MM, Wang D, Zheng L, Liang ZF, Jin YH. 2011. Sub-chronic effect of perfluorooctanesulfonate (PFOS) on the balance of type 1 and type 2 cytokine in adult C57BL6 mice. Arch Toxicol 85(10):1235–1244, PMID: 21327619, 10.1007/s00204-011-0661-x. [DOI] [PubMed] [Google Scholar]
- Dong GH, Zhang YH, Zheng L, Liu W, Jin YH, He QC. 2009. Chronic effects of perfluorooctanesulfonate exposure on immunotoxicity in adult male C57BL/6 mice. Arch Toxicol 83(9):805–815, PMID: 19343326, 10.1007/s00204-009-0424-0. [DOI] [PubMed] [Google Scholar]
- Dong Z, Bahar MM, Jit J, Kennedy B, Priestly B, Ng J, et al. 2017. Issues raised by the reference doses for perfluorooctane sulfonate and perfluorooctanoic acid. Environ Int 105:86–94, PMID: 28521193, 10.1016/j.envint.2017.05.006. [DOI] [PubMed] [Google Scholar]
- Dong Z, Naidu R. 2019. Response to comment on: Dong et al. (2017) “issues raised by the reference doses for perfluorooctonate sulfonate and perfluorooctanoic acid.” Environ Int 126:802–803, PMID: 30718018, 10.1016/j.envint.2019.01.039. [DOI] [PubMed] [Google Scholar]
- Dowell RT, Kauer CD. 1997. Maternal hemodynamics and uteroplacental blood flow throughout gestation in conscious rats. Methods Find Exp Clin Pharmacol 19:613–625, PMID: 9500125. [PubMed] [Google Scholar]
- Dzierlenga MW, Crawford L, Longnecker MP. 2020. Birth weight and perfluorooctane sulfonic acid: a random-effects meta-regression analysis. Environ Epidemiol 4(3):e095, 10.1097/EE9.0000000000000095. [DOI] [PMC free article] [PubMed] [Google Scholar]
- EFSA CEF Panel (European Food Safety Authority Panel on Food Contact Materials, Enzymes, Flavourings and Processing Aids). 2015. Scientific opinion on the risks to public health related to the presence of bisphenol A (BPA) in foodstuffs. EFSA J 13(1):3978, 10.2903/j.efsa.2015.3978. [DOI] [Google Scholar]
- EFSA CONTAM Panel (EFSA Panel on Contaminants in the Food Chain). 2018. Risk to human health related to the presence of perfluorooctane sulfonic acid and perfluorooctanoic acid in food. EFSA J 16(12):e05194. [] [DOI] [PMC free article] [PubMed] [Google Scholar]
- EFSA CONTAM Panel. 2020. Risk to human health related to the presence of perfluoroalkyl substances in food. EFSA J 18 (9): e06223, PMID: 32994824, 10.2903/j.efsa.2020.6223. [DOI] [PMC free article] [PubMed] [Google Scholar]
- Elmokadem A, Riggs MM, Baron KT. 2019. Quantitative systems pharmacology and physiologically-based pharmacokinetic modeling with mrgsolve: a hands-on tutorial. CPT Pharmacometrics Syst Pharmacol 8(12):883–893, PMID: 31652028, 10.1002/psp4.12467. [DOI] [PMC free article] [PubMed] [Google Scholar]
- Fàbrega F, Kumar V, Schuhmacher M, Domingo JL, Nadal M. 2014. PBPK modeling for PFOS and PFOA: validation with human experimental data. Toxicol Lett 230(2):244–251, PMID: 24440341, 10.1016/j.toxlet.2014.01.007. [DOI] [PubMed] [Google Scholar]
- Fai Tse WK, Li JW, Kwan Tse AC, Chan TF, Hin Ho JC, Sun Wu RS, et al. 2016. Fatty liver disease induced by perfluorooctane sulfonate: novel insight from transcriptome analysis. Chemosphere 159:166–177, PMID: 27289203, 10.1016/j.chemosphere.2016.05.060. [DOI] [PubMed] [Google Scholar]
- FDA (U.S. Food and Drug Administration). 2017. Update on Perfluorinated Grease-proofing Agents. Updated 17 October 2017. Washington, DC: FDA. https://wayback.archive-it.org/7993/20171115164049/https://www.fda.gov/Food/IngredientsPackagingLabeling/PackagingFCS/Notifications/ucm308462.htm [accessed 6 June 2020]. [Google Scholar]
- Fei C, McLaughlin JK, Tarone RE, Olsen J. 2007. Perfluorinated chemicals and fetal growth: a study within the Danish National Birth Cohort. Environ Health Perspect 115(11):1677–1682, PMID: 18008003, 10.1289/ehp.10506. [DOI] [PMC free article] [PubMed] [Google Scholar]
- Feng X, Wang X, Cao X, Xia Y, Zhou R, Chen L. 2015. Chronic exposure of female mice to an environmental level of perfluorooctane sulfonate suppresses estrogen synthesis through reduced histone H3K14 acetylation of the StAR promoter leading to deficits in follicular development and ovulation. Toxicol Sci 148(2):368–379, PMID: 26358002, 10.1093/toxsci/kfv197. [DOI] [PubMed] [Google Scholar]
- Fromme H, Mosch C, Morovitz M, Alba-Alejandre I, Boehmer S, Kiranoglu M, et al. 2010. Pre- and postnatal exposure to perfluorinated compounds (PFCs). Environ Sci Technol 44(18):7123–7129, PMID: 20722423, 10.1021/es101184f. [DOI] [PubMed] [Google Scholar]
- Fromme H, Tittlemier SA, Völkel W, Wilhelm M, Twardella D. 2009. Perfluorinated compounds—exposure assessment for the general population in Western countries. Int J Hyg Environ Health 212(3):239–270, PMID: 18565792, 10.1016/j.ijheh.2008.04.007. [DOI] [PubMed] [Google Scholar]
- Gallo V, Leonardi G, Genser B, Lopez-Espinosa MJ, Frisbee SJ, Karlsson L, et al. 2012. Serum perfluorooctanoate (PFOA) and perfluorooctane sulfonate (PFOS) concentrations and liver function biomarkers in a population with elevated PFOA exposure. Environ Health Perspect 120(5):655–660, PMID: 22289616, 10.1289/ehp.1104436. [DOI] [PMC free article] [PubMed] [Google Scholar]
- Garcia JF. 1957. Changes in blood, plasma and red cell volume in the male rat, as a function of age. Am J Physiol 190(1):19–24, PMID: 13458401, 10.1152/ajplegacy.1957.190.1.19. [DOI] [PubMed] [Google Scholar]
- Gentry PR, Covington TR, Andersen ME, Clewell HJ III.. 2002. Application of a physiologically based pharmacokinetic model for isopropanol in the derivation of a reference dose and reference concentration. Regul Toxicol Pharmacol 36(1):51–68, PMID: 12383718, 10.1006/rtph.2002.1540. [DOI] [PubMed] [Google Scholar]
- Gentry PR, Covington TR, Clewell HJ III.. 2003. Evaluation of the potential impact of pharmacokinetic differences on tissue dosimetry in offspring during pregnancy and lactation. Regul Toxicol Pharmacol 38(1):1–16, PMID: 12878049, 10.1016/S0273-2300(03)00047-3. [DOI] [PubMed] [Google Scholar]
- Giesy JP, Kannan K. 2001. Global distribution of perfluorooctane sulfonate in wildlife. Environ Sci Technol 35(7):1339–1342, PMID: 11348064, 10.1021/es001834k. [DOI] [PubMed] [Google Scholar]
- Giesy JP, Kannan K. 2002. Perfluorochemical surfactants in the environment. Environ Sci Technol 36(7):146A–152A, PMID: 11999053, 10.1021/es022253t. [DOI] [PubMed] [Google Scholar]
- Glynn A, Berger U, Bignert A, Ullah S, Aune M, Lignell S, et al. 2012. Perfluorinated alkyl acids in blood serum from primiparous women in Sweden: serial sampling during pregnancy and nursing, and temporal trends 1996–2010. Environ Sci Technol 46:9071–9079, PMID: 22770559, 10.1021/es301168c. [DOI] [PubMed] [Google Scholar]
- Grandjean P, Andersen EW, Budtz-Jørgensen E, Nielsen F, Mølbak K, Weihe P, et al. 2012. Serum vaccine antibody concentrations in children exposed to perfluorinated compounds. JAMA 307(4):391–397, PMID: 22274686, 10.1001/jama.2011.2034. [DOI] [PMC free article] [PubMed] [Google Scholar]
- Gützkow KB, Haug LS, Thomsen C, Sabaredzovic A, Becher G, Brunborg G. 2012. Placental transfer of perfluorinated compounds is selective—a Norwegian Mother and Child sub-cohort study. Int J Hyg Environ Health 215(2):216–219, PMID: 21937271, 10.1016/j.ijheh.2011.08.011. [DOI] [PubMed] [Google Scholar]
- Gyllenhammar I, Benskin JP, Sandblom O, Berger U, Ahrens L, Lignell S, et al. 2018. Perfluoroalkyl acids (PFAAs) in serum from 2–4-month-old infants: influence of maternal serum concentration, gestational age, breast-feeding, and contaminated drinking water. Environ Sci Technol 52(12):7101–7110, PMID: 29758986, 10.1021/acs.est.8b00770. [DOI] [PubMed] [Google Scholar]
- Haddad S, Restieri C, Krishnan K. 2001. Characterization of age-related changes in body weight and organ weights from birth to adolescence in humans. J Toxicol Environ Health A 64(6):453–464, PMID: 11732696, 10.1080/152873901753215911. [DOI] [PubMed] [Google Scholar]
- Han R, Zhang F, Wan C, Liu L, Zhong Q, Ding W. 2018. Effect of perfluorooctane sulphonate-induced Kupffer cell activation on hepatocyte proliferation through the NF-κB/TNF-α/IL-6-dependent pathway. Chemosphere 200:283–294, PMID: 29494909, 10.1016/j.chemosphere.2018.02.137. [DOI] [PubMed] [Google Scholar]
- Han X, Nabb DL, Russell MH, Kennedy GL, Rickard RW. 2012. Renal elimination of perfluorocarboxylates (PFCAs). Chem Res Toxicol 25(1):35–46, PMID: 21985250, 10.1021/tx200363w. [DOI] [PubMed] [Google Scholar]
- Han X, Snow TA, Kemper RA, Jepson GW. 2003. Binding of perfluorooctanoic acid to rat and human plasma proteins. Chem Res Toxicol 16(6):775–781, PMID: 12807361, 10.1021/tx034005w. [DOI] [PubMed] [Google Scholar]
- Hanwell A, Linzell JL. 1973. The time course of cardiovascular changes in lactation in the rat. J Physiol 233(1):93–109, PMID: 4759126, 10.1113/jphysiol.1973.sp010299. [DOI] [PMC free article] [PubMed] [Google Scholar]
- Harada K, Inoue K, Morikawa A, Yoshinaga T, Saito N, Koizumi A. 2005. Renal clearance of perfluorooctane sulfonate and perfluorooctanoate in humans and their species-specific excretion. Environ Res 99(2):253–261, PMID: 16194675, 10.1016/j.envres.2004.12.003. [DOI] [PubMed] [Google Scholar]
- Harris LA, Barton HA. 2008. Comparing single and repeated dosimetry data for perfluorooctane sulfonate in rats. Toxicol Lett 181(3):148–156, PMID: 18706985, 10.1016/j.toxlet.2008.07.014. [DOI] [PubMed] [Google Scholar]
- Haug LS, Huber S, Becher G, Thomsen C. 2011. Characterisation of human exposure pathways to perfluorinated compounds—comparing exposure estimates with biomarkers of exposure. Environ Int 37(4):687–693, PMID: 21334069, 10.1016/j.envint.2011.01.011. [DOI] [PubMed] [Google Scholar]
- Hinderliter PM, Mylchreest E, Gannon SA, Butenhoff JL, Kennedy GL. 2005. Perfluorooctanoate: placental and lactational transport pharmacokinetics in rats. Toxicology 211(1–2):139–148, PMID: 15863257, 10.1016/j.tox.2005.03.010. [DOI] [PubMed] [Google Scholar]
- Hsu V, de L T Vieira M, Zhao P, Zhang L, Zheng JH, Nordmark A, et al. 2014. Towards quantitation of the effects of renal impairment and probenecid inhibition on kidney uptake and efflux transporters, using physiologically based pharmacokinetic modelling and simulations. Clin Pharmacokinet 53(3):283–293, PMID: 24214317, 10.1007/s40262-013-0117-y. [DOI] [PMC free article] [PubMed] [Google Scholar]
- Humblet O, Diaz-Ramirez LG, Balmes JR, Pinney SM, Hiatt RA. 2014. Perfluoroalkyl chemicals and asthma among children 12–19 years of age: NHANES (1999–2008). Environ Health Perspect 122(10):1129–1133, PMID: 24905661, 10.1289/ehp.1306606. [DOI] [PMC free article] [PubMed] [Google Scholar]
- Impinen A, Nygaard UC, Lødrup Carlsen KC, Mowinckel P, Carlsen KH, Haug LS, et al. 2018. Prenatal exposure to perfluoralkyl substances (PFASs) associated with respiratory tract infections but not allergy- and asthma-related health outcomes in childhood. Environ Res 160:518–523, PMID: 29106950, 10.1016/j.envres.2017.10.012. [DOI] [PubMed] [Google Scholar]
- Inoue K, Okada F, Ito R, Kato S, Sasaki S, Nakajima S, et al. 2004a. Perfluorooctane sulfonate (PFOS) and related perfluorinated compounds in human maternal and cord blood samples: assessment of PFOS exposure in a susceptible population during pregnancy. Environ Health Perspect 112(11):1204–1207, PMID: 15289168, 10.1289/ehp.6864. [DOI] [PMC free article] [PubMed] [Google Scholar]
- Inoue K, Okada F, Ito R, Kawaguchi M, Okanouchi N, Nakazawa H. 2004b. Determination of perfluorooctane sulfonate, perfluorooctanoate and perfluorooctane sulfonylamide in human plasma by column-switching liquid chromatography–electrospray mass spectrometry coupled with solid-phase extraction. J Chromatogr B Analyt Technol Biomed Life Sci 810(1):49–56, PMID: 15358307, 10.1016/j.jchromb.2004.07.014. [DOI] [PubMed] [Google Scholar]
- Kannan K, Corsolini S, Falandysz J, Fillmann G, Kumar KS, Loganathan BG, et al. 2004. Perfluorooctanesulfonate and related fluorochemicals in human blood from several countries. Environ Sci Technol 38(17):4489–4495, PMID: 15461154, 10.1021/es0493446. [DOI] [PubMed] [Google Scholar]
- Kapraun DF, Wambaugh JF, Setzer RW, Judson RS. 2019. Empirical models for anatomical and physiological changes in a human mother and fetus during pregnancy and gestation. PLoS One 14(5):e0215906, PMID: 31048866, 10.1371/journal.pone.0215906. [DOI] [PMC free article] [PubMed] [Google Scholar]
- Kärrman A, Ericson I, van Bavel B, Darnerud PO, Aune M, Glynn A, et al. 2007. Exposure of perfluorinated chemicals through lactation: levels of matched human milk and serum and a temporal trend, 1996–2004, in Sweden. Environ Health Perspect 115(2):226–230, PMID: 17384769, 10.1289/ehp.9491. [DOI] [PMC free article] [PubMed] [Google Scholar]
- Kato K, Wong LY, Chen A, Dunbar C, Webster GM, Lanphear BP, et al. 2014. Changes in serum concentrations of maternal poly- and perfluoroalkyl substances over the course of pregnancy and predictors of exposure in a multiethnic cohort of Cincinnati, Ohio pregnant women during 2003–2006. Environ Sci Technol 48(16):9600–9608, PMID: 25026485, 10.1021/es501811k. [DOI] [PMC free article] [PubMed] [Google Scholar]
- Kieskamp KK, Worley RR, McLanahan ED, Verner MA. 2018. Incorporation of fetal and child PFOA dosimetry in the derivation of health-based toxicity values. Environ Int 111:260–267, PMID: 29325971, 10.1016/j.envint.2017.12.019. [DOI] [PMC free article] [PubMed] [Google Scholar]
- Kim SK, Lee KT, Kang CS, Tao L, Kannan K, Kim KR, et al. 2011. Distribution of perfluorochemicals between sera and milk from the same mothers and implications for prenatal and postnatal exposures. Environ Pollut 159(1):169–174, PMID: 20932617, 10.1016/j.envpol.2010.09.008. [DOI] [PubMed] [Google Scholar]
- Kummu M, Sieppi E, Koponen J, Laatio L, Vähäkangas K, Kiviranta H, et al. 2015. Organic anion transporter 4 (OAT 4) modifies placental transfer of perfluorinated alkyl acids PFOS and PFOA in human placental ex vivo perfusion system. Placenta 36(10):1185–1191, PMID: 26303760, 10.1016/j.placenta.2015.07.119. [DOI] [PubMed] [Google Scholar]
- Lau C, Anitole K, Hodes C, Lai D, Pfahles-Hutchens A, Seed J. 2007. Perfluoroalkyl acids: a review of monitoring and toxicological findings. Toxicol Sci 99(2):366–394, PMID: 17519394, 10.1093/toxsci/kfm128. [DOI] [PubMed] [Google Scholar]
- Lau C, Thibodeaux JR, Hanson RG, Rogers JM, Grey BE, Stanton ME, et al. 2003. Exposure to perfluorooctane sulfonate during pregnancy in rat and mouse. II: postnatal evaluation. Toxicol Sci 74(2):382–392, PMID: 12773772, 10.1093/toxsci/kfg122. [DOI] [PubMed] [Google Scholar]
- Lee S, Kim S, Park J, Kim HJ, Choi G, Choi S, et al. 2018. Perfluoroalkyl substances (PFASs) in breast milk from Korea: time-course trends, influencing factors, and infant exposure. Sci Total Environ 612:286–292, PMID: 28865262, 10.1016/j.scitotenv.2017.08.094. [DOI] [PubMed] [Google Scholar]
- Lee YJ, Kim MK, Bae J, Yang JH. 2013. Concentrations of perfluoroalkyl compounds in maternal and umbilical cord sera and birth outcomes in Korea. Chemosphere 90(5):1603–1609, PMID: 22990023, 10.1016/j.chemosphere.2012.08.035. [DOI] [PubMed] [Google Scholar]
- Li M, Gehring R, Riviere JE, Lin Z. 2017. Development and application of a population physiologically based pharmacokinetic model for penicillin G in swine and cattle for food safety assessment. Food Chem Toxicol 107(pt A):74–87, PMID: 28627373, 10.1016/j.fct.2017.06.023. [DOI] [PubMed] [Google Scholar]
- Li M, Gehring R, Riviere JE, Lin Z. 2018. Probabilistic physiologically based pharmacokinetic model for penicillin G in milk from dairy cows following intramammary or intramuscular administrations. Toxicol Sci 164(1):85–100, PMID: 29945226, 10.1093/toxsci/kfy067. [DOI] [PubMed] [Google Scholar]
- Lin PID, Cardenas A, Hauser R, Gold DR, Kleinman KP, Hivert MF, et al. 2019. Per- and polyfluoroalkyl substances and blood lipid levels in pre-diabetic adults—longitudinal analysis of the diabetes prevention program outcomes study. Environ Int 129:343–353, PMID: 31150976, 10.1016/j.envint.2019.05.027. [DOI] [PMC free article] [PubMed] [Google Scholar]
- Lin Z, Fisher JW, Ross MK, Filipov NM. 2011. A physiologically based pharmacokinetic model for atrazine and its main metabolites in the adult male C57BL/6 mouse. Toxicol Appl Pharmacol 251(1):16–31, PMID: 21094656, 10.1016/j.taap.2010.11.009. [DOI] [PubMed] [Google Scholar]
- Lin Z, Fisher JW, Wang R, Ross MK, Filipov NM. 2013. Estimation of placental and lactational transfer and tissue distribution of atrazine and its main metabolites in rodent dams, fetuses, and neonates with physiologically based pharmacokinetic modeling. Toxicol Appl Pharmacol 273(1):140–158, PMID: 23958493, 10.1016/j.taap.2013.08.010. [DOI] [PubMed] [Google Scholar]
- Lin Z, Monteiro-Riviere NA, Kannan R, Riviere JE. 2016. A computational framework for interspecies pharmacokinetics, exposure and toxicity assessment of gold nanoparticles. Nanomedicine (Lond) 11(2):107–119, PMID: 26653715, 10.2217/nnm.15.177. [DOI] [PubMed] [Google Scholar]
- Liu J, Li J, Liu Y, Chan HM, Zhao Y, Cai Z, et al. 2011. Comparison on gestation and lactation exposure of perfluorinated compounds for newborns. Environ Int 37(7):1206–1212, PMID: 21620474, 10.1016/j.envint.2011.05.001. [DOI] [PubMed] [Google Scholar]
- Llorca M, Farré M, Picó Y, Teijón ML, Álvarez JG, Barceló D. 2010. Infant exposure of perfluorinated compounds: levels in breast milk and commercial baby food. Environ Int 36(6):584–592, PMID: 20494442, 10.1016/j.envint.2010.04.016. [DOI] [PubMed] [Google Scholar]
- Loccisano AE, Campbell JL Jr, Butenhoff JL, Andersen ME, Clewell HJ III.. 2012a. Comparison and evaluation of pharmacokinetics of PFOA and PFOS in the adult rat using a physiologically based pharmacokinetic model. Reprod Toxicol 33(4):452–467, PMID: 21565266, 10.1016/j.reprotox.2011.04.006. [DOI] [PubMed] [Google Scholar]
- Loccisano AE, Campbell JL, Andersen ME, Clewell HJ. 2011. Evaluation and prediction of pharmacokinetics in the monkey and human using a pbpk model. Reg Toxicol Pharmacol 59:157–175, PMID: 21168463, 10.1016/j.yrtph.2010.12.004. [DOI] [PubMed] [Google Scholar]
- Loccisano AE, Campbell JL Jr, Butenhoff JL, Andersen ME, Clewell HJ III.. 2012b. Evaluation of placental and lactational pharmacokinetics of PFOA and PFOS in the pregnant, lactating, fetal and neonatal rat using a physiologically based pharmacokinetic model. Reprod Toxicol 33(4):468–490, PMID: 21872655, 10.1016/j.reprotox.2011.07.003. [DOI] [PubMed] [Google Scholar]
- Loccisano AE, Longnecker MP, Campbell JL Jr, Andersen ME, Clewell HJ III.. 2013. Development of PBPK models for PFOA and PFOS for human pregnancy and lactation life stages. J Toxicol Environ Health A 76(1):25–57, PMID: 23151209, 10.1080/15287394.2012.722523. [DOI] [PMC free article] [PubMed] [Google Scholar]
- Lorber M, Eaglesham GE, Hobson P, Toms LML, Mueller JF, Thompson JS. 2015. The effect of ongoing blood loss on human serum concentrations of perfluorinated acids. Chemosphere 118:170–177, PMID: 25180653, 10.1016/j.chemosphere.2014.07.093. [DOI] [PubMed] [Google Scholar]
- Luebker DJ, Case MT, York RG, Moore JA, Hansen KJ, Butenhoff JL. 2005a. Two-generation reproduction and cross-foster studies of perfluorooctanesulfonate (PFOS) in rats. Toxicology 215(1–2):126–148, PMID: 16146667, 10.1016/j.tox.2005.07.018. [DOI] [PubMed] [Google Scholar]
- Luebker DJ, Hansen KJ, Bass NM, Butenhoff JL, Seacat AM. 2002. Interactions of flurochemicals with rat liver fatty acid-binding protein. Toxicology 176(3):175–185, PMID: 12093614, 10.1016/S0300-483X(02)00081-1. [DOI] [PubMed] [Google Scholar]
- Luebker DJ, York RG, Hansen KJ, Moore JA, Butenhoff JL. 2005b. Neonatal mortality from in utero exposure to perfluorooctanesulfonate (PFOS) in Sprague-Dawley rats: dose–response, and biochemical and pharmacokinetic parameters. Toxicology 215(1–2):149–169, PMID: 16129535, 10.1016/j.tox.2005.07.019. [DOI] [PubMed] [Google Scholar]
- Mamsen LS, Björvang RD, Mucs D, Vinnars MT, Papadogiannakis N, Lindh CH, et al. 2019. Concentrations of perfluoroalkyl substances (PFASs) in human embryonic and fetal organs from first, second, and third trimester pregnancies. Environ Int 124:482–492, PMID: 30684806, 10.1016/j.envint.2019.01.010. [DOI] [PubMed] [Google Scholar]
- Mamsen LS, Jönsson BAG, Lindh CH, Olesen RH, Larsen A, Ernst E, et al. 2017. Concentration of perfluorinated compounds and cotinine in human foetal organs, placenta, and maternal plasma. Sci Total Environ 596–597:97–105, PMID: 28426990, 10.1016/j.scitotenv.2017.04.058. [DOI] [PubMed] [Google Scholar]
- Midasch O, Drexler H, Hart N, Beckmann MW, Angerer J. 2007. Transplacental exposure of neonates to perfluorooctanesulfonate and perfluorooctanoate: a pilot study. Int Arch Occup Environ Health 80(7):643–648, PMID: 17219182, 10.1007/s00420-006-0165-9. [DOI] [PubMed] [Google Scholar]
- Mirfazaelian A, Fisher JW. 2007. Organ growth functions in maturing male Sprague-Dawley rats based on a collective database. J Toxicol Environ Health A 70(12):1052–1063, PMID: 17497417, 10.1080/15287390601172106. [DOI] [PubMed] [Google Scholar]
- Mondal D, Weldon RH, Armstrong BG, Gibson LJ, Lopez-Espinosa MJ, Shin HM, et al. 2014. Breastfeeding: a potential excretion route for mothers and implications for infant exposure to perfluoroalkyl acids. Environ Health Perspect 122(2):187–192, PMID: 24280536, 10.1289/ehp.1306613. [DOI] [PMC free article] [PubMed] [Google Scholar]
- Monroy R, Morrison K, Teo K, Atkinson S, Kubwabo C, Stewart B, et al. 2008. Serum levels of perfluoroalkyl compounds in human maternal and umbilical cord blood samples. Environ Res 108(1):56–62, PMID: 18649879, 10.1016/j.envres.2008.06.001. [DOI] [PubMed] [Google Scholar]
- Naismith DJ, Richardson DP, Pritchard AE. 1982. The utilization of protein and energy during lactation in the rat, with particular regard to the use of fat accumulated in pregnancy. Br J Nutr 48(2):433–441, PMID: 7115665, 10.1079/bjn19820125. [DOI] [PubMed] [Google Scholar]
- Ngueta G, Longnecker MP, Yoon M, Ruark CD, Clewell HJ III, Andersen ME, et al. 2017. Quantitative bias analysis of a reported association between perfluoroalkyl substances (PFAS) and endometriosis: the influence of oral contraceptive use. Environ Int 104:118–121, PMID: 28392065, 10.1016/j.envint.2017.03.023. [DOI] [PubMed] [Google Scholar]
- Nakagawa H, Hirata T, Terada T, Jutabha P, Miura D, Harada KH, et al. 2008. Roles of organic anion transporters in the renal excretion of perfluorooctanoic acid. Basic Clin Pharmacol Toxicol 103:1–8, PMID: 18373647, 10.1111/j.1742-7843.2007.00155.x. [DOI] [PubMed] [Google Scholar]
- Nielsen C, Andersson Hall U, Lindh C, Ekström U, Xu Y, Li Y, et al. 2020. Pregnancy-induced changes in serum concentrations of perfluoroalkyl substances and the influence of kidney function. Environ Health 19(1):80, PMID: 32641055, 10.1186/s12940-020-00626-6. [DOI] [PMC free article] [PubMed] [Google Scholar]
- O’Flaherty EJ, Scott W, Schreiner C, Beliles RP. 1992. A physiologically based kinetic model of rat and mouse gestation: disposition of a weak acid. Toxicol Appl Pharmacol 112(2):245–256, PMID: 1539162, 10.1016/0041-008X(92)90194-W. [DOI] [PubMed] [Google Scholar]
- Olsen GW, Burris JM, Ehresman DJ, Froehlich JW, Seacat AM, Butenhoff JL, et al. 2007. Half-life of serum elimination of perfluorooctanesulfonate, perfluorohexanesulfonate, and perfluorooctanoate in retired fluorochemical production workers. Environ Health Perspect 115(9):1298–1305, PMID: 17805419, 10.1289/ehp.10009. [DOI] [PMC free article] [PubMed] [Google Scholar]
- Pan Y, Zhu Y, Zheng T, Cui Q, Buka SL, Zhang B, et al. 2017. Novel chlorinated polyfluorinated ether sulfonates and legacy per-/polyfluoroalkyl substances: placental transfer and relationship with serum albumin and glomerular filtration rate. Environ Sci Technol 51(1):634–644, PMID: 27931097, 10.1021/acs.est.6b04590. [DOI] [PubMed] [Google Scholar]
- Peden-Adams MM, Keller JM, Eudaly JG, Berger J, Gilkeson GS, Keil DE. 2008. Suppression of humoral immunity in mice following exposure to perfluorooctane sulfonate. Toxicol Sci 104(1):144–154, PMID: 18359764, 10.1093/toxsci/kfn059. [DOI] [PubMed] [Google Scholar]
- Rappazzo KM, Coffman E, Hines EP. 2017. Exposure to perfluorinated alkyl substances and health outcomes in children: a systematic review of the epidemiologic literature. Int J Environ Res Public Health 14(7):691, PMID: 28654008, 10.3390/ijerph14070691. [DOI] [PMC free article] [PubMed] [Google Scholar]
- Rodriguez CE, Mahle DA, Gearhart JM, Mattie DR, Lipscomb JC, Cook RS, et al. 2007. Predicting age-appropriate pharmacokinetics of six volatile organic compounds in the rat utilizing physiologically based pharmacokinetic modeling. Toxicol Sci 98(1):43–56, PMID: 17426107, 10.1093/toxsci/kfm082. [DOI] [PubMed] [Google Scholar]
- Rosso P. 1975. Changes in the transfer of nutrients across the placenta during normal gestation in the rat. Am J Obstet Gynecol 122(6):761–766, PMID: 1171623, 10.1016/0002-9378(75)90584-0. [DOI] [PubMed] [Google Scholar]
- Rosso P, Keyou G, Bassi JA, Slusser WM. 1981. Effect of malnutrition during pregnancy on the development of the mammary glands of rats. J Nutr 111(11):1937–1941, PMID: 6170742, 10.1093/jn/111.11.1937. [DOI] [PubMed] [Google Scholar]
- Rovira J, Martínez MÁ, Sharma RP, Espuis T, Nadal M, Kumar V, et al. 2019. Prenatal exposure to PFOS and PFOA in a pregnant women cohort of Catalonia, Spain. Environ Res 175:384–392, PMID: 31154228, 10.1016/j.envres.2019.05.040. [DOI] [PubMed] [Google Scholar]
- Ruark CD, Song G, Yoon M, Verner MA, Andersen ME, Clewell HJ III, et al. 2017. Quantitative bias analysis for epidemiological associations of perfluoroalkyl substance serum concentrations and early onset of menopause. Environ Int 99:245–254, PMID: 27927583, 10.1016/j.envint.2016.11.030. [DOI] [PubMed] [Google Scholar]
- Salas SP, Marshall G, Gutiérrez BL, Rosso P. 2006. Time course of maternal plasma volume and hormonal changes in women with preeclampsia or fetal growth restriction. Hypertension 47(2):203–208, PMID: 16380519, 10.1161/01.HYP.0000200042.64517.19. [DOI] [PubMed] [Google Scholar]
- Schneidereit M. 1985. Study of fetal organ growth in Wistar rats from day 17 to 21. Lab Anim 19(3):240–244, PMID: 4040991, 10.1258/002367785780893674. [DOI] [PubMed] [Google Scholar]
- Shankaran H, Adeshina F, Teeguarden JG. 2013. Physiologically-based pharmacokinetic model for Fentanyl in support of the development of Provisional Advisory Levels. Toxicol Appl Pharmacol 273(3):464–476, PMID: 23732079, 10.1016/j.taap.2013.05.024. [DOI] [PubMed] [Google Scholar]
- Shirley B. 1984. The food intake of rats during pregnancy and lactation. Lab Anim Sci 34(2):169–172, PMID: 6727289. [PubMed] [Google Scholar]
- Sikov MR, Thomas JM. 1970. Prenatal growth of the rat. Growth 34(1):1–14, PMID: 5430068. [PubMed] [Google Scholar]
- Sims EA, Krantz KE. 1958. Serial studies of renal function during pregnancy and the puerperium in normal women. J Clin Invest 37(12):1764–1774, PMID: 13611044, 10.1172/JCI103769. [DOI] [PMC free article] [PubMed] [Google Scholar]
- Skogheim TS, Villanger GD, Weyde KVF, Engel SM, Surén P, Øie MG, et al. 2020. Prenatal exposure to perfluoroalkyl substances and associations with symptoms of attention-deficit/hyperactivity disorder and cognitive functions in preschool children. Int J Hyg Environ Health 223(1):80–92, PMID: 31653559, 10.1016/j.ijheh.2019.10.003. [DOI] [PMC free article] [PubMed] [Google Scholar]
- Soetaert K, Petzoldt T. 2010. Inverse modelling, sensitivity and Monte Carlo analysis in R using package FME. J Stat Softw 33(3):1–28, 10.18637/jss.v033.i03.20808728 [DOI] [Google Scholar]
- Sterner TR, Ruark CD, Covington TR, Yu KO, Gearhart JM. 2013. A physiologically based pharmacokinetic model for the oxime TMB-4: simulation of rodent and human data. Arch Toxicol 87(4):661–680, PMID: 23314320, 10.1007/s00204-012-0987-z. [DOI] [PubMed] [Google Scholar]
- Štulcová B. 1977. Postnatal development of cardiac output distribution measured by radioactive microspheres in rats. Biol Neonate 32(3–4):119–124, PMID: 603796, 10.1159/000241004. [DOI] [PubMed] [Google Scholar]
- Sunderland EM, Hu XC, Dassuncao C, Tokranov AK, Wagner CC, Allen JG. 2019. A review of the pathways of human exposure to poly- and perfluoroalkyl substances (PFASs) and present understanding of health effects. J Expo Sci Environ Epidemiol 29(2):131–147, PMID: 30470793, 10.1038/s41370-018-0094-1. [DOI] [PMC free article] [PubMed] [Google Scholar]
- Takacs ML, Abbott BD. 2007. Activation of mouse and human peroxisome proliferator–activated receptors (α, β/δ, γ) by perfluorooctanoic acid and perfluorooctane sulfonate. Toxicol Sci 95(1):108–117, PMID: 17047030, 10.1093/toxsci/kfl135. [DOI] [PubMed] [Google Scholar]
- Tan YM, Clewell HJ III, Andersen ME. 2008. Time dependencies in perfluorooctylacids disposition in rat and monkeys: a kinetic analysis. Toxicol Lett 177(1):38–47, PMID: 18242015, 10.1016/j.toxlet.2007.12.007. [DOI] [PubMed] [Google Scholar]
- Thibodeaux JR, Hanson RG, Rogers JM, Grey BE, Barbee BD, Richards JH, et al. 2003. Exposure to perfluorooctane sulfonate during pregnancy in rat and mouse. I: maternal and prenatal evaluations. Toxicol Sci 74(2):369–381, PMID: 12773773, 10.1093/toxsci/kfg121. [DOI] [PubMed] [Google Scholar]
- Thompson J, Lorber M, Toms LML, Kato K, Calafat AM, Mueller JF. 2010. Use of simple pharmacokinetic modeling to characterize exposure of Australians to perfluorooctanoic acid and perfluorooctane sulfonic acid. Environ Int 36(4):390–397, PMID: 20236705, 10.1016/j.envint.2010.02.008. [DOI] [PubMed] [Google Scholar]
- Thomsen C, Haug LS, Stigum H, Frøshaug M, Broadwell SL, Becher G. 2010. Changes in concentrations of perfluorinated compounds, polybrominated diphenyl ethers, and polychlorinated biphenyls in Norwegian breast-milk during twelve months of lactation. Environ Sci Technol 44(24):9550–9556, PMID: 21090747, 10.1021/es1021922. [DOI] [PubMed] [Google Scholar]
- U.S. EPA (U.S. Environmental Protection Agency). 2009. Long-Chain Perfluorinated Chemicals (PFCs) Action Plan. Washington, DC: U.S. EPA. https://www.epa.gov/sites/production/files/2016-01/documents/pfcs_action_plan1230_09.pdf [accessed 6 June 2020]. [Google Scholar]
- U.S. EPA. 2016. Health Effects Support Document for Perfluorooctane Sulfonate (PFOS). EPA 822-R-16-002. Washington, DC: U.S. EPA. https://www.epa.gov/sites/production/files/2016-05/documents/pfos_hesd_final_508.pdf [accessed 6 June 2020]. [Google Scholar]
- Uhl SA, James-Todd T, Bell ML. 2013. Association of osteoarthritis with perfluorooctanoate and perfluorooctane sulfonate in NHANES 2003–2008. Environ Health Perspect 121(4):447–452, PMID: 23410534, 10.1289/ehp.1205673. [DOI] [PMC free article] [PubMed] [Google Scholar]
- Verner MA, Loccisano AE, Morken NH, Yoon M, Wu H, McDougall R, et al. 2015. Associations of perfluoroalkyl substances (PFAS) with lower birth weight: an evaluation of potential confounding by glomerular filtration rate using a physiologically based pharmacokinetic model (PBPK). Environ Health Perspect 123(12):1317–1324, PMID: 26008903, 10.1289/ehp.1408837. [DOI] [PMC free article] [PubMed] [Google Scholar]
- von Ehrenstein OS, Fenton SE, Kato K, Kuklenyik Z, Calafat AM, Hines EP. 2009. Polyfluoroalkyl chemicals in the serum and milk of breastfeeding women. Reprod Toxicol 27(3–4):239–245, PMID: 19429402, 10.1016/j.reprotox.2009.03.001. [DOI] [PubMed] [Google Scholar]
- Wambaugh JF. 2018. Comment on: Dong et al. (2017) “issues raised by the reference doses for perfluorooctonate sulfonate and perfluorooctanoic acid.” Environ Int 121(pt 2):1372–1374, PMID: 30420130, 10.1016/j.envint.2018.10.048. [DOI] [PubMed] [Google Scholar]
- Wambaugh JF, Setzer RW, Pitruzzello AM, Liu J, Reif DM, Kleinstreuer NC, et al. 2013. Dosimetric anchoring of in vivo and in vitro studies for perfluorooctanoate and perfluorooctanesulfonate. Toxicol Sci, PMID: 24046276, 10.1093/toxsci/kft204. [DOI] [PubMed] [Google Scholar]
- Wan C, Han R, Liu L, Zhang F, Li F, Xiang M, et al. 2016. Role of miR-155 in fluorooctane sulfonate-induced oxidative hepatic damage via the Nrf2-dependent pathway. Toxicol Appl Pharmacol 295:85–93, PMID: 26844784, 10.1016/j.taap.2016.01.023. [DOI] [PubMed] [Google Scholar]
- Weaver YM, Ehresman DJ, Butenhoff JL, Hagenbuch B. 2010. Roles of rat renal organic anion transporters in transporting perfluorinated carboxylates with different chain lengths. Toxicol Sci 113(2):305–314, PMID: 19915082, 10.1093/toxsci/kfp275. [DOI] [PMC free article] [PubMed] [Google Scholar]
- WHO (World Health Organization). 2010. Characterization and Application of Physiologically Based Pharmacokinetic Models in Risk Assessment. https://www.who.int/ipcs/methods/harmonization/areas/pbpk_models.pdf?ua=1 [assessed 6 June 2020].
- Wong F, MacLeod M, Mueller JF, Cousins IT. 2014. Enhanced elimination of perfluorooctane sulfonic acid by menstruating women: evidence from population-based pharmacokinetic modeling. Environ Sci Technol 48(15):8807–8814, PMID: 24943117, 10.1021/es500796y. [DOI] [PubMed] [Google Scholar]
- Worley RR, Fisher J. 2015. Application of physiologically-based pharmacokinetic modeling to explore the role of kidney transporters in renal reabsorption of perfluorooctanoic acid in the rat. Toxicol Appl Pharmacol 289(3):428–441, PMID: 26522833, 10.1016/j.taap.2015.10.017. [DOI] [PMC free article] [PubMed] [Google Scholar]
- Worley RR, Yang X, Fisher J. 2017. Physiologically based pharmacokinetic modeling of human exposure to perfluorooctanoic acid suggests historical non drinking-water exposures are important for predicting current serum concentrations. Toxicol Appl Pharmacol 330:9–21, PMID: 28684146, 10.1016/j.taap.2017.07.001. [DOI] [PMC free article] [PubMed] [Google Scholar]
- Wosje KS, Kalkwarf HJ. 2004. Lactation, weaning, and calcium supplementation: effects on body composition in postpartum women. Am J Clin Nutr 80(2):423–429, PMID: 15277165, 10.1093/ajcn/80.2.423. [DOI] [PubMed] [Google Scholar]
- Wu H, Yoon M, Verner MA, Xue J, Luo M, Andersen ME, et al. 2015. Can the observed association between serum perfluoroalkyl substances and delayed menarche be explained on the basis of puberty-related changes in physiology and pharmacokinetics? Environ Int 82:61–68, PMID: 26043300, 10.1016/j.envint.2015.05.006. [DOI] [PubMed] [Google Scholar]
- Wykoff MH. 1971. Weight changes of the developing rat conceptus. Am J Vet Res 32(10):1633–1635, PMID: 5165561. [PubMed] [Google Scholar]
- Yang CH, Glover KP, Han X. 2010. Characterization of cellular uptake of perfluorooctanoate via organic anion-transporting polypeptide 1A2, organic anion transporter 4, and urate transporter 1 for their potential roles in mediating human renal reabsorption of perfluorocarboxylates. Toxicol Sci 117(2):294–302, PMID: 20639259, 10.1093/toxsci/kfq219. [DOI] [PubMed] [Google Scholar]
- Yang L, Li J, Lai J, Luan H, Cai Z, Wang Y, et al. 2016. Placental transfer of perfluoroalkyl substances and associations with thyroid hormones: Beijing prenatal exposure study. Sci Rep 6(1):21699, PMID: 26898235, 10.1038/srep21699. [DOI] [PMC free article] [PubMed] [Google Scholar]
- Yang X, Wu H, Mehta D, Sullivan MC, Wang J, Burckart GJ, et al. 2019. Ontogeny equations with probability distributions for anthropomorphic measurements in preterm and term neonates and infants for use in a PBPK model. Comput Toxicol 11:101–117, 10.1016/j.comtox.2019.03.007. [DOI] [Google Scholar]
- Yoon M, Nong A, Clewell HJ III, Taylor MD, Dorman DC, Andersen ME. 2009. Evaluating placental transfer and tissue concentrations of manganese in the pregnant rat and fetuses after inhalation exposures with a PBPK model. Toxicol Sci 112(1):44–58, PMID: 19726578, 10.1093/toxsci/kfp198. [DOI] [PubMed] [Google Scholar]
- Yoon M, Schroeter JD, Nong A, Taylor MD, Dorman DC, Andersen ME, et al. 2011. Physiologically based pharmacokinetic modeling of fetal and neonatal manganese exposure in humans: describing manganese homeostasis during development. Toxicol Sci 122(2):297–316, PMID: 21622944, 10.1093/toxsci/kfr141. [DOI] [PubMed] [Google Scholar]
- Zhang L, Ren XM, Guo LH. 2013a. Structure-based investigation on the interaction of perfluorinated compounds with human liver fatty acid binding protein. Environ Sci Technol 47(19):11293–11301, PMID: 24006842, 10.1021/es4026722. [DOI] [PubMed] [Google Scholar]
- Zhang T, Sun H, Lin Y, Qin X, Zhang Y, Geng X, et al. 2013b. Distribution of poly- and perfluoroalkyl substances in matched samples from pregnant women and carbon chain length related maternal transfer. Environ Sci Technol 47(14):7974–7981, PMID: 23777259, 10.1021/es400937y. [DOI] [PubMed] [Google Scholar]
- Zhao W, Zitzow JD, Weaver Y, Ehresman DJ, Chang SC, Butenhoff JL, et al. 2017. Organic anion transporting polypeptides contribute to the disposition of perfluoroalkyl acids in humans and rats. Toxicol Sci 156(1):84–95, PMID: 28013215, 10.1093/toxsci/kfw236. [DOI] [PMC free article] [PubMed] [Google Scholar]
Associated Data
This section collects any data citations, data availability statements, or supplementary materials included in this article.