

Abstract
Lung cancer is the leading cause of cancer death globally. An improved risk stratification strategy can increase efficiency of low-dose computed tomography (LDCT) screening. Here we assessed whether individual’s genetic background has clinical utility for risk stratification in the context of LDCT screening. Based on 13,119 lung cancer patients and 10,008 controls with European ancestry in the International Lung Cancer Consortium, we constructed a polygenic risk score (PRS) via 10-fold cross-validation with regularized penalized regression. The performance of risk model integrating PRS, including calibration and ability to discriminate, was assessed using UK biobank data (N=335,931). Absolute risk was estimated based on age-specific lung cancer incidence and all-cause mortality as competing risk. To evaluate its potential clinical utility, the PRS distribution was simulated in the National Lung Screening Trial (N=50,772 participants). The lung cancer odds ratio (ORs) for individuals at the top decile of the PRS distribution versus those at bottom 10% was 2.39 (95%CI=1.92–3.00, P=1.80×10⁻¹⁴) in the validation set (trend p-value of 5.26 × 10⁻²⁰). The OR per standard deviation of PRS increase was 1.26 (95%CI=1.20–1.32, P=9.69×10⁻²³) for overall lung cancer risk in the validation set. When considering absolute risks, individuals at different PRS deciles showed differential trajectories of 5-year and cumulative absolute risk. The age reaching the LDCT screening recommendation threshold can vary by 4 to 8 years, depending on the individual’s genetic background, smoking status and family history. Collectively, these results suggest that individual’s genetic background may inform the optimal lung cancer LDCT screening strategy.
Keywords: Lung Cancer, Risk Prediction, Absolute Risk, Polygenic Risk Score, Screening
INTRODUCTION
Lung cancer continues to be the leading cause of cancer death globally and the reduction of lung cancer deaths remains to be a public health priority[1]. Since the landmark paper by the National Lung Screening Trial (NLST)[2], which demonstrated a 20% of mortality reduction by low-dose computed tomography (LDCT) screening, how to effectively conduct LDCT screening in high-risk populations have been a topic of debate. More recently, the long-awaited Dutch-Belgian Lung Cancer Screening (NELSON) trial has also demonstrated a substantial mortality reduction up to 25–50%, depending on gender and the length of the follow-up time[3], which solidified the effectiveness of LDCT screening for lung cancer mortality reduction.
With the increasing uptake of LDCT, it is important to identify the high-risk population and determine the best timing to start LDCT screening. Most of current LDCT guidelines were derived from the NLST eligibility criteria, simply based on age (55 to 74 or 80 years old) and tobacco smoking history (at least 30 packyears, or quit smoking within 15 years), including the United States Preventive Services Task Force (USPSTF) guideline [4]. It has been suggested that individual risk assessment based on risk prediction models is more effective for selecting high-risk individuals for LDCT screening[5]. However, none of the previous risk models has taken individual’s genetic profiles into account at the genome-wide level.
Genome-wide association studies (GWAS) uncovered multiple lung cancer susceptibility genes, and consortium efforts greatly increased our ability to investigate the genetic architecture of histological subtypes[6,7]. However the clinical utility of these genomic discoveries remains unclear. It is evident that the individual susceptibility genes do not adequately represent individuals’ background genetic risk. Whereas, polygenic risk scores (PRS) are considered an effective approach of quantifying individual’s inherent risk, and have been applied to other common complex diseases such as cardiovascular diseases and breast and prostate cancer with some success [8–13]. However, no studies have comprehensively investigated risk prediction for lung cancer incorporating polygenic risk scores, beyond a handful of known susceptibility genes[14,15].
To comprehensively evaluate the predictive performance of polygenic risk model in lung cancer beyond known loci identified by previous GWAS, we constructed the polygenic risk score (PRS) based on the OncoArray data of 23,127 individuals using a machine learning approach, and independently validated the PRS based on UK Biobank data with 335,931 individuals. We assess the performance of the risk model integrating PRS in UK Biobank, including model calibration and ability to discriminate. Finally to evaluate the potential clinical utility of the polygenic risk model in the screening-eligible populations, we simulated the PRS distribution in the National Lung Screening Trial with 50,772 participants. Our objective is to assess whether and how an individual’s inherited susceptibility to lung cancer would affect the optimal implementation of the LDCT in the high-risk population.
MATERIALS AND METHODS
Lung cancer OncoArray project of the International Lung Cancer Consortium (ILCCO) has been previously published[6]. A total of 18,316 histologically confirmed lung cancer cases and 14,025 controls from 26 studies were used for PRS construction[16,17]. A total of 13,119 cases and 10,008 controls had epidemiological data was used for the downstream analysis combining genetic and epidemiological data (Supplementary Figure 1a). UK Biobank is a population-based cohort study of over 500,000 participants aged 40–69 at entry, recruited throughout the United Kingdom between 2006 to 2010 [18,19]. For risk prediction modeling, 1,768 incident lung cancer cases, defined as those who were diagnosed after baseline enrollment, and 334,163 unrelated controls were included (Supplementary Figure 1b). Additional details of ILCCO OncoArray Project and UK Biobank are included in the Supplementary Materials. The protocol of the pooled analysis was approved by the Research Ethics Review Board at the Sinai Health System. The recruitment and data collection of all participating research institutes was approved by the local ethics review committees.
Statistical Analysis
Construction of Polygenic Risk Score (PRS)
PRS is constructed as the sum of the number of minor alleles one carries, weighted by effect coefficients as the per allele log-odds ratio, including two components: (i) the known susceptibility loci of lung cancer and conditions related to lung cancer (such as lung function impairment) previously identified through literature curation and NHGRI-EBI GWAS Catalog[6,7,14,20–23], and (ii) additional loci that passed the suggestive significance-level (p<5×10⁻⁶), and were identified in this analysis through penalized regression using lasso after 10-fold cross validations. When correlation exists, variants representing independent loci with the strongest statistical significance were retained. The final component of known lung cancer-related loci included 35 variants (PRS-35), and the best performing lasso model selected 93 variants after accounting for linkage disequilibrium (PRS-93). The final PRS (PRS-128) was constructed by combining both components (Supplementary Table 1). The detailed process of PRS construction is included in the Supplementary Materials.
Odds ratio (OR) and 95% confidence interval (CI) were used to evaluate the association between PRS and lung cancer risk based on logistic regressions, adjusting for age, sex and top five principal components. We compared effect sizes of PRS for lung cancer risk based on PRS deciles by histological type, smoking status and family history of lung cancer in first degree relatives.
Validation of Polygenic Risk Score
The PRS in the UK Biobank was computed based on the same weights derived and applied in the OncoArray dataset to avoid model overfitting. Fourteen (2 from PRS-35) variants were not genotyped or imputed based on Haplotype Reference Consortium (HRC) panel, which resulted in PRS-114 for the analysis in UK Biobank. PRS-114 and PRS-128 is highly comparable with Pearson’s correlation coefficient of 0.984. All of the variants in the PRS passed imputation quality threshold (INFO>0.3). To validate the risk model built in the OncoArray, we used the same effect coefficients for the parameters included in the model (Supplementary Table 2).
Baseline Risk Model for Overall Population and Never Smokers
For overall population, we built upon the PLCOall2014 model previously developed based on the Prostate, Lung, Colorectal and Ovarian (PLCO) Cancer Screening Trial[24]. The predictors included age, race, education level, body mass index, chronic obstructive pulmonary disease (COPD), personal history of cancer, family history of lung cancer in first degree relatives, smoking status, smoking intensity, smoking duration, and smoking quit time. To address the issue of potential over- or under-estimation of the absolute risk when importing the coefficients of a risk model previous developed in a different population, and to integrate PRS into the risk model, we re-calibrated and re-parametrized the risk model using 50% of the UK Biobank cohort. Re-calibration is a statistical approach commonly used to adapt a risk model developed in a different population[25]. The remaining 50% of UK Biobank cohort is kept as the strict hold-out validation set for prospective evaluation (Supplementary Material). The analysis flow is depicted in Supplementary Figure 2. Multiplicative interactions assumption between PRS and the epidemiologic risk factors were assessed (Supplementary Materials).
It was well-recognized that lung cancer risk profiles are markedly different for never smokers, but there is currently no established risk model for never smokers. Taking advantage of the risk data available in UK Biobank, we adapted the split 80% training- 20% testing design using the UK Biobank cohort data, to investigate the predictive performance of additional risk factors that might be particularly relevant for never smokers, such as impaired lung function, ambient air pollution and second hand smoke. The latter two did not improve the model performance, therefore the risk factors included in the parsimonious model for never smokers are age, sex, education, family history, personal history of cancer and impaired lung function (Supplementary Materials).
Risk Model Evaluation based on the Hold-Out Validation Set in the UK Biobank Cohort
Evaluation of the model performance in the prospective study, including calibration and discrimination, was conducted based on the 50% hold-out set for the overall model and 20% hold-out set for the never-smoker model in UKB. Model calibration was assessed by evaluating how much the slope of the calibration line (plotting the predicted vs the observed probabilities) deviates from the ideal of 1. The 95% confidence intervals of the predicted risk were computed with the percentile-based bootstrap. Calibration was formally tested using Spiegelhalter’s z statistic and p-values are reported[26,27]. The model’s ability to discriminate was assessed by the area under the receiver operator characteristic curves (AUC). Risk discrimination improvement of the developed PRS was evaluated by comparing a base model with epidemiologic risk factors and a model that includes epidemiologic risk factors and PRS.
Absolute Risk Estimation
The five-year and cumulative absolute risk of developing lung cancer was estimated based on Cox proportional hazards model, accounting for the competing risk of all causes of death other than lung cancer[28]. The absolute risk was estimated in a given time interval by integrating 3 components: (i) a model of relative risks, (ii) age-specific lung cancer incidence rates, and (iii) distributions of risk factors of the population of interest[9,28,29]. To estimate the absolute risk trajectories for the overall population in the United Kingdom, we applied the re-calibrated PLCOall2014 model (Supplementary Table 2) with PRS and the age-specific incidence rate and competing rates for mortality rates obtained from Cancer Research UK, 2012[29]. For never smokers, we applied our never-smoker risk model as reported in the Supplementary Table 2, and the age-specific lung cancer rates specifically for never smokers that were derived from the UK Million Women Cohort[30] and the average male to female incidence ratio of lung cancer in never smokers previously reported in population cohorts[31]. The detailed estimation process is outlined in the Supplementary Materials.
Projection in the National Lung Screening Trial (NLST)
To assess how the risk model would work in a population that would be eligible for LDCT screening, we projected the absolute risks to the NLST population. There are 1,986 incident lung cancer and 48,786 controls in NLST with variables needed for the risk modeling available for our analysis. Because this population is comprised of ever-smokers only, we used PLCOm2012 (designed for ever-smokers only) as the baseline model here. Genotype information was not available for the NLST participants, so PRS profiles were simulated conditional on lung cancer status and family-history of lung cancer based on the methods previously described[9,28]. The weights of the PRS were based on the coefficient estimated from the independent PRS validation set (UK Biobank) to reduce over-fitting. The details parameter settings and reference rates are specified in Supplementary Materials. All tests of statistical significance were two-sided. All analyses were performed in R v.3.5.1.
RESULTS
The study characteristics of OncoArray (model training), UK Biobank (validation) and NLST (projection) are summarized in Table 1. In the OncoArray project, age and gender are well matched as most studies have applied frequency matching for these factors. As expected, there are more smokers, more individuals with family history of lung cancer or previous COPD history among lung cancer patients compared to controls. In the UK Biobank, being a general population cohort, the majority of the populations are never or former smokers. The NLST study is a smoker only population, as all individuals in this population have met the NLST screening criteria.
Table 1:
Demographic characteristics of the study populations including ILCCO OncoArray, UK Biobank and the National Lung Screening Trial (NLST)
| PRS construction | PRS validation Model performance evaluation | Projection in screen-eligible population | ||||||||||||
|---|---|---|---|---|---|---|---|---|---|---|---|---|---|---|
| ILCCO OncoArray (N=23,127) | UK Biobank (N=335,931) | NLST (N=50,772) | ||||||||||||
| Lung cancer cases | Controls | Lung cancer cases | Controls | Lung cancer cases | Controls | |||||||||
| Number | % | Number | % | Number | % | Number | % | Number | % | Number | % | |||
| Total | 13,119 | 10,008 | 1,768 | 334,163 | 1,986 | 48,786 | ||||||||
| Mean Age (SD) | 65.3 | (9.7) | 62.4 | (10.3) | 62.0 | (5.6) | 56.8 | (8.0) | 63.7 | (5.3) | 61.3 | (5.0) | ||
| Sex | ||||||||||||||
| Men | 8500 | (65) | 6494 | (65) | 921 | (52) | 154,571 | (46) | 1,195 | (60) | 28,748 | (59) | ||
| Women | 4619 | (35) | 3514 | (35) | 847 | (48) | 179,592 | (54) | 791 | (40) | 20,038 | (41) | ||
| Smoking | ||||||||||||||
| Never | 1,196 | (9) | 2,896 | (29) | 236 | (13) | 183,435 | (55) | 0 | 0 | ||||
| Former | 4,878 | (38) | 3,292 | (33) | 808 | (46) | 117,502 | (35) | 789 | (40) | 25,589 | (52) | ||
| Current | 6,857 | (53) | 3,286 | (33) | 724 | (41) | 33,226 | (10) | 1,197 | (60) | 23,197 | (48) | ||
| Family history of lung cancer among first degree relatives | ||||||||||||||
| No | 10,291 | (83) | 8,570 | (89) | 1323 | (77) | 286,297 | (87) | 1,460 | (74) | 38,100 | (78) | ||
| Yes | 2,153 | (17) | 1,042 | (11) | 387 | (23) | 42,153 | (13) | 526 | (26) | 10,686 | (22) | ||
| COPD history | ||||||||||||||
| No | 7,850 | (69) | 6,587 | (81) | 1581 | (90) | 328,465 | (98) | 1790 | (90) | 46,405 | (95) | ||
| Yes | 3,514 | (31) | 1,565 | (19) | 180 | (10) | 5,311 | (2) | 196 | (10) | 2,381 | (5) | ||
SD, standard deviation; COPD, Chronic Obstructive Pulmonary Disease.
The list of the variants included in PRS-128 is shown in Supplementary Table 1. The distribution of the PRS in OncoArray and UK Biobank is shown in the Supplementary Figure 3 (panel a and b), where we observed a shift of the PRS distribution toward the right (i.e. higher PRS) for the lung cancer cases. The association between PRS and lung cancer risk based on OncoArray data and UK Biobank is shown in Table 2. There was an increasing risk of lung cancer by decile, with approximately 3.5 folds of relative risk when comparing individuals in the lowest versus the highest decile in the PRS distribution in the OncoArray dataset with OR of 3.52(95%CI=3.11–3.98, p=7.34×10−88 ). A strong association was also observed in the independent validation set, UK Biobank, with increasing risk by PRS decile, and the OR of lung cancer for those in the top PRS decile is 2.39 (95%CI=1.92–3.00, p=1.80×10⁻¹⁴). The statistical significance diminished in the UK Biobank dataset given much smaller number of lung cancer patients available in this analysis. Nonetheless, the dose-response relationships between PRS and lung cancer risk remained prominent in both OncoArray (p-trend=1.77×10−127) and UK Biobank (p-trend=5.26×10⁻²⁰).
Table 2:
The odds ratio and 95% confidence intervals of the PRS and lung cancer risk by decile in OncoArray and UK Biobank
| PRS decile | Model building (OncoArray) | Validation (UK Biobank) | |||
|---|---|---|---|---|---|
| OR (95%CI)a | P-value | OR (95%CI)b | P-value | ||
| 0–10% | 1(Referent) | 1 (Referent) | |||
| 10–20% | 1.30 (1.15,1.46) | 1.39 ×10⁻⁵ | 1.31 (1.02, 1.68) | 3.54 ×10⁻² | |
| 20–30% | 1.62 (1.44, 1.82) | 1.34 ×10⁻¹⁵ | 1.16 (0.90, 1.50) | 2.46 ×10⁻¹ | |
| 30–40% | 1.58 (1.41, 1.78) | 1.94 ×10⁻¹⁴ | 1.57 (1.24, 2.00) | 2.07 ×10⁻⁴ | |
| 40–50% | 1.77 (1.57, 1.99) | 3.18 ×10⁻²¹ | 1.67 (1.32, 2.12) | 2.25 ×10⁻⁵ | |
| 50–60% | 2.01 (1.78, 2.26) | 1.12 ×10⁻³⁰ | 1.56 (1.23, 1.98) | 2.92 ×10⁻⁴ | |
| 60–70% | 2.19 (1.94, 2.46) | 7.91 ×10−38 | 1.67 (1.32, 2.13) | 1.89 ×10⁻⁵ | |
| 70–80% | 2.38 (2.11, 2.69) | 1.07 ×10−45 | 1.69 (1.34, 2.15) | 1.27 ×10⁻⁵ | |
| 80–90% | 2.70 (2.39, 3.04) | 4.23 ×10−58 | 2.00 (1.60, 2.53) | 2.58 ×10⁻⁹ | |
| 90–100% | 3.52 (3.11, 3.98) | 7.34 ×10−88 | 2.39 (1.92, 3.00) | 1.80 ×10⁻¹⁴ | |
| Trend p-value | 1.77 × 10−127 | 5.26 ×10⁻²⁰ | |||
adjusted for age, sex and top 5 principal components
adjusted for age, sex and top 5 principal components
The association between PRS and lung cancer risk per standard deviation (SD) in major risk strata by smoking, family history of lung cancer and histology is shown in Table 3. The effect estimates were slightly higher in the OncoArray dataset, which was expected as the model building set. Albeit slightly reduced statistical significance, PRS conferred robust associations in the UK Biobank population across all major risk strata, as the independent validation.
Table 3:
The odds ratio and 95% confidence intervals of the PRS and lung cancer risk by smoking status, family history, COPD history and histology in OncoArray and UK Biobank
| Risk Strata | PRS Building (OncoArray) | PRS Validation (UK Biobank) | ||||
|---|---|---|---|---|---|---|
| ORa per SD (95%CI) | p-value | ORb per SD (95%CI) | p-value | |||
| Overall | 1.43 (1.39,1.47) | 7.77 × 10−138 | 1.26 (1.20,1.32) | 9.69 × 10⁻²³ | ||
| Histology | Adenocarcinoma | 1.44 (1.39,1.49) | 1.22 × 10−86 | 1.30 (1.23,1.37) | 6.59 ×10⁻²³ | |
| Squamous cell | 1.42 (1.36,1.48) | 1.75 × 10−61 | 1.23 (1.16,1.30) | 9.58 ×10⁻¹³ | ||
| Small cell | 1.32 (1.24,1.41) | 1.14 × 10⁻¹⁸ | 1.25 (1.18,1.32) | 4.23 ×10⁻¹⁴ | ||
| Smoking | Never | 1.29 (1.20,1.38) | 1.57 ×10⁻¹² | 1.28 (1.13,1.46) | 8.86 × 10⁻⁵ | |
| Former | 1.42 (1.35,1.49) | 3.81 × 10−47 | 1.25 (1.17,1.34) | 1.44 × 10⁻¹⁰ | ||
| Current | 1.46 (1.39,1.53) | 2.42 × 10−60 | 1.28 (1.19,1.38) | 3.87 × 10⁻¹¹ | ||
| Family history | Yes | 1.38 (1.27,1.49) | 8.94 ×10⁻¹⁶ | 1.16 (1.05,1.27) | 4.03 × 10⁻³ | |
| No | 1.43 (1.39,1.48) | 7.92 × 10−116 | 1.29 (1.22,1.36) | 5.95 × 10⁻²¹ | ||
| COPD diagnosis | Yes | 1.37 (1.28,1.46) | 1.22 × 10⁻²⁰ | 1.26 (1.09,1.46) | 1.58 × 10⁻³ | |
| No | 1.41 (1.36,1.46) | 8.03 × 10−81 | 1.26 (1.20,1.32) | 1.86 × 10⁻²⁰ | ||
odds ratio adjusted for age, sex and top 5 principal components
odds ratio adjusted for age, sex and top 5 principal components
SD, standard deviation. OncoArray SD=0.54; UK Biobank SD=0.50
In UK Biobank prospective cohort, the risk model for overall population was reasonably calibrated (Supplementary Figure 4a) in the 50% hold-out validation set. For never smokers, while the observed risk was in general consistent with the predicted risk in the training set, it was less well-calibrated and appeared to fluctuate around the calibration slope given the limited sample size in the hold-out testing set, although the p-value based on the Spiegelhalter’s z test was not significant (Supplementary Figure 4b). The overall AUC did not substantially change when adding PRS for overall population with AUC of 0.832 (from AUC of 0.828 without PRS), but a modest increase in AUC among never smokers was observed from AUC of 0.670 to 0.687 (Supplementary Table 3). When estimating the AUC separately by age of onset, it appeared that the PRS contributed to the risk model in those with younger age of onset (<50), albeit modest added value: The AUC for those with young onset was 0.798 (95%CI=0.680–0.917) and 0.811(95%CI=0.701–0.902) without and with PRS terms, respectively (Supplementary Table 3).
To evaluate how PRS would affect individual’s absolute risk with increasing age, we estimated the absolute risk of lung cancer by the PRS decile. The average risk of the population was estimated based on the final model including all aforementioned risk factors and PRS. We observed a divergence of absolute risk trajectories that are due to individual’s genetic risk background, as encapsulated by PRS decile (Figure 1a and 1b). The span of absolute risk trajectory due to individual’s PRS was increasingly notable with older age. To understand the implication for LDCT screening in populations with different background risks, Figure 2 shows the 5-year absolute risk estimation stratified by smoking status and family history of lung cancer. For example, in the UK Biobank among current smokers with family history of lung cancer, the average risk of lung cancer in the next 5 years at 60 years old was approximately 4.29%, whereas the risk was 7.64% for those at top 10% PRS decile (p-value top 10% PRS vs 40–60% PRS = 8.80 × 10⁻¹⁵). As the absolute risk increases as the function of age, the direct consequence is when individuals would reach the threshold for LDCT screening.
Figure 1. Absolute risk estimates of lung cancer by PRS-114 deciles based on the UK Biobank study.
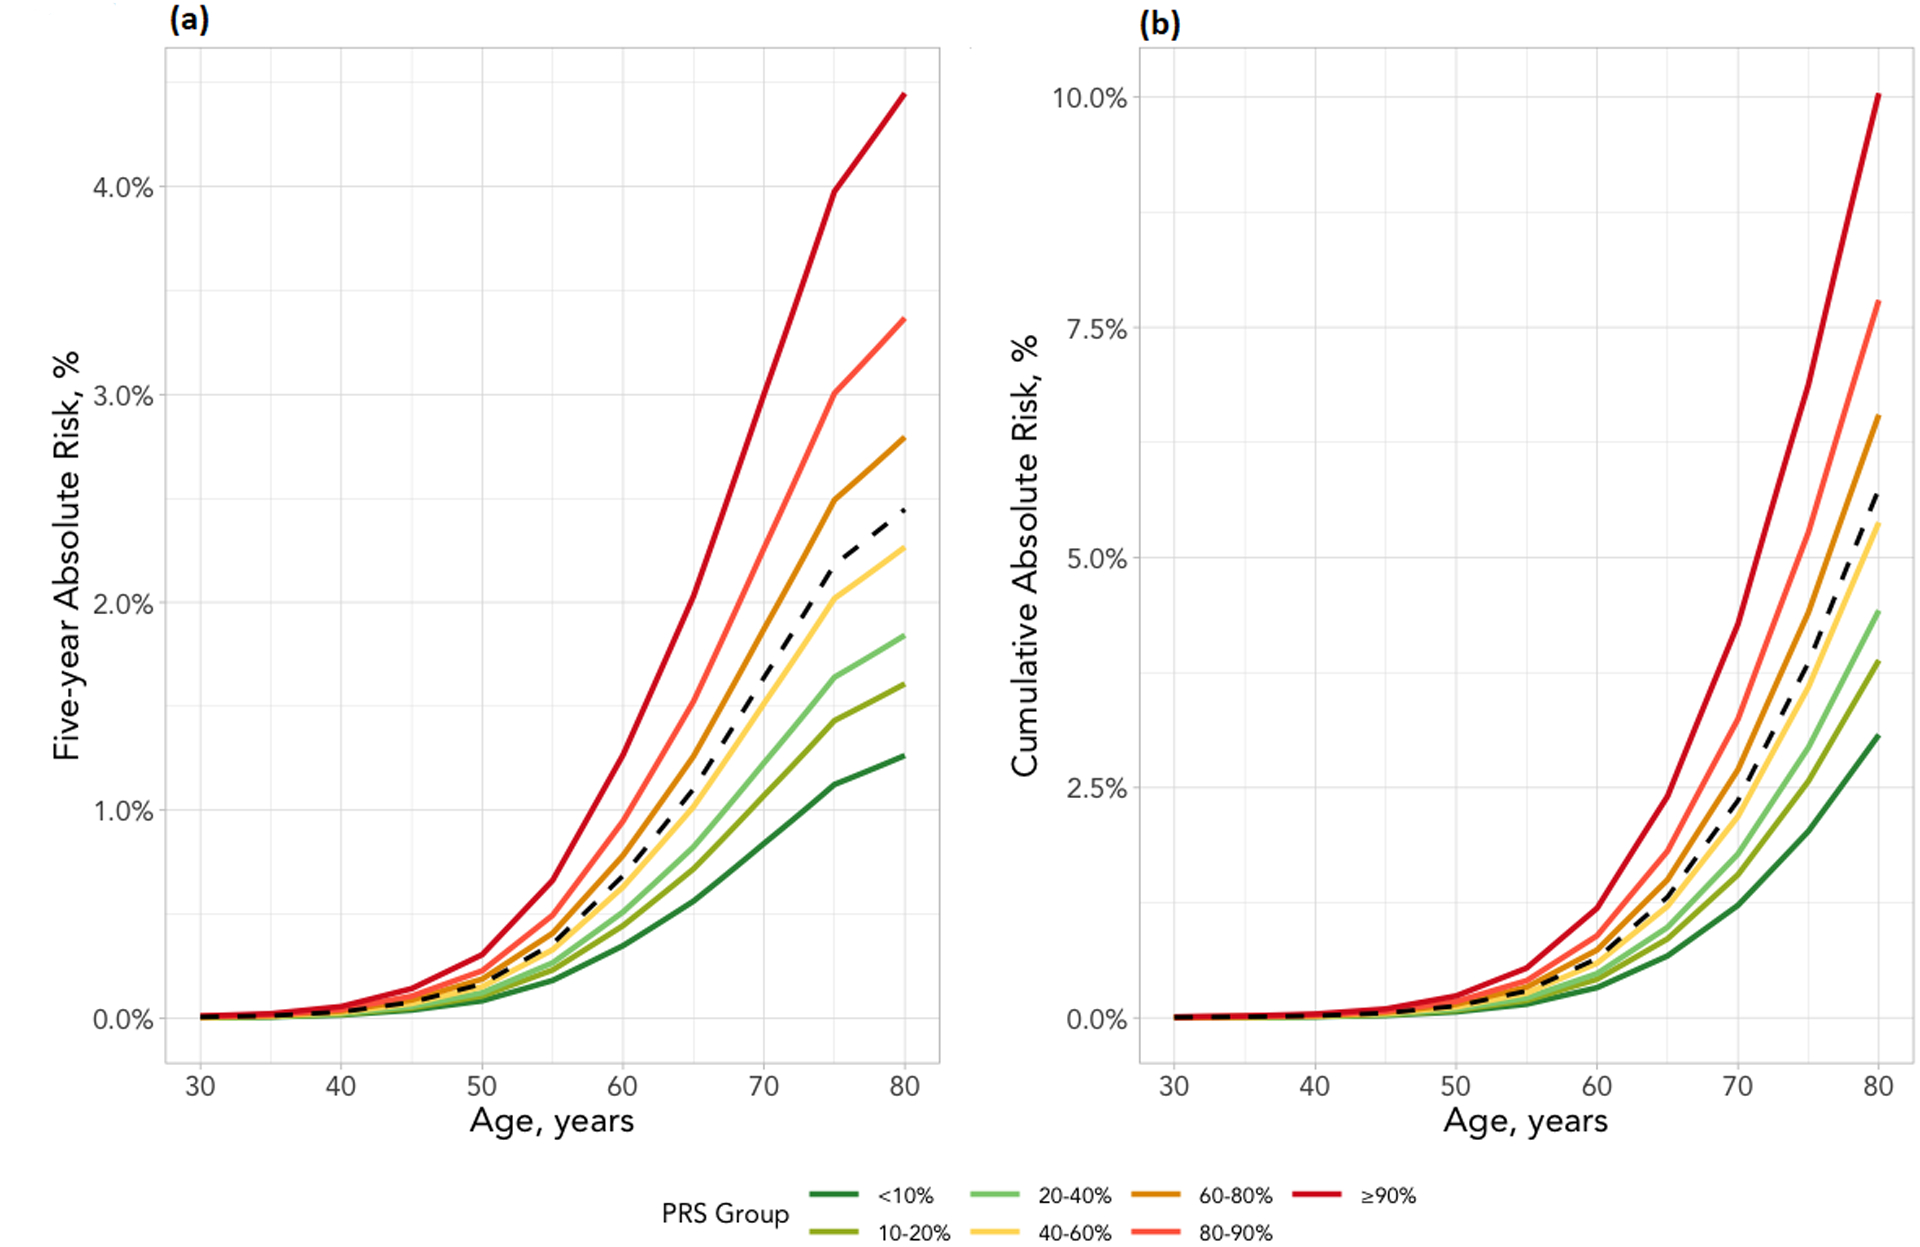
(a) Five-year absolute risk (b) Cumulative risk until age 80. The risk factors included are sex, race, education, BMI, tobacco smoking, COPD history and family history of cancer. The X-axis is the age of cohort entry. The curves depict average risk of individuals in different PRS deciles as specified by the legends. The dashed curve represents the average risk of the overall population in different ages based on the final model which include all risk factors and PRS. The divergence of the risk curves represents the contribution of PRS and increasing age.
Figure 2. Absolute risk estimates of lung cancer by smoking status and family history of lung cancer based on the UK Biobank study.
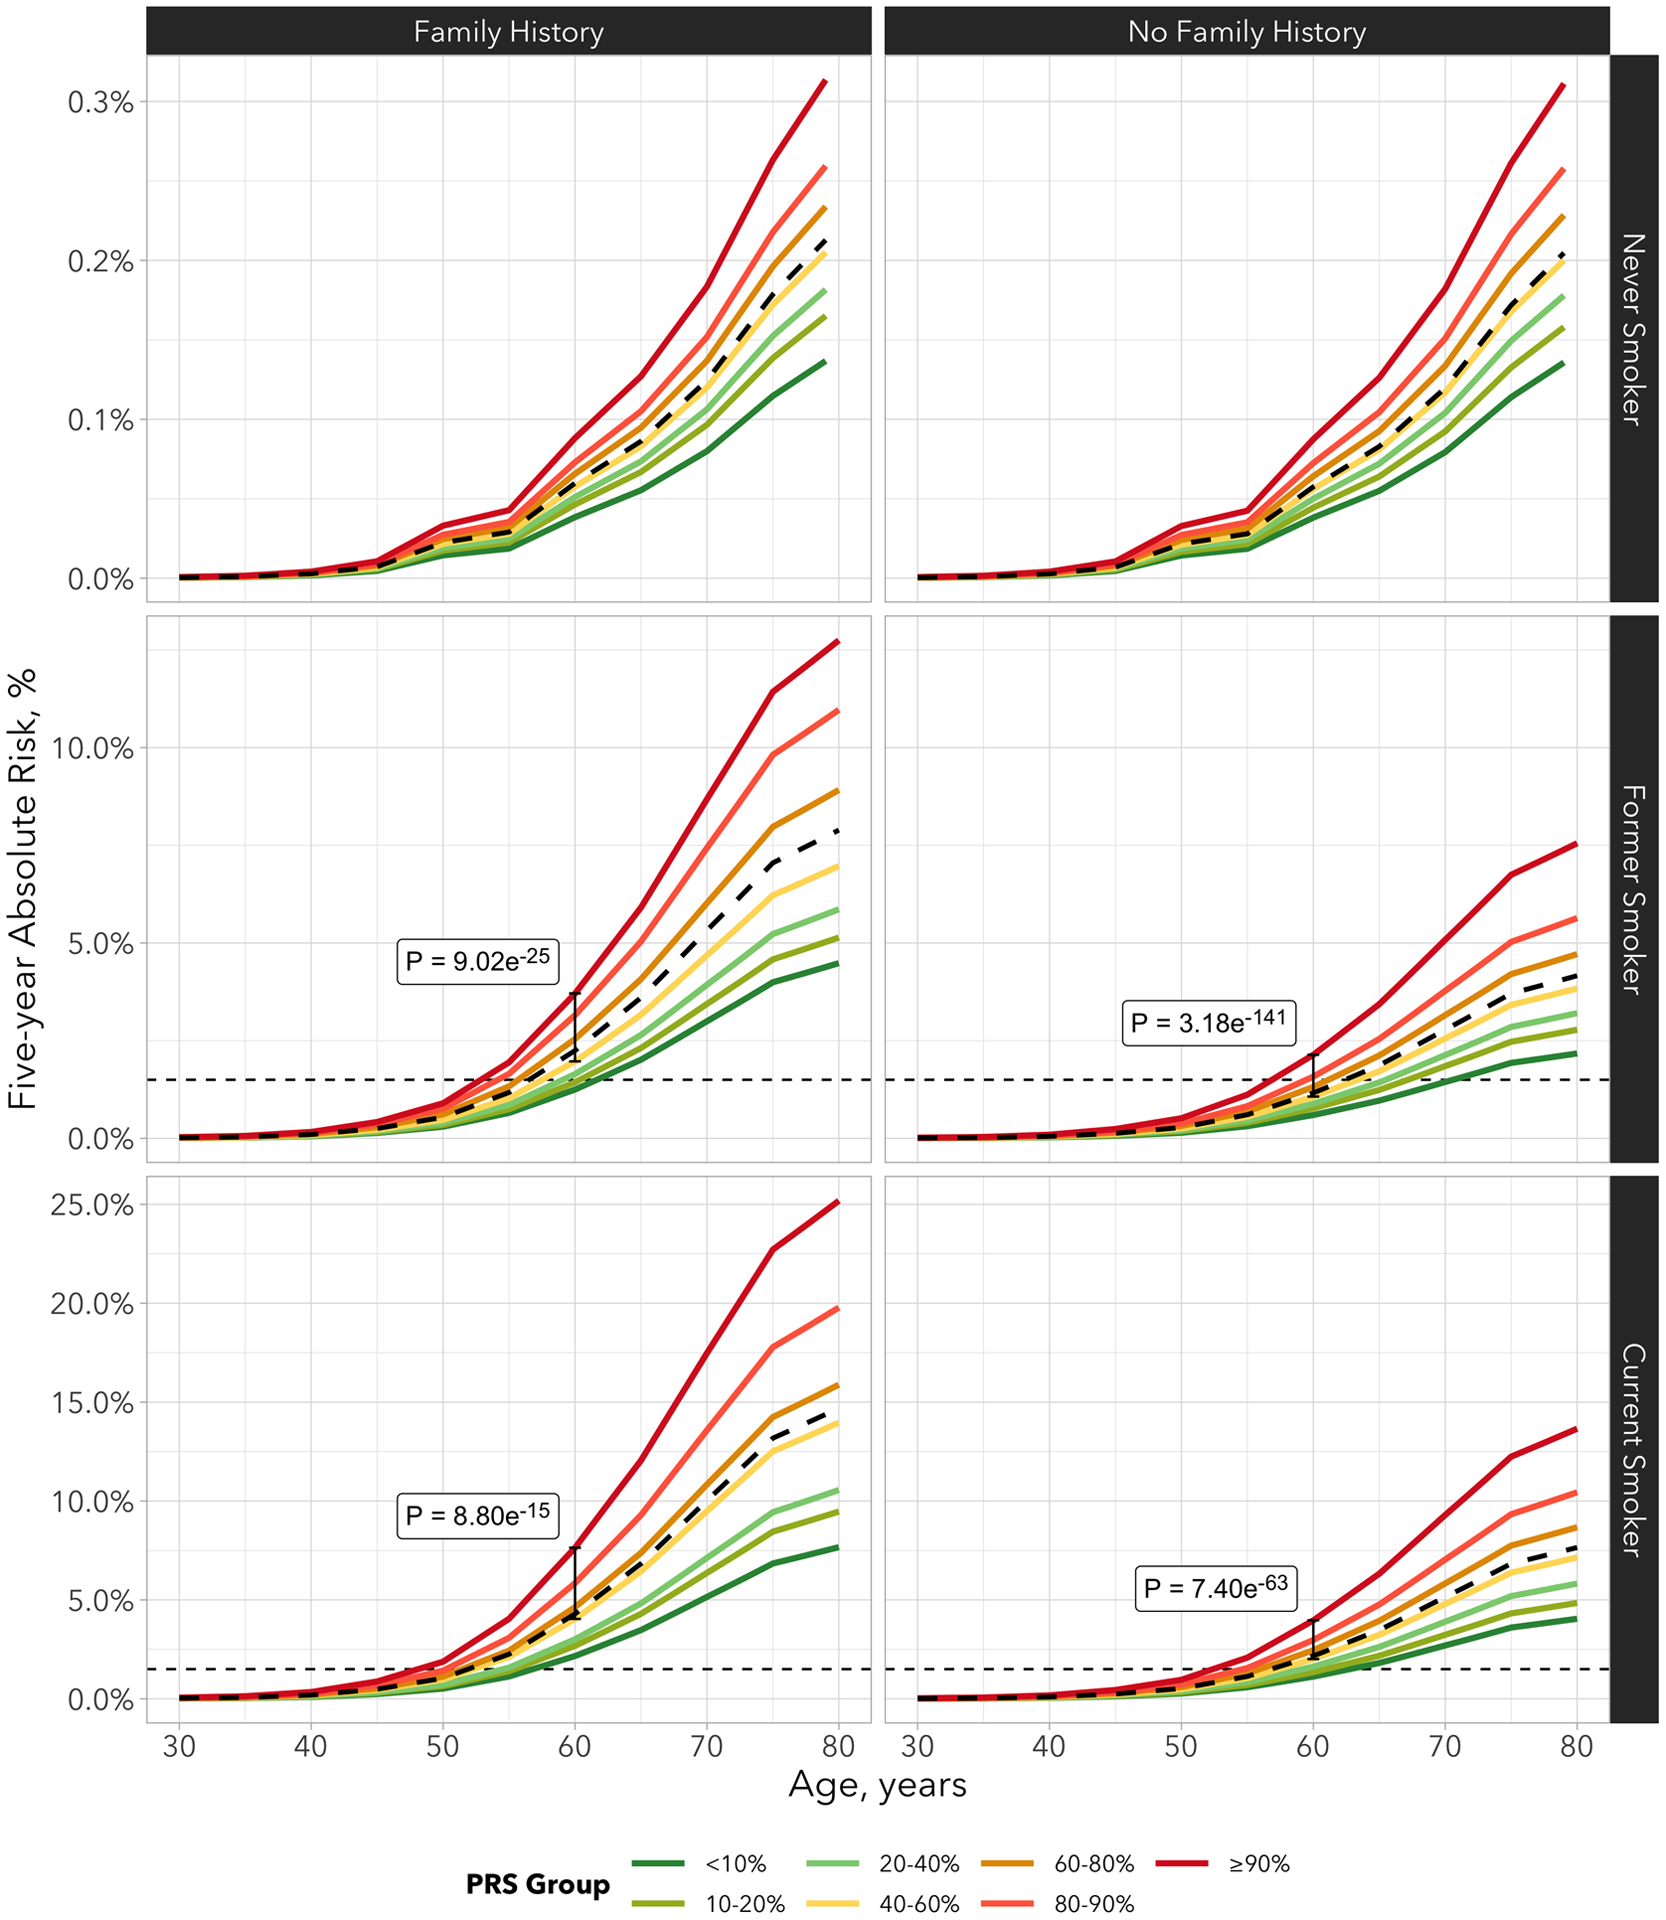
The risk factors included in the model are sex, race, education, BMI, tobacco smoking, COPD history and family history of lung cancer. The X-axis is the age of cohort entry. The curves depict average risk of individuals in different PRS deciles as specified by the legends. The dashed curve represents the average risk of the overall population in different ages based on the final model which include all risk factors and PRS-114. The divergence of the risk curves represents the contribution of PRS and increasing age. The blue horizontal dotted line represents 1.5% of 5-year absolute risks of lung cancer.
Assuming 1.5% lung cancer absolute risk within the next 5 years as the threshold to be recommended for LDCT screening, never smokers did not reach sufficient risk threshold to be recommended for LDCT screening regardless their PRS deciles. Therefore the PRS distribution does not appear to have implications among the never smoker group in general. On the other hand, among ever-smokers, the PRS distribution can affect when the individuals reach the absolute risk threshold for LDCT screening. For example, on average, individuals who smoked but without family history reach the 1.5% of 5-year absolute risk at age 61, whereas those who are at the top 1% of PRS distribution would reach the threshold at age 53 (Figure 2, Supplementary Table 4). Among those who smoked and with positive family history of lung cancer, the average age to reach the LDCT screening recommendation threshold would be 56, but those who are at top 5% PRS would reach the threshold at age 52, earlier than the previous LDCT screening guideline (Figure 2, Supplementary Table 4)[4]. Among current smokers, those with family history of lung cancer and at the top 10% of the PRS distribution would reach 1.5% of 5-year risk before they turn 50.
To show the impact of smoking status and PRS, Supplementary Figure 5 illustrates the absolute risk trajectory based on the combination of both smoking status and PRS. It is clear that smoking cessation reduces the lung cancer absolute risk regardless which PRS category one belongs to, with an relative reduction of approximately 45% of lung cancer risk by age 70, which is consistent with previous reports [32,33]. For example, among those at the top 10% of PRS, smoking cessation reduced the 5-year absolute risk from 10.5% to 5.6% by age 70 representing an absolute risk reduction of 4.9%; and among those with intermediate PRS, smoking cessation reduced the 5-year absolute risk from 5.5% to 3.0%, representing an absolute risk reduction of 2.5%.
To evaluate extent of the absolute risks could be modified by PRS in a LDCT eligible population (heavy smokers and older), we show the 5-year absolute risks and cumulative risk by age 85 for the NLST population in Figure 3 (panel a and b), with PRS simulated per methods described. The absolute risk of lung cancer differed by individual’s genetic background in this high-risk population, and the risk differences between different PRS decile increased along with increasing age.
Figure 3. Absolute risk estimates of lung cancer based on the projection in the NLST.
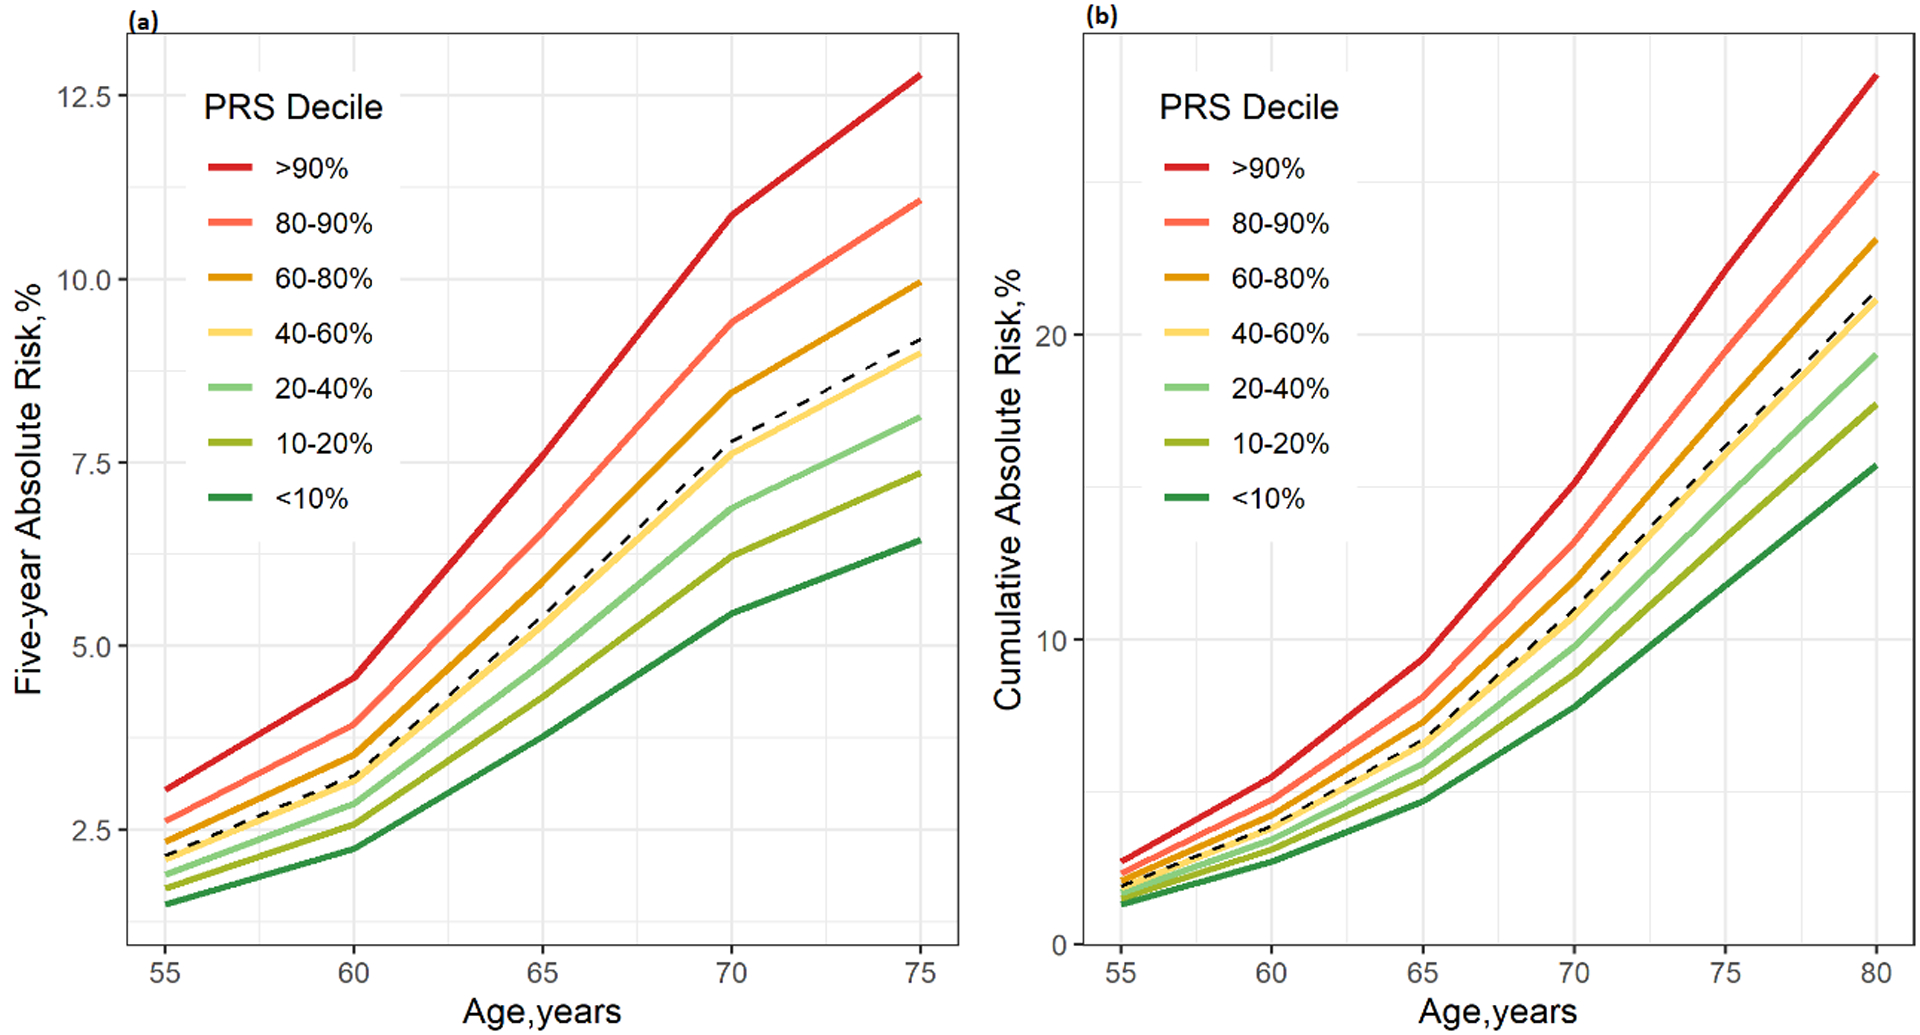
(a) Five-year absolute risk (b) Cumulative risk until age 80. The risk factors included in the model are race, BMI, education, smoking history, personal history of cancer and COPD, family history of lung cancer. The X-axis is the age of cohort entry. The curves depict the average risk of individuals in different PRS-114 deciles as specified by the legends. The dashed curve represents the average risk of the overall population in the corresponding age based on the final model including all risk factors and PRS-114. The divergence of the risk curves represents the contribution of PRS and increasing age.
DISCUSSION
In this study, we evaluated whether individual’s genetic background can be used to stratify their lung cancer absolute risk, incorporated within the well-known lung cancer risk models. Our analysis showed PRS is associated with individual’s lung cancer risk with a dose-response relationship. Furthermore, individual’s genetic background, as encapsulated by PRS, can further stratify individual’s lung cancer absolute risk in the next 5 years, or cumulatively in their life time. The risk model was developed and validated in two large independent datasets.
The key observation of this analysis is that individual’s genetic background has limited impact on the risk model’s ability to discriminate whether individuals eventually develop lung cancer. However, the genetic background is informative regarding individual’s age for reaching the LDCT screening-eligible threshold, as the absolute risk trajectories diverge by PRS decile and increasing age. This is clinically relevant, as it could potentially affect when LDCT screening should be recommended to the individuals. The absolute risk stratified by smoking and family history of lung cancer showed that ever smokers would reach the LDCT screening threshold at a very different age depending on their family history of lung cancer and their genetic makeup, with the difference to be as large as 4 years compared to the average age among those with family history and 8 years among those without family history. These differences are clinically meaningful as they would represent much more timely detection for those who are at top 10% of PRS and can start screening before the previous official USPSTF recommended age of 55[4], and also identify those who do not need to be screened until past age 60, which would reduce healthcare burden and radiation exposures. Most recently, USPSTF task force presented the draft recommendation updated in July 2020, expanding the eligibility to an earlier starting age of 50 (uspreventiveservicestaskforce.org), which would help to include some of those with higher genetic risk. On the other hand, it also showed that the vast majority of the never smokers would never reach the LDCT screening threshold despite their genetic background.
One of the potential hindrances of implementing the genetic testing among potentially eligible population for more precise LDCT screening recommendation would be the cost and feasibility associated with the genotyping. With the reduction of the genotyping cost, we expect that the genotyping cost can be offset by the reduction of unnecessary LDCT scans and quality-adjusted life year saved when the lung cancer is detected before the recommended LDCT starting age. However, an systematic assessment of feasibility and a formal cost-effective analysis with detailed sensitivity analysis with varying parameter will be required to provide a in depth comparison of the different approaches, which is beyond the scope of this study.
The variants that were selected into the model, either through previous work (PRS-35) or the penalized regression applied in this study (PRS-93), were located in several different regions. The 35 variants were predominately from previously known lung cancer loci (such as TERT, HLA, CHEK2), and the biology implications have been previously reported. The variants selected by the lasso penalized regression includes additional variants from previously known regions but not sufficiently tagged by those in PRS-35, as well as from other genetic regions from pathways related to cytokines and chemokines(e.g. TRIM31, TRIM15, XCL2, IRF4, ILC33, VSTM1, etc) and signaling pathways (MAP3K20, NUMBL)(Supplementary Table 1)
There are several potential limitations of this study. First, the PRS assumes multiplicativity among genetic variants. While we have assessed the pair-wise interactions and did not observe any interactions between the variants, we did not assess higher order of interactions. Nevertheless, this is a method that is considered efficient and reasonable for representing individual’s genetic background[13,34]. We have assessed the potential interactions between risk factors and PRS, although nominal interactions were detected between age and smoking status, including interaction terms did not lead to material change of the results. We therefore consider our parsimonious model (less variables with same predictive accuracy) to be the reasonable to use in the clinical setting. Second, the present analysis was done on the population with European ancestry, thus likely cannot be readily generalized to other racial groups. Additional analysis in other ethnicities will be needed, in particular Asians and African ancestry population. A separate effort for establishing a PRS model based on the China Kadoorie Biobank, which contains genetic data on approximately 95,000 individuals, is currently underway. The cohort study we used to evaluate the model prospectively, UK Biobank, is a general population cohort, although the social economic status is skewed toward the higher levels similar to other population cohorts, thus the prevalence of some related risk factors (such as smoking prevalence) might be under-represented, which can affect the absolute risk estimation. However, this would not affect model’s ability to discriminate. In addition, we addressed this issue by recalibrating the model using 50% of the UKB data and applied the re-calibrated coefficients into the absolute risk estimation and by estimating the absolute risks in never smokers separately. Finally, even though that we have built a de novo model for never smokers, the model’s ability to discriminate remains modest. However, we were able to investigate additional risk factor that can be relevant for never smokers, such as second-hand smoke, ambient air pollution and impaired lung function, albeit the sample size of non-smoking lung cancer cases in UK Biobank is limited. With increasing availability of data on these data elements, it is possible for the model performance to improve, and if so, risk of never smokers may reach sufficient threshold to warrant CT screening with vastly improved predictive performance.
Our study has several important strengths: We have constructed and validated PRS based on the largest lung cancer germline genomic data to date, which provide the most robust estimates currently available. In addition, we have conducted the multi-stage model building and validation with large population cohort dataset with a total over 350,000 participants with both stages. This ensures the validity of the model and minimizes the potential over-optimism. Finally, we applied novel methodology to simulate PRS distribution in the NLST population to assess the potential clinical utility of PRS in a screening-eligible population.
In summary, our study showed that individual’s genetic background can potentially affect the optimal timing of starting LDCT screening. It is possible to continue to refine the risk prediction algorithm if the sample sizes increase substantially. This is the first study that reported the potential clinical utility of PRS in the European descendent population with comprehensive assessment.
Supplementary Material
Statement of Significance.
Three large-scale datasets reveal that, after accounting for risk factors, an individual’s genetics can affect their lung cancer risk trajectory, thus may inform the optimal timing for LDCT screening.
ACKNOWLEDGEMENT
This research has been conducted using the UK Biobank Resource under Application Number 23261. We thank all participating studies. The CAPUA study was supported by FIS-FEDER/Spain grant numbers FIS-01/310, FIS-PI03-0365, and FIS-07-BI060604, FICYT/Asturias grant numbers FICYT PB02-67 and FICYT IB09-133, and the University Institute of Oncology (IUOPA), of the University of Oviedo and the Ciber de Epidemiologia y Salud Pública. CIBERESP, SPAIN. CARET is funded by the National Cancer Institute, National Institutes of Health through grants U01-CA063673, UM1-CA167462, and U01-CA167462. The Liverpool Lung project is supported by the Roy Castle Lung Cancer Foundation. The Harvard Lung Cancer Study was supported by the NIH (National Cancer Institute) grants CA092824, CA090578, CA074386 and 5U01CA209414. The Multiethnic Cohort Study was partially supported by NIH Grants CA164973, CA033619, CA63464 and CA148127. The work performed in MSH-PMH study was supported by The Canadian Cancer Society Research Institute (020214), Ontario Institute of Cancer and Cancer Care Ontario Chair Award to R.J.H. and G.L. and the Alan Brown Chair and Lusi Wong Programs at the Princess Margaret Hospital Foundation. The Norway study was supported by Norwegian Cancer Society, Norwegian Research Council. The work in TLC study has been supported in part the James & Esther King Biomedical Research Program (09KN-15), National Institutes of Health Specialized Programs of Research Excellence (SPORE) Grant (P50 CA119997), and by a Cancer Center Support Grant (CCSG) at the H. Lee Moffitt Cancer Center and Research Institute, an NCI designated Comprehensive Cancer Center (grant number P30-CA76292). The Vanderbilt Lung Cancer Study - BioVU dataset used for the analyses described was obtained from Vanderbilt University Medical Center’s BioVU, which is supported by institutional funding, the 1S10RR025141-01 instrumentation award, and by the Vanderbilt CTSA grant UL1TR000445 from NCATS/NIH and K07CA172294 . The Copenhagen General Population Study (CGPS) was supported by the Chief Physician Johan Boserup and Lise Boserup Fund, the Danish Medical Research Council and Herlev Hospital. The NELCS study: Grant Number P20RR018787 from the National Center for Research Resources (NCRR), a component of the National Institutes of Health (NIH). Kentucky Lung Cancer Research Initiative was supported by the Department of Defense [Congressionally Directed Medical Research Program, U.S. Army Medical Research and Materiel Command Program] under award number: 10153006 (W81XWH-11-1-0781). Views and opinions of, and endorsements by the author(s) do not reflect those of the US Army or the Department of Defense. It also was supported by NIH grant UL1TR000117 and P30 CA177558 using Shared Resource Facilities: Cancer Research Informatics, Biospecimen and Tissue Procurement, and Biostatistics and Bioinformatics. Where authors are identified as personnel of the International Agency for Research on Cancer/World Health Organization, the authors alone are responsible for the views expressed in this article and they do not necessarily represent the decisions, policy or views of the International Agency for Research on Cancer/World Health Organization.
FUNDING
This study was funded by the National Institute of Health (U19 CA203654, Integrative Analysis of Lung Cancer Risk and Etiology, INTEGRAL), and CIHR Foundation Grant (FDN 167273) and Canada Research Chair to R.J.H. The funding organizations have no role in any aspect of the study, including study design, management, data collection, analysis, result interpretation, or any stage of the manuscript preparation.
Footnotes
Conflict of Interests Statement: The authors declare no potential conflicts of interest.
List of References
- 1.Bray F, Ferlay J, Soerjomataram I, Siegel RL, Torre LA, Jemal A. Global cancer statistics 2018: GLOBOCAN estimates of incidence and mortality worldwide for 36 cancers in 185 countries. CA Cancer J Clin. September 12 2018. [DOI] [PubMed] [Google Scholar]
- 2.Aberle DR, Adams AM, Berg CD, Black WC, Clapp JD, Fagerstrom RM, et al. Reduced lung-cancer mortality with low-dose computed tomographic screening. The New England journal of medicine. August 4 2011;365(5):395–409. [DOI] [PMC free article] [PubMed] [Google Scholar]
- 3.de Koning HJ, van der Aalst CM, de Jong PA, Scholten ET, Nackaerts K, Heuvelmans MA, et al. Reduced Lung-Cancer Mortality with Volume CT Screening in a Randomized Trial. N Engl J Med. February 6 2020;382(6):503–513. [DOI] [PubMed] [Google Scholar]
- 4.Pinsky PF, Gierada DS, Hocking W, Patz EF Jr., Kramer BS. National Lung Screening Trial findings by age: Medicare-eligible versus under-65 population. Annals of internal medicine. November 4 2014;161(9):627–633. [DOI] [PMC free article] [PubMed] [Google Scholar]
- 5.Tammemagi MC, Lam S. Screening for lung cancer using low dose computed tomography. BMJ. 2014;348:g2253. [DOI] [PubMed] [Google Scholar]
- 6.McKay JD, Hung RJ, Han Y, Zong X, Carreras-Torres R, Christiani DC, et al. Large-scale association analysis identifies new lung cancer susceptibility loci and heterogeneity in genetic susceptibility across histological subtypes. Nat Genet. July 2017;49(7):1126–1132. [DOI] [PMC free article] [PubMed] [Google Scholar]
- 7.Bosse Y, Amos CI. A Decade of GWAS Results in Lung Cancer. Cancer Epidemiol Biomarkers Prev. April 2018;27(4):363–379. [DOI] [PMC free article] [PubMed] [Google Scholar]
- 8.Khera AV, Chaffin M, Aragam KG, Haas ME, Roselli C, Choi SH, et al. Genome-wide polygenic scores for common diseases identify individuals with risk equivalent to monogenic mutations. Nat Genet. September 2018;50(9):1219–1224. [DOI] [PMC free article] [PubMed] [Google Scholar]
- 9.Maas P, Barrdahl M, Joshi AD, Auer PL, Gaudet MM, Milne RL, et al. Breast Cancer Risk From Modifiable and Nonmodifiable Risk Factors Among White Women in the United States. JAMA oncology. October 1 2016;2(10):1295–1302. [DOI] [PMC free article] [PubMed] [Google Scholar]
- 10.Schumacher FR, Al Olama AA, Berndt SI, Benlloch S, Ahmed M, Saunders EJ, et al. Association analyses of more than 140,000 men identify 63 new prostate cancer susceptibility loci. Nat Genet. July 2018;50(7):928–936. [DOI] [PMC free article] [PubMed] [Google Scholar]
- 11.Elliott J, Bodinier B, Bond TA, Chadeau-Hyam M, Evangelou E, Moons KGM, et al. Predictive Accuracy of a Polygenic Risk Score-Enhanced Prediction Model vs a Clinical Risk Score for Coronary Artery Disease. JAMA. February 18 2020;323(7):636–645. [DOI] [PMC free article] [PubMed] [Google Scholar]
- 12.Lello L, Raben TG, Yong SY, Tellier L, Hsu SDH. Genomic Prediction of 16 Complex Disease Risks Including Heart Attack, Diabetes, Breast and Prostate Cancer. Sci Rep. October 25 2019;9(1):15286. [DOI] [PMC free article] [PubMed] [Google Scholar]
- 13.Lambert SA, Abraham G, Inouye M. Towards clinical utility of polygenic risk scores. Hum Mol Genet. November 21 2019;28(R2):R133–R142. [DOI] [PubMed] [Google Scholar]
- 14.Weissfeld JL, Lin Y, Lin HM, Kurland BF, Wilson DO, Fuhrman CR, et al. Lung Cancer Risk Prediction Using Common SNPs Located in GWAS-Identified Susceptibility Regions. J Thorac Oncol. November 2015;10(11):1538–1545. [DOI] [PMC free article] [PubMed] [Google Scholar]
- 15.Raji OY, Agbaje OF, Duffy SW, Cassidy A, Field JK. Incorporation of a genetic factor into an epidemiologic model for prediction of individual risk of lung cancer: the Liverpool Lung Project. Cancer Prev Res (Phila). May 2010;3(5):664–669. [DOI] [PubMed] [Google Scholar]
- 16.Amos CI, Dennis J, Wang Z, Byun J, Schumacher FR, Gayther SA, et al. The OncoArray Consortium: a Network for Understanding the Genetic Architecture of Common Cancers. Cancer epidemiology, biomarkers & prevention : a publication of the American Association for Cancer Research, cosponsored by the American Society of Preventive Oncology. October 3 2016. [DOI] [PMC free article] [PubMed] [Google Scholar]
- 17.Amos CI, Dennis J, Wang Z, Byun J, Schumacher FR, Gayther SA, et al. The OncoArray Consortium: A Network for Understanding the Genetic Architecture of Common Cancers. Cancer Epidemiol Biomarkers Prev. January 2017;26(1):126–135. [DOI] [PMC free article] [PubMed] [Google Scholar]
- 18.Sudlow C, Gallacher J, Allen N, Beral V, Burton P, Danesh J, et al. UK Biobank: An Open Access Resource for Identifying the Causes of a Wide Range of Complex Diseases of Middle and Old Age. PLoS Medicine. 2015;12(3):1–10. [DOI] [PMC free article] [PubMed] [Google Scholar]
- 19.Bycroft C, Freeman C, Petkova D, Band G, Elliott LT, Sharp K, et al. The UK Biobank resource with deep phenotyping and genomic data. Nature. October 2018;562(7726):203–209. [DOI] [PMC free article] [PubMed] [Google Scholar]
- 20.MacArthur J, Bowler E, Cerezo M, Gil L, Hall P, Hastings E, et al. The new NHGRI-EBI Catalog of published genome-wide association studies (GWAS Catalog). Nucleic Acids Res. January 4 2017;45(D1):D896–D901. [DOI] [PMC free article] [PubMed] [Google Scholar]
- 21.Kachuri L, Amos CI, McKay JD, Johansson M, Vineis P, Bueno-de-Mesquita HB, et al. Fine mapping of chromosome 5p15.33 based on a targeted deep sequencing and high density genotyping identifies novel lung cancer susceptibility loci. Carcinogenesis. January 2016;37(1):96–105. [DOI] [PMC free article] [PubMed] [Google Scholar]
- 22.Brenner DR, Amos CI, Brhane Y, Timofeeva MN, Caporaso N, Wang Y, et al. Identification of lung cancer histology-specific variants applying Bayesian framework variant prioritization approaches within the TRICL and ILCCO consortia. Carcinogenesis. November 2015;36(11):1314–1326. [DOI] [PMC free article] [PubMed] [Google Scholar]
- 23.Poirier JG, Brennan P, McKay JD, Spitz MR, Bickeboller H, Risch A, et al. Informed genome-wide association analysis with family history as a secondary phenotype identifies novel loci of lung cancer. Genetic Epidemiology. 2015;39(3):197–206. [DOI] [PMC free article] [PubMed] [Google Scholar]
- 24.Tammemagi MC, Church TR, Hocking WG, Silvestri GA, Kvale PA, Riley TL, et al. Evaluation of the lung cancer risks at which to screen ever- and never-smokers: screening rules applied to the PLCO and NLST cohorts. PLoS medicine. December 2014;11(12):e1001764. [DOI] [PMC free article] [PubMed] [Google Scholar]
- 25.Puddu PE, Piras P, Kromhout D, Tolonen H, Kafatos A, Menotti A. Re-calibration of coronary risk prediction: an example of the Seven Countries Study. Sci Rep. December 14 2017;7(1):17552. [DOI] [PMC free article] [PubMed] [Google Scholar]
- 26.Huang Y, Li W, Macheret F, Gabriel RA, Ohno-Machado L. A tutorial on calibration measurements and calibration models for clinical prediction models. Journal of the American Medical Informatics Association : JAMIA. April 1 2020;27(4):621–633. [DOI] [PMC free article] [PubMed] [Google Scholar]
- 27.Spiegelhalter DJ. Probabilistic prediction in patient management and clinical trials. Stat Med. Sep-Oct 1986;5(5):421–433. [DOI] [PubMed] [Google Scholar]
- 28.Pal Choudhury P, Maas P, Wilcox A, Wheeler W, Brook M, Check D, et al. iCARE: An R package to build, validate and apply absolute risk models. PLoS One. 2020;15(2):e0228198. [DOI] [PMC free article] [PubMed] [Google Scholar]
- 29.Lung cancer, age-specific incidence rates, 2012–2014. Cancer Research UK; 2017. [Google Scholar]
- 30.Pirie K, Peto R, Green J, Reeves GK, Beral V, Million Women Study C. Lung cancer in never smokers in the UK Million Women Study. Int J Cancer. July 15 2016;139(2):347–354. [DOI] [PMC free article] [PubMed] [Google Scholar]
- 31.Wakelee HA, Chang ET, Gomez SL, Keegan TH, Feskanich D, Clarke CA, et al. Lung cancer incidence in never smokers. J Clin Oncol. February 10 2007;25(5):472–478. [DOI] [PMC free article] [PubMed] [Google Scholar]
- 32.Peto R, Darby S, Deo H, Silcocks P, Whitley E, Doll R. Smoking, smoking cessation, and lung cancer in the UK since 1950: combination of national statistics with two case-control studies. BMJ. August 5 2000;321(7257):323–329. [DOI] [PMC free article] [PubMed] [Google Scholar]
- 33.Thun MJ, Henley SJ, Travis WD. Lung Cancer. In: Thun MJ, Linet MS, Cerhan JR, Haiman CA, Schottenfeld D, eds. Cancer Epidemiology and Prevention, 4th Edition. New York: Oxford University Press; 2018:519–552. [Google Scholar]
- 34.Chatterjee N, Shi J, Garcia-Closas M. Developing and evaluating polygenic risk prediction models for stratified disease prevention. Nature reviews. Genetics May 3 2016. [DOI] [PMC free article] [PubMed] [Google Scholar]
Associated Data
This section collects any data citations, data availability statements, or supplementary materials included in this article.