

Abstract
Background:
Abdominal atherosclerotic plaque burden may have clinical significance but manual measurement is time-consuming and impractical.
Purpose:
To perform external validation on an automated atherosclerotic plaque detector for noncontrast and post-contrast abdominal CT.
Materials and Methods:
The training data consisted of 114 noncontrast CT scans and 23 post-contrast CT urography scans. The testing data set consisted of 922 CT colonography (CTC) scans, and 1207 paired noncontrast and post-contrast CT scans from renal donors from a second institution. Reference standard data included manual plaque segmentations in the 137 training scans and manual plaque burden measurements in the 922 CT colonography scans. The total Agatston score and group (0-3) was determined using fully-automated deep learning software. Performance was assessed by measures of agreement, linear regression and paired evaluations.
Results:
On CTC scans, automated Agatston scoring correlated highly with manual assessment (R2 = 0.94). On paired renal donor CT scans, automated Agatston scoring on post-contrast CT correlated highly with noncontrast CT (R2 = 0.95). When plaque burden was expressed as a group score, there was excellent agreement for both the CTC (weighted kappa 0.80±0.01 [95% C.I.: 0.78 to 0.83]) and renal donor (0.83±0.02 [0.79 to 0.86]) assessments.
Conclusion:
Fully automated detection, segmentation and scoring of abdominal atherosclerotic plaques on both pre- and post-contrast CT was validated and may have application for population-based studies.
Keywords: image processing, 3D-UNet, Agatston score, machine learning
Summary Statement
In summary, we showed that abdominal atherosclerotic plaque burden can be assessed accurately and automatically on both noncontrast and post-contrast scans.
Cardiovascular disease is the most frequent cause of death in Americans. Morbidity and mortality are frequently associated with atherosclerotic disease in the coronary and carotid arteries. Recent evidence indicates that atherosclerosis in the abdomen may precede that in the coronaries and carotids and may be more predictive of cardiovascular events than standard clinical risk scores (1–4). Therefore, assessment of abdominal atherosclerotic burden may have clinical utility for prognosis and early detection and treatment.
Imaging methods for noninvasive diagnosis of atherosclerotic plaque include CT, MRI and ultrasound. Of these, the most frequently used are CT to assess plaque in the heart, and ultrasound in the neck and peripheral arteries. Coronary artery calcium screening is usually performed on noncontrast CT. Automatic identification of calcified plaque on contrast-enhanced studies is inherently much more difficult and not routinely performed as adjacent iodine density can be in the same Hounsfield Unit (HU) range as calcium.
Given the high frequency of abdominal CT scanning in the United States, automated assessment of abdominal atherosclerotic burden for opportunistic screening might be clinically useful. Because most abdominal CT scanning is performed with intravenous contrast, plaque detection is challenging. The purpose of this paper is to perform external validation on an automated atherosclerotic plaque detector for noncontrast and post-contrast abdominal CT.
Materials and Methods
This study was approved by the Institutional Review Boards of the respective institutions. The requirement for informed consent was waived.
Patient population
The CT scans were performed at two tertiary care hospitals. Four different CT data sets were utilized. The first is a consecutive series of 950 CT colonography scans (after exclusion of 80 scans having artifacts or quantum mottle that prevented accurate calcium measurements) performed at institution one (3). The second is a consecutive series of 1,250 renal donor CT scans performed at institution one (manuscript submitted for publication). The third is a consecutive series of 120 CT scans from PET-CT of patients with vasculitis participating in a clinical trial at institution two (5). The fourth is a selected series of 24 CT urography scans performed for a variety of indications at institution two. Patient demographics are provided in Table 1. A STARD chart showing exclusions and case assignment to training and testing sets is shown in Figure 1.
Table 1.
Patient Demographics
| Dataset | CTC | Renal Donors | PET-CT | CT Urography |
|---|---|---|---|---|
| Number (n) | 950 | 1250 | 120* | 24 |
| Age (years) | 57.9±8.5 (31-94) | 45.1±12.5 (18-76) | 57.6±15.3 (20-87) | 57.2±18.6 (22-79) |
| Men (n) | 447 | 498 | 44 | 18 |
| Women (n) | 503 | 752 | 76 | 6 |
| Number included (n) | 922 | 1207 | 114 | 23 |
| Number excluded (n) | 28 | 43 | 6 | 1 |
| Number used for training (n) | 0 | 0 | 114 | 23 |
| Number used for testing (n) | 922 | 1207 | 0 | 0 |
Data for age are mean+/−standard deviation (range).
From 89 unique patients having 1-4 scans each.
Figure 1.
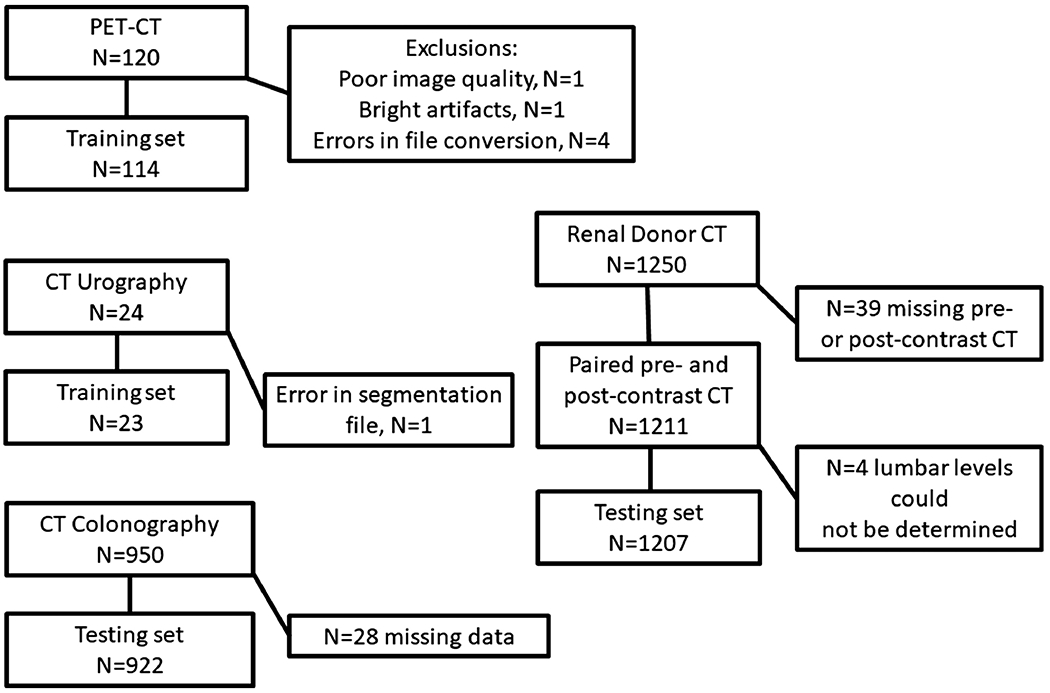
STARD Chart showing patient flow.
CT Study Protocols
The CT colonography data set was previously described (3). The patients underwent bowel cleansing and were administered oral contrast agent. The renal donor patients underwent multiphase abdominal CT including the intravenous administration of iodinated contrast agent. The CT scans performed as part of the PET/CT were done using low-dose technique without either intravenous or oral contrast. CT urography scans were part of a multiphase abdominal examination. Only the delayed phase CT urography images were used. Scan protocols are further described in Table 2.
Table 2.
CT scan characteristics
| Dataset | CTC | Renal Donors | PET-CT | CT Urography |
|---|---|---|---|---|
| Scanner manufacturer | GE Medical Systems | GE Medical Systems | GE Medical (112); Siemens (8) | Siemens(19), Other (5) |
| kVp | 120 | 100-140 | 120 | 100-120 |
| Slice thickness (mm) | 1.25 | 5 | 3 | 2 |
| Reconstruction interval (mm) | 1 | 3 | 3 | 1 |
| IV contrast present (n) | 0 | 1250 | 0 | 24 |
| IV contrast absent (n) | 950 | 1250 | 120 | 0 |
Note: A small number of scans had other source image slice thicknesses, reconstruction intervals, and kVp settings.
Data preparation
The CT scans, originally in DICOM format, were converted to NIFTI volumes. The CTC and renal donor scans were retrospectively reformatted to 3 mm slice thickness. Scan information was extracted from the DICOM headers using an automated script. Scan information and plaque detections results were organized and analyzed in a relational database (Access V2016, Microsoft, Redmond, WA). Only axial CT images were analyzed; sagittal images are shown for illustrative purposes only.
Determination of lumbar anatomic landmarks
For the CTC dataset, the automated determination of abdominal atherosclerotic plaque burden was computed between the aortic hiatus and aortic bifurcation to correspond with a prior study (3). The slices containing the aortic hiatus and aortic bifurcation were determined fully automatically using a previously published body part regressor (6). To determine the output of the body part regressor that most closely corresponded to these slices, a radiologist (S.L., a radiologist with 8 years of experience reading abdominal CT) manually located these slices on 20 randomly selected CTC cases. The average body part regressor outputs for these slices on the 20 random CTC cases were then used to identify these slices on the remaining CTC scans.
The automated determination of abdominal atherosclerotic plaque burden for the renal donors dataset was computed between the mid L1 to mid L4 levels to correspond with prior studies (4, 7). The L4 level was used as a surrogate for the aortic bifurcation, which was the inferior extent of plaque measurement in Ref. (3).
For the renal donors dataset, the levels were determined using existing code for spine segmentation to roughly determine the L1 level and generate coordinates for a bounding box between T12-L5 (8). To refine this level and obtain the L4 level, the bounding box was fed into a multiclass 3D U-Net which was trained to segment and classify T12-L5. The 3D U-Net architecture used was a six class variant (9). The average heights of the L1 and L4 segmentations from the 3D U-Net were used. For the renal donor dataset, the levels were determined on the noncontrast scans. The matching levels on the post-contrast scans were determined using the scanner table position derived from DICOM data under the assumption that the patient did not move between scans. Image registration was not utilized.
Reference standard
The plaques on the CT part of 114 noncontrast low dose PET-CT scans were manually annotated by a radiologist (M.B., a radiologist with 23 years of experience reading abdominal CT) who used a locally-developed software tool. The software tool determined the Agatston score using the standard threshold of 130 HU (10). These scans were cropped to include only from the lower lung through the pelvis.
Preliminary results showed that the contrast-filled ureters on the delayed-phase post-contrast renal donor CT scans were frequently mistaken for aortic calcified plaques. To train the deep learning software to ignore the ureters, 23 CT urography scans were manually annotated by a radiologist (S.L., a radiologist with 8 years of experience reading abdominal CT) using 3D Slicer (V4.10.2, National Alliance for Medical Image Computing, Boston, MA, http://www.slicer.org/) (11). A higher threshold of 250 HU was used for labeling plaques in this dataset because the contrast in the aorta made it impossible to use 130 HU.
For the CTC dataset, the manual determination of abdominal atherosclerotic plaque burden was computed between the aortic hiatus and aortic bifurcation as described in Ref. (3). Briefly, a radiology resident (S.D.O, with 3 years of radiology research experience) used a semiautomated tool (V3D-Calcium Scoring; Viatronix, Stony Brook, NY) to retrospectively quantify the abdominal aortic calcified plaque. The user drew regions of interest around the vessel of interest on the supine axial images and the tool used a threshold of 130 HU and region growing algorithms to report the Agatston score.
Abdominal atherosclerotic plaque detection algorithm.
We first tested the 3D U-Net architecture developed by Çiçek et al. and modified by Isensee et al. for brain tumor segmentation (12, 13). We then tested a modified 3D U-Net architecture (14). This modified version contained additional first and last convolutional layers that included a 7x7x7 filter with 2x2x2 stride and 4 times as many filters in every other layer (14, 15). We found the modified model performed better. This is not surprising since it contains many more parameters (28.5 M vs 1.78 M). The modified model was used herein.
The choice of loss function is critical for small object / highly imbalanced segmentation, with traditional loss functions performing poorly (16). To ensure a gradient value when working with subvolumes that contain no plaque, a loss summing the false positive and false negative voxels was used. Previously this loss proved useful for subvolume-based vertebral segmentation (15). To ensure the segmentations were high quality, we added a generalized Dice loss which has previously been shown to be useful for small object segmentation in MRI (17, 18). In this context generalized Dice loss considers two classes (plaque and non-plaque voxels) and dynamically reweights these classes inversely to how often they appear in each subvolume. The loss function is described in more detail in the Supplemental Materials.
All images were resampled to 1x1x1 mm and clipped to −100 – 1000 HU. The size of the subvolumes was 128x128x128 mm. For each plaque in the ground truth, 32 augmented subvolumes were created. These subvolumes were created with random jitter (+/−16 pixels in each direction) around the center mass of each plaque label combined with a random rotation (+/− 30 degrees around a random axis). Additionally, about half the augmented versions were generated with small random elastic deformation. In addition, normal subvolumes without plaque were generated through random sampling of each image.
Altogether 47,659 sub volumes were generated, with 14,818 (31%) being empty subvolumes with no plaque. Out of these, 2,256 (~15%) were from urography cases. The urography subvolumes were sampled in a weighted manner during training so they occurred about equally as often as the nonurography cases. A small sample of 200 subvolumes was used as a validation set (this was only used to monitor the accuracy during training). Training was performed using the Adam optimizer with a batch size of 1 and ran for about 120,000 iterations. Group normalization (max group size 16) was used to help stabilize and speed up training. During training, the fraction of false positive voxels per image and standard one class Dice score in the validation set were monitored, and training was ended when these values plateaued.
Post-processing was done to reduce false positive detections on ribs. We employed a circular filter with radius 6 cm centered in each 2D CT slice. The filter removed all detections outside the circle. This assumes that the abdominal aorta is located near the center of the imaging volume, which is true in general for routine abdominal CT. The filter radius was chosen empirically to exclude the rib false positives without affecting the aortic true positives.
Images showing the CT scans with and without plaque detections were made using 3D Slicer (V4.10.2, National Alliance for Medical Image Computing, Boston, MA, http://www.slicer.org/) (11).
Statistical analysis
Linear regression was performed to compare plaque measured on the CT colonography dataset performed using the automated and manual assessments; and to compare the plaque measured automatically on the precontrast and post-contrast renal donor CT scans (Excel 2016, Microsoft, Redmond, WA; and MedCalc V16.4.3, MedCalc software, Ostend, Belgium). Confusion matrices were used to compare Agatston scores by groups for scores 0, >0 and <100, 100 to 300, >300 (Groups 0 to 3, respectively) (Access 2016, Microsoft, Redmond, WA). The inter-group agreement of the Agatston scores was assessed using quadratic weighted kappa (MedCalc V16.4.3, MedCalc software, Ostend, Belgium). P values ≤ 0.05 were considered significant. Reasons for false negatives and false positives were assessed visually from a random subset of 20 CTC cases and 20 renal donor cases.
Results
In the CTC dataset, plaque segmentation was successful in 97.1% (922/950) of the scans. A scatterplot comparing the manual and automated plaque scores is shown in Figure 2A. The slope of the linear regression was 0.84 [0.82, 0.85] and the intercept was −38 [−84, 8] HU (R2 = 0.94). The automated score underestimated the manual score by 16%. A Bland-Altman plot of the same data is shown in Figure 2B. An example plaque segmentation in the CTC dataset is shown in Figure 3A.
Figure 2.
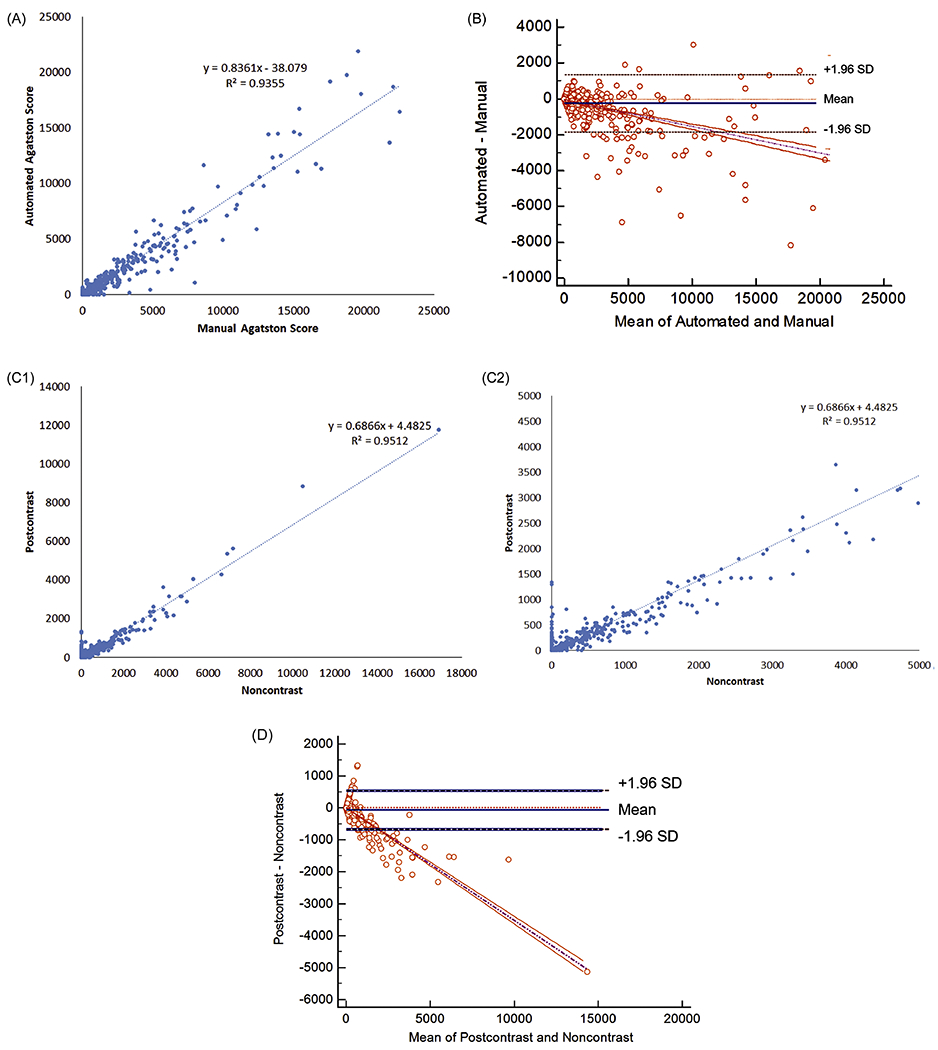
Agatston scores for CT colonography and renal donor datasets. (A, B) For CT colonography, comparison of Agatston scores for automated and manual assessments showing (A) linear regression and (B) Bland-Altman plots. (C, D) For renal donors, comparison of Agatston scores for noncontrast and post-contrast datasets showing (C) linear regression and (D) Bland-Altman plots. For (A, C), linear regression equation and R2 are shown. For (B, D), bias and 95% limits-of-agreement are shown. For (C), full and partial range of scores are shown.
Figure 3.
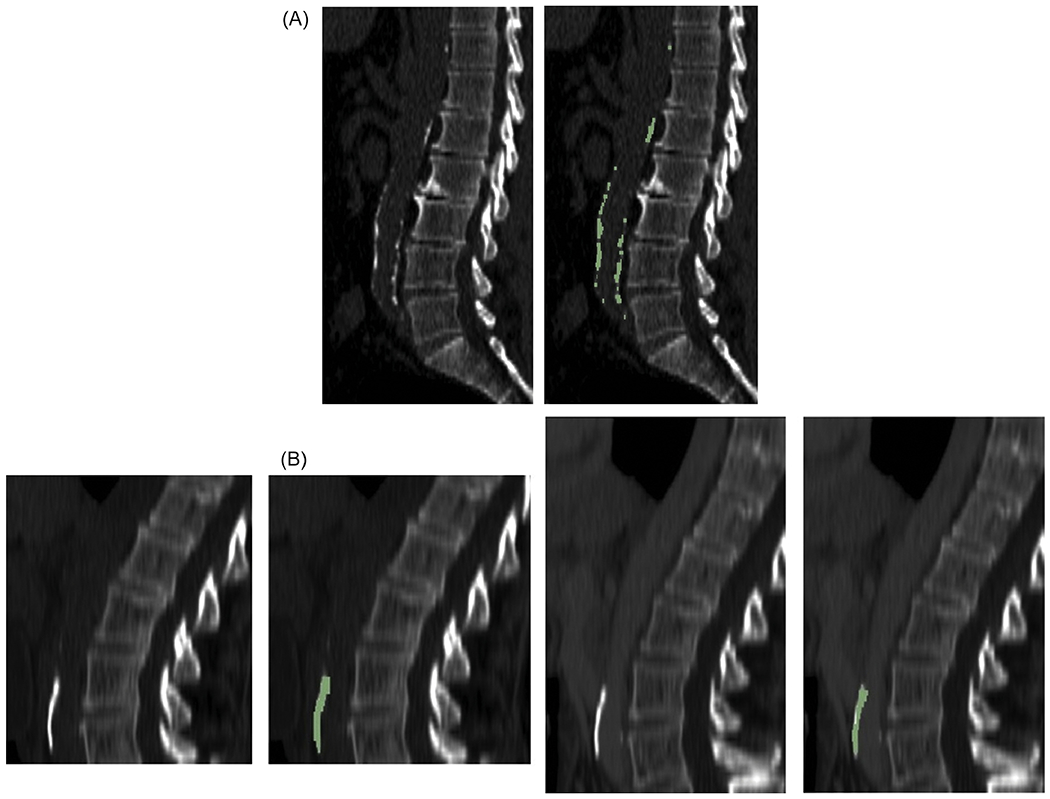
Examples of concordant plaque burden measurements on midline sagittal reformatted CT images. (A) 74 year old man in CT colonography dataset and (B) 62 year old woman in renal donor dataset. In (B), (left pair) noncontrast and (right pair) post-contrast images are shown. For each example, the images are shown without and with the automated detections (green). In (A), Agatston group 3 was recorded for both manual and automated measurements. In (B), Agatston group 3 was recorded for both automated noncontrast and post-contrast measurement.
Plaque segmentation was successful on both the noncontrast and post-contrast renal donor scans in 99.7% (1207/1211) of patients. A scatterplot comparing the automated noncontrast and post-contrast plaque scores is shown in Figure 2C. The slope of the linear regression was 0.69 [0.68, 0.70] and the intercept was 4.5 [−3.6, 12.6] HU (R2 = 0.95). The automated post-contrast score underestimated the automated noncontrast score by 31%. A Bland-Altman plot of the same data is shown in Figure 2D. An example plaque segmentation in the renal donor dataset is shown in Figure 3B.
For converting post-contrast plaque scores to noncontrast scores, the dependent and independent variables can be swapped. In this setting, the slope of the linear regression was 1.39 [1.37, 1.40] and the intercept was 5.2 [−6.3, 16.6] HU (R2 = 0.95) . For a linear regression in which the noncontrast and post-contrast plaque scores are zero in the setting of no plaque, the intercept can be set to zero; the slope of the linear regression was 1.39 [1.37, 1.40] .
Confusion matrices for Agatston score groupings are shown in Table 3. Plaque was more prevalent in the CTC dataset than in the renal donor dataset. This was expected because the patients in the CTC dataset were older (Table 1). In the CTC dataset, the automated plaque detector tended to underestimate the plaque group by assigning a lower group number. In the renal donor dataset, the automated plaque detector tended to overestimate the plaque group on the post-contrast scans for Group 0 on the noncontrast scans by assigning a higher group number. For inter-group agreement, weighted kappa was 0.80±0.01 [95% C.I.: 0.78 to 0.83] for the CTC dataset and 0.83±0.02 [0.79 to 0.86] for the renal donor dataset.
Table 3.
Confusion matrices for Agatston score groupings for CT colonography and renal donor datasets.
| CTC | Agatston Group Auto | Renal Donors | Agatston Group Auto Pre-contrast | |||||||
|---|---|---|---|---|---|---|---|---|---|---|
| Agatston Group Manual | 0 | 1 | 2 | 3 | Agatston Group Auto Post-contrast | 0 | 1 | 2 | 3 | |
| 0 | 85 | 8 | 2 | 1 | 0 | 731 | 43 | 3 | 1 | |
| 1 | 231 | 104 | 11 | 4 | 1 | 63 | 65 | 31 | 4 | |
| 2 | 20 | 40 | 52 | 7 | 2 | 35 | 4 | 35 | 37 | |
| 3 | 8 | 6 | 34 | 309 | 3 | 16 | 1 | 3 | 135 | |
Note: For CTC, scoring was measured from the diaphragm to the aortic bifurcation. For renal donors, scoring was measured from the mid L1 to mid L4 levels.
In the random subset of CTC cases, no false negatives were observed. The most common causes of false positive detections in the CTC dataset was bowel contents in one case. In the random subset of renal donor cases, the most common cause of false negatives was under-segmentation of plaque in eight cases. The most common causes of false positive detections in the renal donor dataset were on excreted contrast in the ureters in two cases. Example discordant plaque segmentations in the CTC and renal donor datasets are shown in Figure 4.
Figure 4.
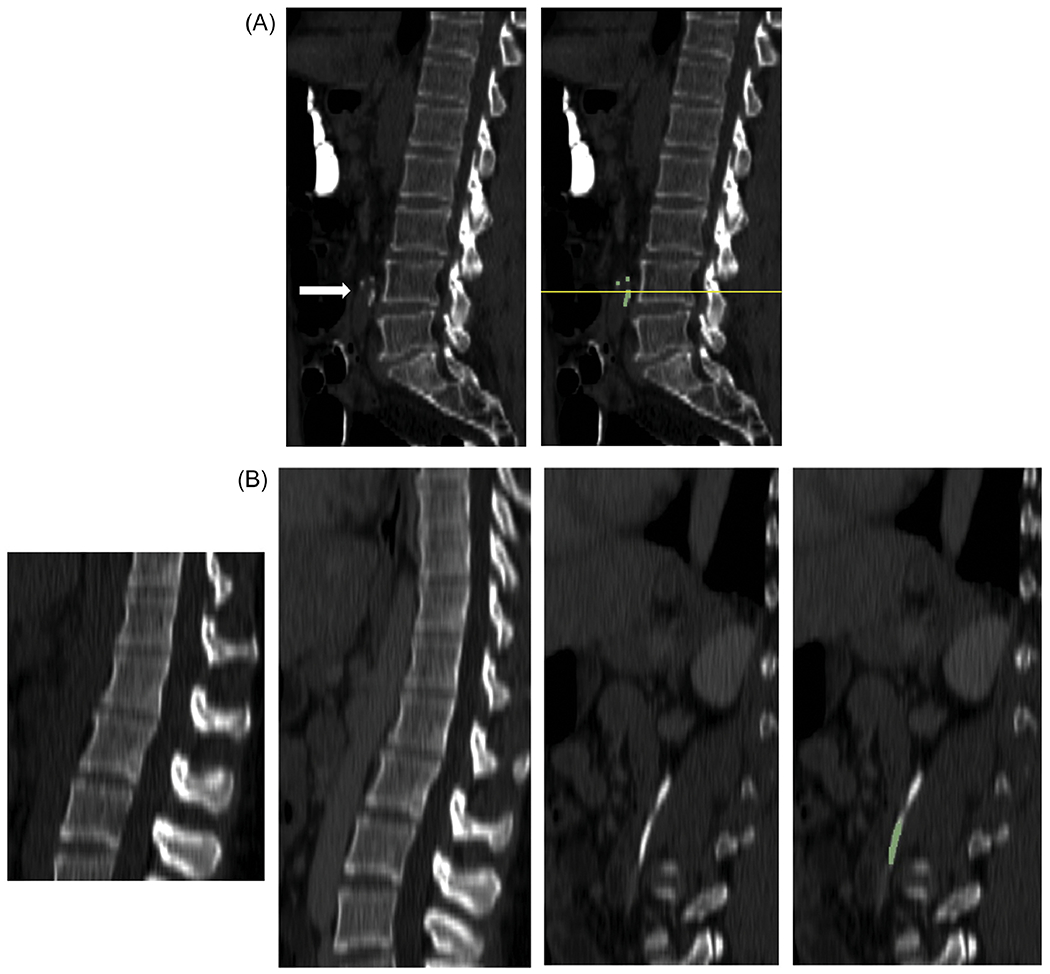
Examples of discordant plaque burden measurements on midline sagittal reformatted CT images. (A) 66 year old man in CT colonography dataset and (B) 33 year old woman in renal donor dataset. For the renal donor example, (far left) noncontrast and (right three) post-contrast images are shown. For each example, the images are shown without and with the automated detections (green). In (A), some detections occurred below the automatically-determined aortic bifurcation level (yellow line). Consequently, while the manual Agatston group was 3, the automated group was 2. In (B), false positive detections occurred on the left ureter; there are neither plaque nor detections on the aorta. Consequently, while the automated noncontrast Agatston group was 0, the automated post-contrast group was 3.
Discussion
In this paper, we found that, with a linear correction, a 3D-UNet deep learning method was able to accurately estimate Agatston scores on a large noncontrast CTC dataset with excellent agreement on Agatston score group. On the basis of nearly identical Bland-Altman analyses, the results on the CTC dataset were comparable to those reported on the same dataset using a more complex algorithm (7). Similarly, with a linear correction, the method was able to accurately estimate Agatston scores on a large post-contrast renal donor dataset with excellent agreement on Agatston score group compared to the corresponding noncontrast scan.
Because of the need for a linear correction, the method will be most useful for population analyses of plaque burden. For assessment of an individual patient, further work will need to be done to improve accuracy. For clinical verification in an individual patient, we envision a graphical display showing the original CT scan in axial, coronal and sagittal orientations with a colored overlay showing the detected plaques.
While there is much work on coronary plaque detection, there are far fewer works on extracoronary plaque detection. Examples include abdominal plaque assessment on CT colonography and for assessing ethnic-specific risks (19, 20). Extra-coronary plaques may be important associative biomarkers for disorders such as polyps of the colon (21), prostate cancer (22), and other types of cancer (23). In 2004, Isgum et al. reported a non-deep learning algorithm that detected plaques in 40 abdominal CT scans (24). In 2017, Liu et al. applied the faster region-based convolutional neural network (R-CNN) to pelvic plaque detection (25). An improvement on this method was gained on body CT by retraining with 10 pseudo-classes for false-positives (26, 27). A recent work used a Mask R-CNN to detect plaques in CT scans from 9,032 patients, demonstrating the utility of such methods for large scale association studies (7). Abdominal plaque burden assessed automatically has been shown to be predictive of cardiovascular morbidity and mortality (4).
It has been shown that the 3D versions of both the U-Net and Mask R-CNN perform better than 2D versions (i.e., single slice based) when applied to a lung lesion detection task (28). A variant of the 2D version, where several (seven) slices are fed into different channels, performed about the same as the fully 3D version for both the Mask R-CNN and U-Net (28). Thus, incorporating information from neighboring slices seems to be key.
For the task of measuring plaque on post-contrast scans, Zhu et al. used a generative adversarial network (GAN) to convert a post-contrast scan to a noncontrast scan (29). Zhu’s method preserved the plaque shape and CT attenuation better than an alternative GAN-based method (14).
We do not yet know how important it is to distinguish an Agatston score of 10 (Group 1) from a score of 0 (Group 0) for the abdominal aorta. More research will need to be done in this area, particularly on how the definition of the plaque groups affects clinical utility.
The plaque detector, trained on low dose PET-CT scans, generalized well to low dose CTC scans and routine dose renal donor CT scans. In addition, it generalized well to the range of slice thicknesses used in the different datasets. This is beneficial because unlike coronary CT, abdomen CT is done for a variety of indications using a variety of techniques.
Plaque undersegmentation was particularly problematic for the post-contrast scans. This is due to difficulty finding the edge between the plaque and high attenuation enhanced blood. Potential reasons for this difficulty include volume averaging artifact, scatter or pseudoenhancement due to the iodine in the lumen, the higher threshold used for the CT urography training cases, and differences in kVp. A higher threshold can reduce plaque scores substantially (30).
This study has several limitations. On noncontrast CTC scans, the plaque detector tended to underestimate the plaque group, and on post-contrast renal donor scans tended to overestimate the lowest plaque group. These under- and overestimates could either cancel out or compound in complex ways, leading to inaccuracies. Plaque undersegmentation will need to be addressed in future improvements to the method. The renal donor scans sometimes had different kVp settings on the pre- and post-contrast scans. This could lower Agatston scores on the scan with higher kVp. This study, like most coronary plaque studies, assessed only calcified plaque. Measurement of non-calcified plaque may be clinically useful, but is more challenging.
In summary, we showed that abdominal atherosclerotic plaque burden can be assessed accurately and automatically on both noncontrast and post-contrast scans. Plaque burden assessed automatically may have utility for population-based assessment of abdominal atherosclerotic disease.
Supplementary Material
Key Results:
On non-contrast CT colonography scans, automated atherosclerotic plaque burden scores showed excellent agreement with manual scores (R2 = 0.94, weighted kappa 0.80±0.01 [95% C.I.: 0.78 to 0.83]).
On paired non-contrast and post-contrast abdominal CT scans, automated atherosclerotic plaque burden scores showed excellent agreement (R2 = 0.95, weighted kappa 0.83±0.02 [0.79 to 0.86]).
Acknowledgments
This research was funded in part by the Intramural Research Program of the National Institutes of Health, Clinical Center and National Heart, Lung and Blood Institute. The research used the high-performance computing facilities of the NIH Biowulf cluster.
Grant Support: The intramural research programs of the National Institutes of Health, Clinical Center, NIAMS and NCI, partially supported this work.
Potential financial interest.
Author RMS receives royalties from iCAD, Philips, ScanMed, PingAn, and Translation Holdings and has received research support from PingAn (CRADA) and NVIDIA (GPU card donations). PJP is an adviser or consultant for Zebra Medical Vision and Bracco Diagnostics, and shareholder in Cellectar, Elucent, and SHINE.
Footnotes
Publisher's Disclaimer: This is a PDF file of an unedited manuscript that has been accepted for publication. As a service to our customers we are providing this early version of the manuscript. The manuscript will undergo copyediting, typesetting, and review of the resulting proof before it is published in its final form. Please note that during the production process errors may be discovered which could affect the content, and all legal disclaimers that apply to the journal pertain.
References
- 1.Fernandez-Friera L, Penalvo JL, Fernandez-Ortiz A, et al. Prevalence, Vascular Distribution, and Multiterritorial Extent of Subclinical Atherosclerosis in a Middle-Aged Cohort: The PESA (Progression of Early Subclinical Atherosclerosis) Study. Circulation. 2015;131(24):2104–13. [DOI] [PubMed] [Google Scholar]
- 2.Nakamura E, Sato Y, Iwakiri T, et al. Asymptomatic Plaques of Lower Peripheral Arteries and Their Association with Cardiovascular Disease: An Autopsy Study. J Atheroscler Thromb. 2017;24(9):921–7. [DOI] [PMC free article] [PubMed] [Google Scholar]
- 3.O’Connor SD, Graffy PM, Zea R, Pickhardt PJ. Does Nonenhanced CT-based Quantification of Abdominal Aortic Calcification Outperform the Framingham Risk Score in Predicting Cardiovascular Events in Asymptomatic Adults? Radiology. 2019;290(1):108–15. [DOI] [PubMed] [Google Scholar]
- 4.Pickhardt PJ, Graffy PM, Zea R, et al. Automated CT biomarkers for opportunistic prediction of future cardiovascular events and mortality in an asymptomatic screening population: a retrospective cohort study. Lancet Digital Health. 2020;2(4):E192–E200. [DOI] [PMC free article] [PubMed] [Google Scholar]
- 5.Banerjee S, Bagheri M, Sandfort V, et al. Vascular calcification in patients with large-vessel vasculitis compared to patients with hyperlipidemia. Semin Arthritis Rheum. 2019;48(6):1068–73. [DOI] [PMC free article] [PubMed] [Google Scholar]
- 6.Yan K, Lu L, Summers RM. Unsupervised body part regression via spatially self-ordering convolutional neural networks. 2018 IEEE 15th International Symposium on Biomedical Imaging (ISBI 2018): IEEE, 2018; p. 1022–5. [Google Scholar]
- 7.Graffy PM, Liu J, O’Connor S, Summers RM, Pickhardt PJ. Automated segmentation and quantification of aortic calcification at abdominal CT: application of a deep learning-based algorithm to a longitudinal screening cohort. Abdom Radiol (NY). 2019;44(8):2921–8. [DOI] [PubMed] [Google Scholar]
- 8.Yao J, O’Connor SD, Summers RM. Automated spinal column extraction and partitioning. 2006 3rd IEEE International Symposium on Biomedical Imaging: From Nano to Macro - Proceedings 2006; p. 390–3. [Google Scholar]
- 9.Elton D, Sandfort V, Pickhardt PJ, Summers RM, Hahn HK, Mazurowski MA. Accurately identifying vertebral levels in large datasets. Medical Imaging 2020: Computer-Aided Diagnosis 2020. [Google Scholar]
- 10.Agatston AS, Janowitz WR, Hildner FJ, Zusmer NR, Viamonte M, Detrano R. Quantification of coronary artery calcium using ultrafast computed tomography. Journal of the American College of Cardiology. 1990;15(4):827–32. [DOI] [PubMed] [Google Scholar]
- 11.Fedorov A, Beichel R, Kalpathy-Cramer J, et al. 3D Slicer as an image computing platform for the Quantitative Imaging Network. Magn Reson Imaging. 2012;30(9):1323–41. [DOI] [PMC free article] [PubMed] [Google Scholar]
- 12.Çiçek Ö, Abdulkadir A, Lienkamp SS, Brox T, Ronneberger O. 3D U-Net: learning dense volumetric segmentation from sparse annotation. International conference on medical image computing and computer-assisted intervention: Springer, 2016; p. 424–32. [Google Scholar]
- 13.Isensee F, Kickingereder P, Wick W, Bendszus M, Maier-Hein KH. Brain Tumor Segmentation and Radiomics Survival Prediction: Contribution to the BRATS 2017 Challenge. arXiv:180210508 [cs]. 2018. [Google Scholar]
- 14.Sandfort V, Yan K, Pickhardt PJ, Summers RM. Data augmentation using generative adversarial networks (CycleGAN) to improve generalizability in CT segmentation tasks. Sci Rep. 2019;9(1):16884. [DOI] [PMC free article] [PubMed] [Google Scholar]
- 15.Elton D, Sandfort V, Pickhardt PJ, Summers RM. Accurately identifying vertebral levels in large datasets. In: Hahn HK, Mazurowski MA, eds. Computer-Aided Diagnosis: SPIE, 2020; p. 23. [Google Scholar]
- 16.Sudre CH, Li W, Vercauteren T, Ourselin S, Jorge Cardoso M. Generalised Dice Overlap as a Deep Learning Loss Function for Highly Unbalanced Segmentations. In: Cardoso MJ, Arbel T, Carneiro G, et al. , eds. Deep Learning in Medical Image Analysis and Multimodal Learning for Clinical Decision Support. Cham: Springer International Publishing, 2017; p. 240–8. [DOI] [PMC free article] [PubMed] [Google Scholar]
- 17.Crum WR, Camara O, Hill DLG. Generalized Overlap Measures for Evaluation and Validation in Medical Image Analysis. IEEE Transactions on Medical Imaging. 2006;25( 11):1451–61. [DOI] [PubMed] [Google Scholar]
- 18.Sudre CH, Li W, Vercauteren T, Ourselin S, Cardoso MJ. Generalised Dice overlap as a deep learning loss function for highly unbalanced segmentations. arXiv: 170703237 [cs]. 2017;10553:240–8. [DOI] [PMC free article] [PubMed] [Google Scholar]
- 19.Davila JA, Johnson CD, Behrenbeck TR, Hoskin TL, Harmsen WS. Assessment of cardiovascular risk status at CT colonography. Radiology. 2006;240(1):110–5. [DOI] [PubMed] [Google Scholar]
- 20.Allison MA, Budoff MJ, Nasir K, et al. Ethnic-specific risks for atherosclerotic calcification of the thoracic and abdominal aorta (from the Multi-Ethnic Study of Atherosclerosis). Am J Cardiol. 2009;104(6):812–7. [DOI] [PMC free article] [PubMed] [Google Scholar]
- 21.Correa P, Strong JP, Johnson WD, Pizzolato P, Haenszel W. Atherosclerosis and polyps of the colon. Quantification of precursors of coronary heart disease and colon cancer. Journal of Chronic Diseases. 1982;35(5):313–20. [DOI] [PubMed] [Google Scholar]
- 22.Hager M, Mikuz G, Bartsch G, Kolbitsch C, Moser PL. The association between local atherosclerosis and prostate cancer. BJU International. 2007;99(l):46–8. [DOI] [PubMed] [Google Scholar]
- 23.Budczies J, von Winterfeld M, Klauschen F, et al. Comprehensive analysis of clinicopathological data reveals heterogeneous relations between atherosclerosis and cancer. Journal of Clinical Pathology. 2014;67(6):482–90. [DOI] [PubMed] [Google Scholar]
- 24.Isgum I, van Ginneken B, Olree M. Automatic detection of calcifications in the aorta from CT scans of the abdomen - 3D computer-aided diagnosis. Acad Radiol. 2004; 11(3):247–57. [DOI] [PubMed] [Google Scholar]
- 25.Liu J, Lu L, Yao JH, Bagheri M, Summers RM. Pelvic Artery Calcification Detection on CT Scans Using Convolutional Neural Networks. SPIE Medical Imaging 2017: Computer-Aided Diagnosis 2017; p. 101341A. [Google Scholar]
- 26.Liu J, Yao J, Bagheri M, Summers RM. A semi-supervised CNN learning method with pseudoclass labels for vascular calcification detection on low dose CT scans. In: Hahn HK, Mori K, eds. Computer-Aided Diagnosis: SPIE, 2019; p. 57. [Google Scholar]
- 27.Liu J, Yao J, Bagheri M, Sandfort V, Summers RM. A Semi-Supervised CNN Learning Method with Pseudo-class Labels for Atherosclerotic Vascular Calcification Detection. 2019 IEEE 16th International Symposium on Biomedical Imaging (ISBI 2019) 2019; p. 780–3. [Google Scholar]
- 28.Jaeger PF, Kohl SAA, Bickelhaupt S, et al. Retina U-Net: Embarrassingly Simple Exploitation of Segmentation Supervision for Medical Object Detection. arXiv: 181108661 [cs]. 2018. [Google Scholar]
- 29.Zhu Y, Elton DC, Lee S, Pickhardt PJ, Summers RM. Image Translation by Latent Union of Subspaces for Cross-Domain Plaque Detection. Proceedings of Medical Imaging with Deep Learning and arXiv preprint arXiv:200511384. 2020:1–5. [Google Scholar]
- 30.Glodny B, Helmel B, Trieb T, et al. A method for calcium quantification by means of CT coronary angiography using 64-multidetector CT: very high correlation with Agatston and volume scores. Eur Radiol. 2009;19(7):1661–8. [DOI] [PubMed] [Google Scholar]
Associated Data
This section collects any data citations, data availability statements, or supplementary materials included in this article.