Abstract
The information processing mechanism of the visual nervous system is an unresolved scientific problem that has long puzzled neuroscientists. The amount of visual information is significantly degraded when it reaches the V1 after entering the retina; nevertheless, this does not affect our visual perception of the outside world. Currently, the mechanisms of visual information degradation from retina to V1 are still unclear. For this purpose, the current study used the experimental data summarized by Marcus E. Raichle to investigate the neural mechanisms underlying the degradation of the large amount of data from topological mapping from retina to V1, drawing on the photoreceptor model first. The obtained results showed that the image edge features of visual information were extracted by the convolution algorithm with respect to the function of synaptic plasticity when visual signals were hierarchically processed from low-level to high-level. The visual processing was characterized by the visual information degradation, and this compensatory mechanism embodied the principles of energy minimization and transmission efficiency maximization of brain activity, which matched the experimental data summarized by Marcus E. Raichle. Our results further the understanding of the information processing mechanism of the visual nervous system.
Keywords: Visual nervous system, Visual information processing mechanism, Degradation mechanism, Edge features, Convolution algorithm
Introduction
With the implementation of brain projects across the world, such as Human Brain Project (HBP) in Europe (Markram 2012), Brain Research through Advancing Innovative Neurotechnologies Initiative (BRAIN Initiative) in the USA (Bargmann and Newsome 2014) and Brain/Mapping by Innovative Neurotechnologies for Disease Studies (Brain/Mapping) in Japan (Okano et al. 2015), China has recently proposed a 15-year (2016–2030) brain project called “Brain Science and Brain-Inspired Intelligence” (Poo et al. 2016), with the aim to understand neural basis of cognitive functions, to develop brain-machine intelligence technologies and to develop effective approaches for early diagnosis/intervention of brain disorders.
Over recent years, visual system has gained great influence in the field of neuroscience and computer vision (CV) (Marblestone et al. 2016). As the most crucial source of human perception of the objective world (Gazzaniga et al. 2014), the research of visual information processing mechanisms can significantly further the exploration of biological vision and the development of CV and the related artificial intelligence (AI) research (Gaume et al. 2019; Qu and Wang 2017; Talebi et al. 2018).
In 1962, David Hubel and Torsten Wiesel discovered that neurons in the V1 responded to specific simple features in the visual environment, and they also found simple cells and complex cells (Hubel and Wiesel 1962). Topologically, the simple cells of V1 are used to detect the edge of the image (Gazzaniga et al. 2014). Neocognitron, which was proposed by Fukushima (1980), is a hierarchical multi-layer neural network composed of S-cells and C-cells and inspired by the function of these neurons. S-cells are similar to the receptive field (RF) of simple cells for feature extraction, and C-cells correspond to the activation function. On the basis of the principle of neocognitron, LeCun et al. (2015, 1989) have used the spatial structure relationship to reduce the learning parameters and improve the training efficiency of the backpropagation algorithm, thus generating convolutional neural network (CNN). CNN is a kind of artificial neural network (ANN) and is one of the most typical and successful examples of biological inspiration. It draws on the characteristics of edge detection and orientation selection of RFs in primary visual cortex; that is, the cellular response of RFs in V1 in its optimal orientation is the strongest after the influence of the visual environment features (Lamti et al. 2019). By pooling capabilities from multiple simple cells for different preferred orientations, the complex cells in V1 remain spatially invariant (Kriegeskorte 2015). The overall architecture of CNN is similar to the visual cortical ventral pathway, which is a grade processing structure of LGN-V1-V2-V4-IT. CNN is widely applied to CV; thus, the research on visual system not only provides an intelligent basis for grasping and understanding the information processing mechanism of visual nervous system but also makes a breakthrough progress for CV.
Over the past few decades following the development of neuroscience, an increasing number of scientists have focused on researching the visual information processing mechanisms. As early as 1962, 1971 and 1982, Hubel and Wiesel (1962), Zeki and Dubner (1971) and Marr et al. (1982) have experimentally studied the visual systems and visual areas from V1 to MT, proposing a series of visual computation theories. Between 1996 and 2009, Shou et al. (2010) discovered the genetic properties of the orientation and direction sensitivity of LGN, V1 and MT, and confirmed the biological characteristics of cross fusion of two visual pathways. This discovery was a basis for further research on the neural mechanisms. In 2014, Joukes et al. (2014) proposed a recurrent motion model (RMM) based on the response characteristics of cell preferred orientation in MT, which can predict the perception of cell motion characteristics. However, there was still not enough experimental data to elucidate the neural mechanisms underlying the cell motion characteristics in MT. In 2015, Xiao and Huang (2015) discovered the distinguishing characteristics of the complex directions of MT nerve cells, which was of great significance for the extraction of multiple motion directions. In short, although there have been a large number of theories and discoveries generated by neuroscience experiments or computational models, there is still no consensus among the academic community on a theory that could explain biological visual information processing mechanisms. There is unlimited information available from the objective world, but in visual nervous system, only about 1010 bits/s are deposited in the retina, which from neurobiological point of view can be translated as about 1 million axons in each nerve. Due to this limited number of axons in the optic nerves, only about 6 × 106 bits/s leave the retina and only 104 bits/s can get to V1 (Raichle 2010). These data clearly show that the visual cortex receives an impoverished representation of the world (Peters et al. 2017). The aim of the current study was to identify the mechanisms underlying visual information processing, and to learn how the visual cortex of the brain interprets and responds to this impoverished representation in predicting the environment needs.
In short, the mechanisms of visual information degradation when reaching V1 and after entering the retina are still unclear. A common view in the field of visual neuroscience is that the essence of visual information processing is both parallel processing and hierarchical processing, which include feed-forward and feedback processing (Shou 2010). The rapid acquisition of image information from the messy objective world is also related to the visual attention mechanism (Fan et al. 2017; Parhizi et al. 2018). Regardless of the top-down or bottom-up processes, the visual information on the photoreceptor is not affected. When the visual information leaves the photoreceptor, it begins to degrade (Ji et al. 2019; Raichle 2010). Attention to neurons modulation is mainly recorded in V4 and above, while almost no attention modulation is recorded in V1 and V2. The stronger attention modulation occurs at the higher visual area (Anderson et al. 2013; Kumar et al. 2019; Zhang et al. 2019). As is well known, CNN is inspired by the biological vision system; therefore, in order to study the information processing of biological vision system from the retina to V1, we focused on the significant degradation of visual information flow transmission, drawing on the concept of convolution in CNN, and proposing an edge detection model based on retina to V1 (EDMRV1). In the current study, the first layer of EDMRV1 draws on that of CNN, which is used to characterize the photoreceptor in the retina and can modulate dark or optical signals. Then the model makes the algorithm of convolution among the signals of dark/light adaptation, RFs of the ganglion cells in the retina, RFs of LGN and RFs of V1. Accordingly, the model of EDMRV1 is constructed based on the information processing order from retina to V1, where it simulates the main function from retina to V1, that is, the image edge detection processing. This model, in turn, reflects the edge detection functional channel of retina to V1 and visualizes it. In EDMRV1 model, complex cells are not modeled separately, since there is no apparent antagonistic area in their RFs. Complex cells are similar to simple cells, given that the RFs of complex cells identify the orientations as well. However, there is no strict requirement for the locations. Some studies have shown that the functional classification between simple and complex cells is alterable, and their functions can sometimes be transformed into each other (Shou 2010).
The final simulation experiment results in the current study showed that the visualized image of the EDMRV1 model exhibited the information processing of the edge detection functional channel from retina to V1. It appeared extremely sensitive to the light/dark response due to the central-peripheral antagonism of RFs of the ganglion cells in the retina and LGN, which was consistent with a previous study (Curcio and Allen 1990). The contrast between light and dark is regarded as the feature of the image, and the visual information is significantly degraded with the transmission of the signals, which improves the efficiency of visually extracting the image features.
The EDMRV1 model presented in this paper explains the mechanism of visual information degradation in biological visual image information processing and draws two conclusions: (1) in biological vision, image information is transmitted from the photoreceptor in the retina to V1, and the information processing method of the image edge detection channel is similar to the model herein presented. This conclusion can be explained by the EDMRV1 model presented in this paper, which is to say, that the RFs of the ganglion cells extract the image signal, and then transmit it to the RFs of LGN, which finally reaches the RFs of V1 for processing. The RFs data transmission between different grades uses the series connection, confirming the hierarchical hypothesis of the primary visual cortex proposed by Hubel and Wiesel (1962), and is implemented by convolution calculation. As a result, this efficiently detects the image edge received on the photoceptor while greatly degrading the amount of data, which is consistent with the experimental data reported by Raichle (2010). (2) There is a method similar to convolution calculation in the neural information processing mechanisms of biological vision used to extract the edge features of the image. Finally, the EDMRV1 model supports hierarchical processing in which visual information processing includes both parallel and hierarchical processing, i.e. the edge detection channel of multi-functional channels such as color, shape, contour, motion, and stereopsis of visual information processing is gradually processed by photoreceptors, ganglion cells, LGN, simple cells and complex cells of V1.
Model of retina to V1 establishment
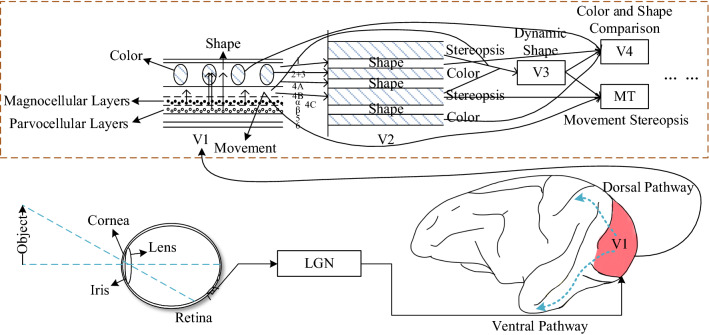
The visual system is the most important sensory system in humans and animals and is mainly composed of the retina, LGN and visual cortex (Deen et al. 2017). When the brain recognizes an object through the visual system, it perceives the edge information of the object. The edge detection is included in many functional channels such as color, shape, contour, motion, and stereopsis of visual information processing, as shown in Fig. 1.
Fig. 1.
Functional channels of visual information processing (redrawn from the reference (Shou 2010))
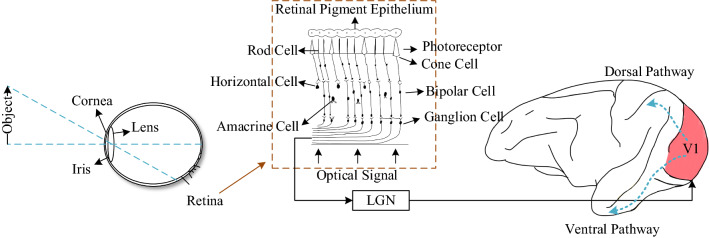
The primary visual pathway consists of retina, LGN, and V1. As the only output unit of the retina, the ganglion cells first transmit the image signal to the LGN for processing, and then pass it to V1, which is the initial topological mapping area of LGN’s axon (Gazzaniga et al. 2014). The role of the primary visual pathway is to perceive a large amount of static information and to process the edge signals of the image (Zhu et al. 2018). Thus, the functional channel of edge information processing consists of the primary visual pathway in visual system (Fig. 2).
Fig. 2.
Edge detection channel of visual information processing (redrawn from the reference (Shou 2010))
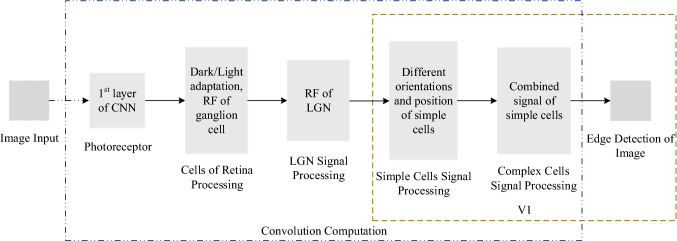
According to the above description of the functional channel of the edge detection, in this work, an EDMRV1 model for visual image edge detection was established based on the information processing method and the topological mapping relationship of image edge detection from the retina to V1. The block diagram of function is shown in Fig. 3.
Fig. 3.
Block diagram of information processing of EDMRV1 model
As shown in Fig. 1, the image of the objective world is transmitted to retina as a signal input, and after the retina receives the optical signals transmitted by the lens, the photopigment on the photoreceptor is decomposed. The electric current flow around the photoreceptor is changed. These series of changes trigger the action potential of downstream neurons; thus, the photoreceptor converts the optical signal into the bioelectrical signal, i.e. its biological characteristic.
Inspired by CNN from neuroscience research and the characteristics of retinal sensory cells (Marblestone et al. 2016), in the current work, we used the first layer of CNN to characterize the photoreceptor on the retina and to receive image signals. The image signal reaches the convolution layer, and then passes it through the outer segment of the photoreceptor, which includes the rod photoreceptor and the cone photoreceptor, after which these two adjust the sensitivity of the image brightness to achieve visual brightness adaptation consisting of dark adaptation (DA) and light adaptation (LA).
When the signals are weak, which occurs during the DA process, the visual threshold changes to adapt to the dark environment (Owsley et al. 2016). The functional changes of cones and rods in the DA process are shown in Fig. 4. When the signals are strong, which occurs during the LA process, the visual threshold changes to adapt to the light environment (Vinberg et al. 2018). The functional changes of cones in the LA process are shown in Fig. 5.
Fig. 4.
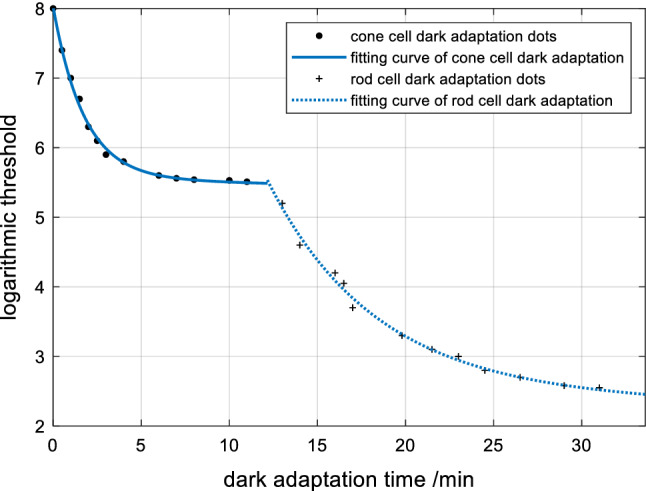
Dark adaptation curve of cones and rods
Fig. 5.
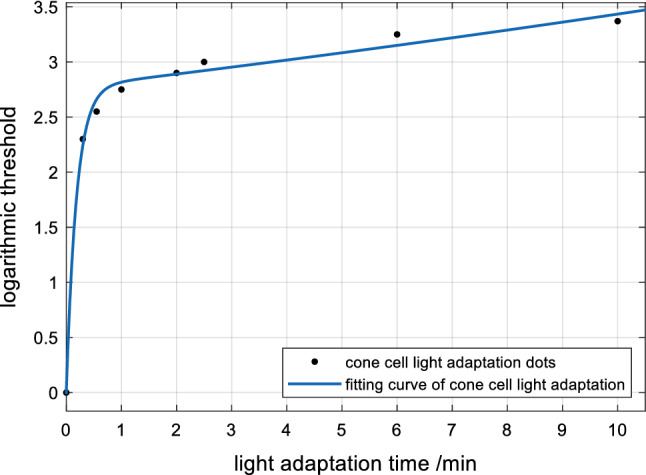
Light adaptation curve of cones
Figure 4 shows that the DA process of cones ranges from 0 to 12.16 s, thus indicating that the sensitivity of cones is first adjusted at this time. The function of rods begins to change, and the sensitivity starts to improve from 12.16 s. The sensitivity of photoreceptors to light is reciprocal to the threshold (Shou 2010). If the sensitivity is η, then:
| 1 |
flt includes flt1, flt2, and flt3, which are shown as the following.
Fitting the DA process of cones and rods with an exponential function:
| 2 |
f1t1 (t) is the sensitivity curve of cones in the DA process; f1t2 (t) is the sensitivity curve of rods in the DA process. Respectively, the root mean square error (RMSE) is:
| 3 |
The time parameter t has a positive correlation with the sensitivity η, which is the ability of photoreceptor to recognize the darker image I1(i, j) = μ1. Through the DA process will get a processed image I2(i, j) = μ2, of which the corresponding sensitivity is η2; thus:
| 4 |
Figure 5 suggests that the LA process of the cones changes and the sensitivity of cones is adjusted at this time.
In the LA process of cones, fitting with an exponential function generates the following formula:
| 5 |
f1t3 (t) is the sensitivity curve of cons during the LA process. According to the above formula, the RMSE can be calculated as: e3 = 10.04%.
When the photoreceptor recognizes a lighter image, the time parameter t has a negative correlation with the sensitivity η, which is the ability to identify the lighter image I1(i, j) = μ1. Through the LA process will get a processed image I2(i, j) = μ2, of which the corresponding sensitivity is η2; thus:
| 6 |
Assuming that the I1 is a two-dimensional image, the image signal transmitted to the retinal pigment epithelium is adaptively adjusted by the DA and LA process of photoreceptor, and the processed image I2 is obtained, which is shown as the following:
| 7 |
After that, the I2 makes a convolution calculation with RFs of ganglion cells in retina. The DOG model is a two-dimensional kernel. After the pre-processing of retinal photoreceptor, the image signal is transmitted to RFs of ganglion cells as demonstrated by the following formula:
| 8 |
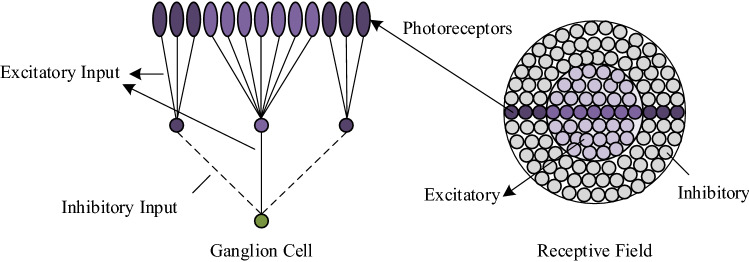
The structure of RF of On-center ganglion cell is shown in Fig. 6 (Gazzaniga et al. 2014). At the center area of RF, the inner circle of photoreceptors with the light generates higher frequency action potentials in ganglion cells; the outer circle of photoreceptors with the light inhibits frequency action potentials in ganglion cells. The central stimulation response and the peripheral stimulation response are mutually offset, so the ganglion cells are very sensitive to the difference in brightness in RFs. After that, photoreceptors on RFs transmit the signals to the ganglion cells.
Fig. 6.
Schematic diagram of RF structure of On-center ganglion cell
According to the schematic diagram of RF of ganglion cell from Fig. 6, it is composed of two concentric circles, where the small one represents a central mechanism with strong excitatory effects, and the big one represents a peripheral mechanism with weak inhibitory effects (Gazzaniga et al. 2014). These two circles have mutual antagonistic effects and the Gaussian distribution to each other. Therefore, the model of Rodieck, which is the difference of two Gaussians (DOG), can be used to describe these two concentric circles (Shou 2010).
| 9 |
| 10 |
In the Gaussian model of the small circle represented by DOG1, and the Gaussian model of the big circle represented by DOG2, kc represents the maximum sensitivity of the central area of RF, and ks represents the maximum sensitivity of the peripheral area of RF. rc and rs represent the radius with respect to the maximum sensitivity of the central area and the peripheral area drops to e−1, respectively. Accordingly, the DOG model is:
| 11 |
Formula (11) can be written as follows (Köppen et al. 2009):
| 12 |
A1 represents the sensitivity of the central area; A2, the sensitivity of the peripheral area. σ1 represents the RMSE of the Gaussian distribution function in the central area, σ2 represents the RMSE of the Gaussian distribution function in the peripheral area.
After the image information processing of RFs of ganglion cells, the signals are transmitted to LGN. Like RFs of ganglion cells, RFs of LGN is also divided into two central-peripheral antagonistic parts, which are the central area and the peripheral area, and have a similar structure and function (Gazzaniga et al. 2014). Hence, it can also be presented by the DOG model. The convolution calculation between image I3 and the model of RFs of LGN is image I4, which is shown as this following formula:
| 13 |
Finally, this image information is passed through the LGN to the simple cells of V1 for processing.
Simple cells respond strongly to specific orientations in specific spatial locations. That is, different simple cells have selective characteristics to different orientations and edge positions (Liu et al. 2010). Every simple cell has its preferred orientation, which has the strongest cellular response. The characteristics of simple cells with different orientations can be simulated as the two-dimensional Gabor function (Gu and Liang 2007), which is demonstrated as the following formula:
| 14 |
where
| 15 |
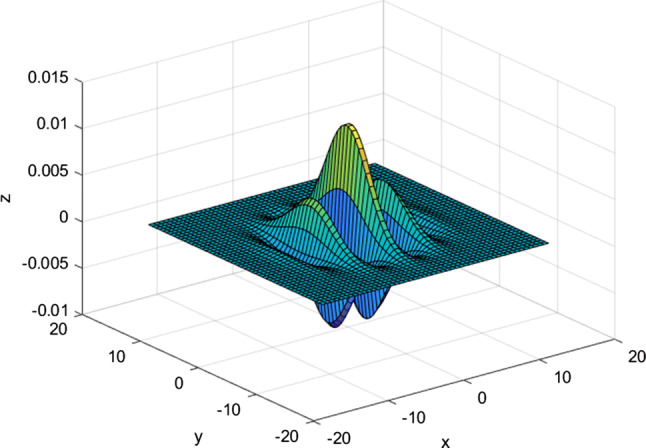
The formula (14) is the product of a Gaussian function and a cosine function where λ is the wavelength, which directly affects the filter scale of the filter. Commonly, θ is the direction of the filter. ψ is the phase shift of the tuning function,. γ is the ratio of spatial vertical to horizontal, which determines the shape of the filter. σ is the variance of the Gaussian filter.
Finally, simple cells processing with different preferred orientations are integrated to the final image information, in which the image information signals of complex cells come from simple cells with different positions in the same orientation (Ferrell 2011) which is equivalent to the abstraction of simple cells (Shou 2010). Since there is no clear antagonistic zone in RFs of complex cells, there are no strict requirements for position selection during orientation selection (Shou 2010). As long as the edge signal falls on RFs, it will cause the reaction in the complex cell, and the functions of simple cells and complex cells can be converted into each other. Therefore, the EDMRV1 does not model the complex cells separately. Schematic diagrams of simple cells and complex cells are shown in Fig. 7.
Fig. 7.
Schematic diagram of RF of simple cell and complex cell and their relationship
Finally, the processed image I is obtained:
| 16 |
Figure 8 is a schematic diagram of RFs of simple cells with preferred orientations of θ1 = 0°, θ2 = 45°, θ3 = 90°, and θ4 = 135°, respectively. Figure 9 is a schematic diagram of the Gabor model.
Fig. 8.
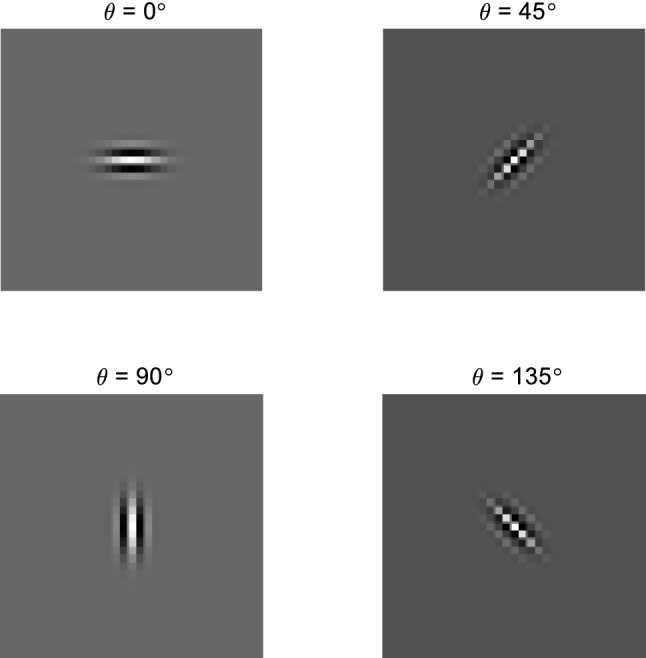
Schematic diagram of RFs of simple cells with 4 different preferred orientations
Fig. 9.
Schematic diagram of Gabor model
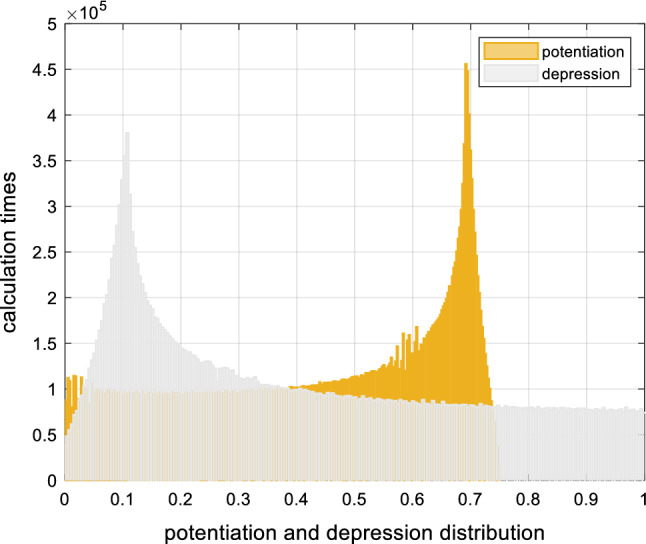
The connections between neurons are very complicated. In the EDMRV1 model we proposed, the connectivity of neurons in different RFs is related to spike timing-dependent plasticity (STDP) (Beyeler et al. 2013; Kim and Lim 2019; Rolfs 2009), that is, it has a pulse time-correlated plasticity. This connectivity is closely related to the orientation selectivity of RFs (Carver et al. 2008). The STDP mechanism consists of long-term potentiation (LTP) and long-term depression (LTD) (Gazzaniga et al. 2014). The relationship between the sequence of discharge of neurons and the strength of connection determines the detection of image edge information by cells of RFs:
-
In the edge area, the pre- and postsynaptic neurons produce synchronous and high-probability positive discharges under the action of LTP, thus producing an excitatory effect. At this point, the synaptic connections are constantly increased, which is represented by the following formula:
where potentiation(i, j) represents image edge decoding information after the LTP effect in STDP. synapse(i, j) represents the connection strength of the synapse. tpre < tpost indicates that neurons pre- and postsynaptic neurons are positively discharged.17 -
In the non-edge area, the pre- and postsynaptic neurons produce non-synchronous and high-probability non-positive discharges under the action of LTD, thus producing an inhibitory effect. At this point, the synaptic connections are constantly suppressed, which is represented by the following formula:
where depression(i, j) represents image edge decoding information after the LTD effect in STDP. tpre ≥ tpost indicates that neurons pre- and postsynaptic neurons are non-positively discharged.18
After the action of LTD and LTP, Fig. 10 indicates those distributions of weights as the following. The X-axis presents the results of potentiation(i, j) and depression(i, j). The Y-axis presents the calculation times, which means the higher value of the Y-axis indicates that the higher frequency of appearance of the corresponding x value.
Fig. 10.
Distribution of weights after STDP processing
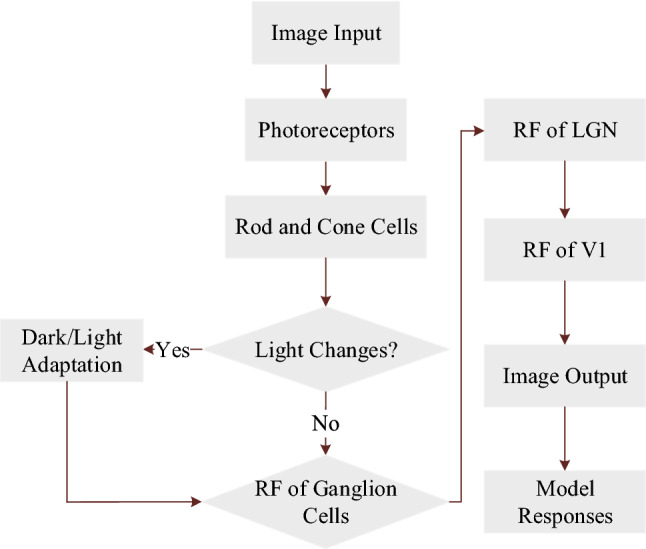
According to the above description, the image information processing flowchart of the EDMRV1 model is shown as the following Fig. 11:
Fig. 11.
Flowchart of EDMRV1 model
Simulations and results analysis
Environment of simulations and model parameter settings
This section uses simulation experiments to verify the proposed EDMRV1 model. The parameters of simulation experiments are illustrated in Tables 1 and 2:
Table 1.
Parameters of ganglion cells and LGN
| RFs of ganglion cells | RFs of LGN | ||||
|---|---|---|---|---|---|
| σ1 | σ2 | kernel | σ3 | σ4 | kernel |
| 0.90 | 1.00 | 3 × 3 | 0.40 | 1.00 | 3 × 3 |
Table 2.
Parameters of V1
| RFs of V1 | |||||||||||
|---|---|---|---|---|---|---|---|---|---|---|---|
| θ1 | λ1 | σ0° | θ2 | λ2 | σ45° | θ3 | λ3 | σ90° | θ4 | λ4 | σ135° |
| 0.00 | 2.00 | 0.50 | 45.00 | 2.00 | 0.50 | 90.00 | 2.00 | 0.50 | 135.00 | 2.00 | 0.50 |
Visualization of model outputs
According to the description of the EDMRV1 model, the following three different scenarios were taken as examples, and the EDMRV1 model is shown in Figs. 12, 13, 14, 15, 16 and 17. Due to the significant degradation of visual information after reaching V1, the experimental results were difficult to identify. Therefore, the brightness value of images recognized by the ganglion cells, LGN and V1 were reduced by 40%, and the contrast value was increased by 40%.
Fig. 12.
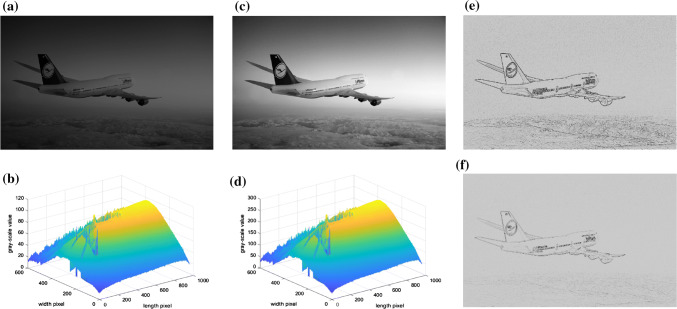
Airplane image in dark adaptation-ganglion cells-LGN processing. a Airplane image before dark adaptation processing of rods and cones. b Gray scale curve corresponding to image before dark adaptation processing. c Airplane image after dark adaptation processing of rods and cones. d Gray scale curve corresponding to image processing after dark adaptation of rods and cones. e Airplane image processing after RFs of ganglion cells. f Airplane image processing after LGN
Fig. 13.
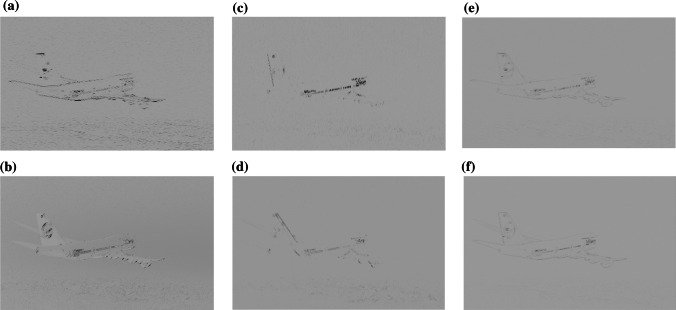
Airplane image processing after preferred orientation of V1 and EDMRV1 model responses. a Airplane image processing after the preferred orientation of V1 equals 0°. b Airplane image processing after the preferred orientation of V1 equals 45°. c Airplane image processing after preferred orientation of V1 equals 90°. d Airplane image processing after preferred orientation of V1 equals 135°. e Airplane image processing after four different preferred orientations of V1. f Airplane image output according to the EDMRV1 model responses
Fig. 14.
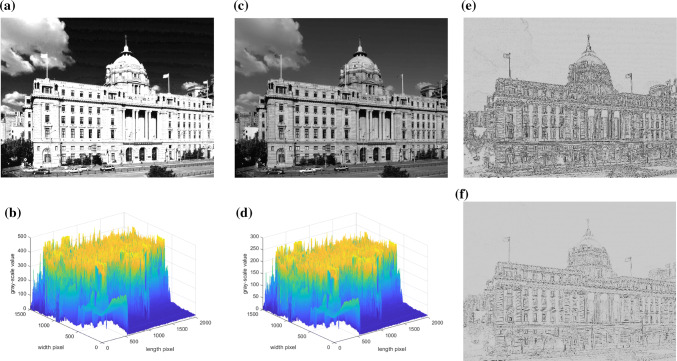
Building image in light adaptation-ganglion cells-LGN processing. a Building image before light adaptation processing of cones. b Gray scale curve corresponding to image before light adaptation. c Building image after light adaptation processing of cones. d Gray scale curve corresponding to image after light adaptation. e Building image processing after RFs of ganglion cells. f Building image processing after LGN
Fig. 15.
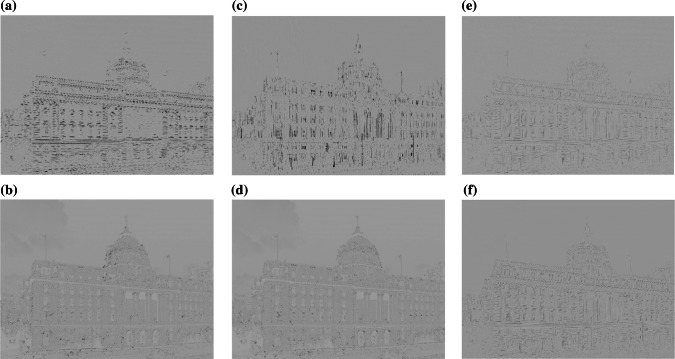
Building image processing after the preferred orientation of V1 and EDMRV1 model responses. a Building image processing after preferred orientation of V1 equals 0°. b Building image processing after preferred orientation of V1 equals 45°. c Building image processing after preferred orientation of V1 equals 90°. d Building image processing after preferred orientation of V1 equals 135°. e Building image processing after four different preferred orientations of V1. f Building image output according to the EDMRV1 model responses
Fig. 16.
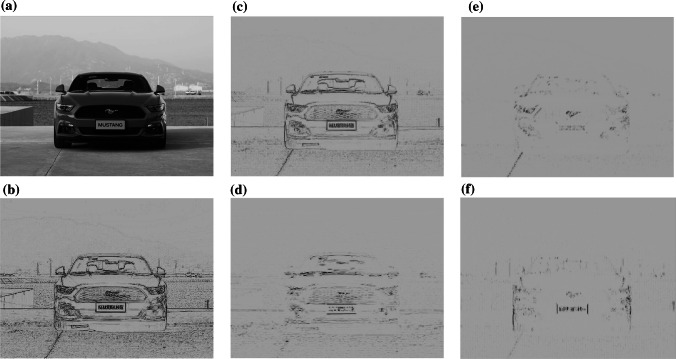
Sportscar image in ganglion cells-LGN-V1 processing. a Sportscar image input on retina. b Sportscar image processing after RFs of ganglion cells. c Sportscar image processing after LGN. d Sportscar image processing after preferred orientation of V1 equals 0°. e Sportscar image processing after preferred orientation of V1 equals 45°. f Sportscar image processing after preferred orientation of V1 equals 90°
Fig. 17.
Sportscar image after V1 processing and EDMRV1 model responses. a Sportscar image processing after preferred orientation of V1 equals 135°. b Sportscar image processing after four different preferred orientations of V1. c Sportscar image output according to the EDMRV1 model responses
Experiment of airplane
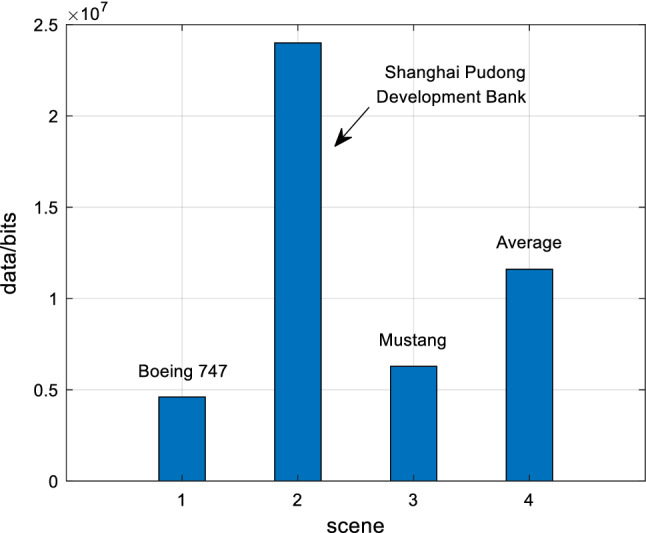
In this experiment, we took the Boeing 747 airplane in the dark as the first example. The picture’s resolution was 960 × 600, each pixel of the image was encoded in one byte. The corresponding gray-scale average value (GSAV) was grayairplane_average1 = 53.60, as shown in a and b of Fig. 12. When the retinal photoreceptors received the optical signals, the amount of data at this time was 4.61 × 106 bits. Subsequently, the DA process of rods and cones worked for t1 = 30 min, as shown in c of Fig. 12. The sensitivity of cones, which have dominant roles in the photoreceptors before ∆t = 12.16 s (from 0 to 12.16 s), was improved. Also, after ∆t = 12.16 s, rods have dominant roles in the photoreceptors, the sensitivity was improved, and corresponding GSAV increased to gray airplane_average2 = 133.98, as shown in d of Fig. 12. Subsequently, the image signal after the DA process was transmitted to RFs of the ganglion cells. Since these are very sensitive to the change of the light and dark, the edge information of the image could be detected; the image after the processing is shown in e of Fig. 12. Next, the image signals were transmitted to LGN (indicated in f of Fig. 12), at which point, the visual information of this image signals was 3.35 × 103 bits, which was about 7.27 × 10⁻⁴ times that of the retinal photoreceptors visual information. Simple cells with different preferred orientations θ were only related to the image information of the specific orientation, and could recognize the edge information of these orientations. The current paper has given four examples. Those respectively are, θ = 0°, 45°, 90°, and 135°. The processing images are shown in a-d of Figs. 13. The images of integrated information of these corresponding orientations are shown in e of Figs. 13. Finally, the signals from RFs of the ganglion cells and LGN were transmitted to V1. The image after RFs processing of V1 is shown in f of Figs. 13. The visual information at this time was 5.46 × 102 bits, which was 1.18 × 10⁻⁴ times that of retinal photoreceptors. From the experimental picture of Boeing 747, it can be seen that visual information significantly degraded from retina to V1 in our model.
Experiment of building
In this experiment, we took the Shanghai Pudong Development Bank building in the bright light as the second example. The picture’s resolution was 2000 × 1500, each pixel of the image was encoded in one byte. The corresponding GSAV was graybuilding_average1 = 165.68, as shown in a and b of Fig. 14. When the retinal photoreceptors received the optical signals, the amount of data at this time was 2.4 × 107 bits. Subsequently, the LA process of cones worked for t2 = 10 min, as shown in c of Fig. 14 The sensitivity of cones, which have dominant roles in the photoreceptors during the whole t2 = 10 min, was improved, the corresponding GSAV increased to gray building_average2 = 89.88, as shown in d of Fig. 14. Subsequently, the image signal after the LA process was transmitted to RFs of the ganglion cells, and the edge information of the image could be detected, as shown in e of Fig. 14. Next, the image signals were transmitted to LGN (described in f of Fig. 14), at which point, the visual information of this image signals was 2.11 × 105 bits, which was about 8.79 × 10⁻³ times that of the retinal photoreceptors visual information. Simple cells with different preferred orientations θ were only related to the image information of the specific orientation, and could recognize the edge information of these orientations. The current paper has given four examples. Those respectively are, θ = 0°, 45°, 90°, and 135°. The processing images are shown in a–d of Figs. 15. The images of integrated information of these corresponding orientations are shown in e of Fig. 15. Finally, the signals from RFs of the ganglion cells and LGN were transmitted to V1. The image after RFs processing of V1 is shown in f of Fig. 15. At this time, The visual information was 4.93 × 102 bits, which was 2.05 × 10⁻⁵ times that of retinal photoreceptors. From the experimental picture of Shanghai Pudong Development Bank, it can be seen that visual information significantly degraded from retina to V1 in our model.
Experiment of sportscar
In this experiment, we took the Mustang car in the changeless light environment as the third example. The picture’s resolution was 1024 × 768, each pixel of the image is encoded in one byte, as shown in a of Fig. 16. When the retinal photoreceptors received the optical signals, the amount of data at this time was 6.29 × 106 bits. Subsequently, the signals after the processing of rods and cones were transmitted to RFs of ganglion cells. RFs of ganglion cells are very sensitive to the change of the light and dark; thus the edge information of the image could be detected, and the image after the processing was as shown in b of Fig. 16. Next, the image signals were transmitted to LGN, which is shown in c of Fig. 16. At this time, the visual information of this image signals was 1.15 × 104 bits, which was about 1.82 × 10⁻³ times that of the retinal photoreceptors visual information, and was a significant degradation of these data. Simple cells with different preferred orientations θ were only interested in the image information of the specific orientation, and can recognize the edge information of these orientations. The current paper has given four examples. Those respectively are, θ = 0°, 45°, 90°, and 135°. The images of the processing are shown in d-f of Figs. 16 and a of Fig. 17. The image of the integrated information of these corresponding orientations is shown in b of Fig. 17. Finally, the signals from RFs of the ganglion cells and LGN were transmitted to V1. The image after RFs processing of V1 is shown in c of Fig. 17. The visual information was 8.87 × 102 bits at this time, which was 1.41 × 10⁻⁴ times that of retinal photoreceptors. From the experimental picture of Mustang, it can be seen that visual information of this image significantly degraded from retina to V1 in our model.
Model simulation results and analyses
Based on the above experimental simulations of Boeing 747, Shanghai Pudong Development Bank and Mustang, the experimental data analysis of visual information of retinal photoreceptors in the EDMRV1 model were 4.61 × 106 bits, 2.40 × 107 bits and 6.29 × 106 bits, respectively. The average values were 1.16 × 107 bits, as shown in the above Fig. 18. Next, the visual information was transmitted to the model of RFs of ganglion cells and LGN for processing. At this time, the amount of visual information transmitted to LGN could be calculated, and were 3.35 × 103bits, 2.11 × 105bits and 1.15 × 104bits, respectively. In addition, the average values were 7.53 × 104bits, as shown in Fig. 19. Finally, the amount of processed visual information transmitted to V1 by LGN were 5.46 × 102bits, 4.93 × 102bits and 8.87 × 102bits, respectively, and the average was 6.42 × 102bits, which is shown in Fig. 20. The visual information changes of the EDMRV1 model information processing in these scenarios can be obtained by Figs. 18, 19 and 20, which is shown as the above Fig. 21 and Table 3. The visual information transmitted to LGN of these three scenarios were 7.27 × 10⁻⁴ times, 8.79 × 10⁻³ times and 1.82 × 10⁻³ times that of retinal photoreceptors, respectively. Moreover, the average was 3.78 × 10⁻³. The visual information transmitted to V1 were 1.18 × 10⁻⁴ times, 2.05 × 10⁻⁵ times and 1.41 × 10⁻⁴ times that of retinal photoreceptors, respectively, and the average was 9.32 × 10⁻⁵. These results were slightly different due to different test scenarios; nonetheless, the average data shown in Table 3, which are the degraded rate of LGN from retina and the degraded rate of V1 from retina, almost matched the experimental data reported by Raichle (2010), which respectively were 0.6 × 10⁻³ and 10−6 due to the characteristics of convolution and invariant features (Fukushima 1980). It can be seen that as the retinal photoreceptors sequentially transmit signals to RFs of ganglion cells and LGN, and then transmit signals to V1, the visual information amounts are significantly degraded. After processing, the image signals only retain the features with a very large difference between light and dark, and the edge signals of the image can be obtained.
Fig. 18.
Visual information of retinal photoreceptors
Fig. 19.
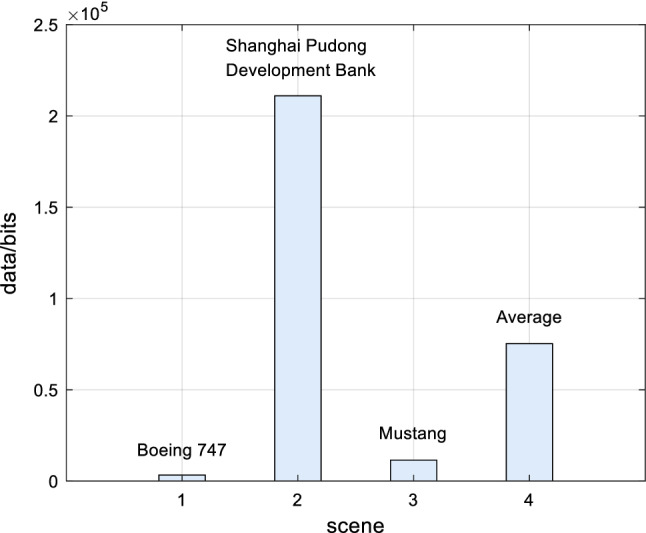
Visual information of LGN
Fig. 20.
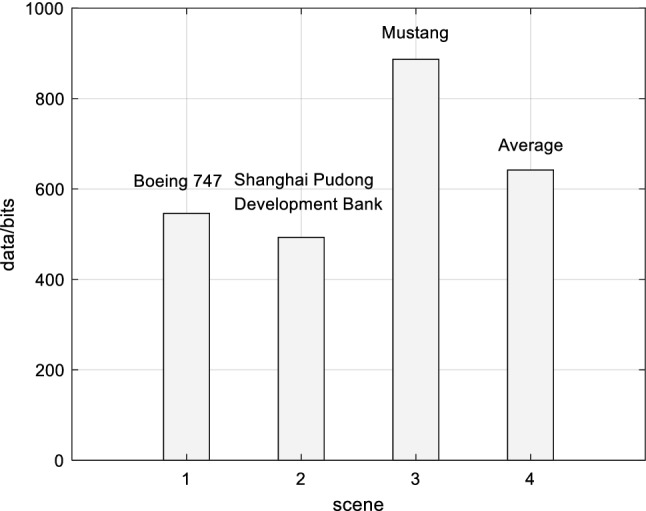
Visual information of V1
Fig. 21.
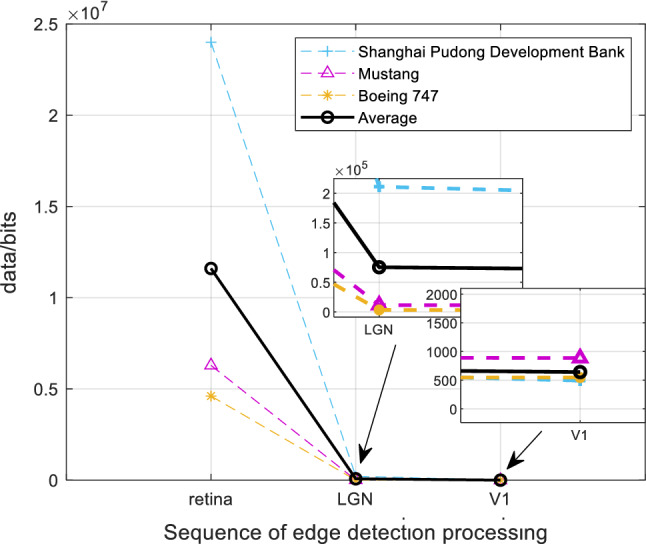
Visual information of retina to V1
Table 3.
Information degradation of EDMRV1 model information processing in three scenarios
| Scene\data | Retina/bits | LGN/bits | V1/bits | Degraded rate of LGN from retina | Degraded rate of V1 from retina |
|---|---|---|---|---|---|
| Boeing 747 | 4.61 × 10⁶ | 3.35 × 10³ | 5.46 × 10² | 7.27 × 10⁻⁴ | 1.18 × 10⁻⁴ |
| Shanghai Pudong development bank | 2.40 × 10⁷ | 2.11 × 10⁵ | 4.93 × 10² | 8.79 × 10⁻³ | 2.05 × 10⁻⁵ |
| Mustang | 6.29 × 10⁶ | 1.15 × 10⁴ | 8.87 × 10² | 1.82 × 10⁻³ | 1.41 × 10⁻⁴ |
| Average | 1.16 × 10⁷ | 7.53 × 10⁴ | 6.42 × 10² | 3.78 × 10⁻³ | 9.32 × 10⁻⁵ |
The EDMRV1 model in this paper describes the image edge detection functional channel of biological vision, based on the biology of retina to V1 in visual system. Whether the ganglion cell or LGN, their RFs are composed of two concentric antagonist circles, and the center and peripheral stimuli react with each other by offsetting. Therefore, they are very sensitive to the brightness difference of the image, and their main function is to extract the light or dark features from the image, and then obtain the edge information. After this, LGN transmits this information to V1, and the RFs of V1 are selected for their preferred orientations. It can be seen that during the process of light transmission from retina to V1, the pathway of photoreceptors-ganglion cells-LGN-V1 is used to extract the image edge information.
Conclusions
This paper examined the neural mechanisms underlying the degradation of the large amount of data from topological mapping from retina to V1, originating from the photoreceptors in visual system. We established an EDMRV1 model based on retina to V1, and quantitatively explained the neural information processing mechanisms, through which the visual information significantly degrades from topological mapping from retina to V1, based on the experimental data summarized by Marcus E. Raichle.
According to the characteristics of visual information transmission, the EDMRV1 model uses the first layer of CNN to characterize the retinal photoreceptors. After the light or dark signals are adjusted by light or dark adaptation, and the first layer successively calculates RFs of ganglion cells of retina, RFs of LGN and RFs of V1 are used with the convolutional algorithm to obtain the final image edge features. Therefore, the EDMRV1 model describes the edge detection function of retina to V1 and realizes the visualization.
Based on the obtained results, we came to two following conclusions: (1) When the external image information is transmitted from retinal photoreceptors to V1, the connection from the edge detection channel of the visual system is similar to the EDMRV1 model presented in this paper, so that the image features of retinal photoreceptors can be detected efficiently. This is also the first reason why significant degradation occurs in visual system. The transmission of visual information from RFs between different grades, which are the pathway of photoreceptors-ganglion cells-LGN-V1, uses the series connection, confirming the hierarchical hypothesis of the primary visual cortex proposed by Hubel and Wiesel. (2) When visual signals are in the processing of classification from low-level to high-level, there is the possibility of extracting the edge features of the image through the algorithm of convolution calculation. However, this possibility is built at the considerable cost of the degradation of the data, and is the second reason for the V1 receiving an impoverished representation of the world. This compensatory mechanism embodies the principle of energy minimization of brain activity and also matches the experimental data summarized by Marcus E. Raichle.
The conclusions drawn in this paper have positive effects on the research of the visual information variations on the higher level of visual cortex and the exploration of the visual information processing mechanisms.
Acknowledgements
This study was funded by the National Natural Science Foundation of China (Nos. 11232005, 11472104, 11872180).
Abbreviations
- HBP
Human brain project
- BRAIN initiative
Brain research through advancing innovative neurotechnologies initiative
- Brain/mapping
Brain/mapping by innovative neurotechnologies for disease studies
- CV
Computer vision
- AI
Artificial intelligence
- RF
Receptive field
- CNN
Convolutional neural network
- ANN
Artificial neural network
- RMM
Recurrent motion model
- EDMRV1
Edge detection model based on retina to V1
- DA
Dark adaptation
- LA
Light adaptation
- RMSE
Root mean square error
- DOG
Difference of two Gaussians
- STDP
Spike timing-dependent plasticity
- LTP
Long-term potentiation
- LTD
Long-term depression
- GSAV
Gray-scale average value
Compliance with ethical standards
Conflict of interest
All authors declare that they have no conflict of interest.
Footnotes
Publisher's Note
Springer Nature remains neutral with regard to jurisdictional claims in published maps and institutional affiliations.
References
- Anderson EB, Mitchell JF, Reynolds JH. Attention-dependent reductions in burstiness and action-potential height in macaque area V4. Nat Neurosci. 2013;16(8):1125. doi: 10.1038/nn.3463. [DOI] [PMC free article] [PubMed] [Google Scholar]
- Bargmann CI, Newsome WT. The brain research through advancing innovative neurotechnologies (BRAIN) initiative and neurology. JAMA Neurol. 2014;71(6):675–676. doi: 10.1001/jamaneurol.2014.411. [DOI] [PubMed] [Google Scholar]
- Beyeler M, Dutt ND, Krichmar JL. Categorization and decision-making in a neurobiologically plausible spiking network using a STDP-like learning rule. Neural Netw. 2013;48:109–124. doi: 10.1016/j.neunet.2013.07.012. [DOI] [PubMed] [Google Scholar]
- Carver S, Roth E, Cowan NJ, Fortune ES. Synaptic plasticity can produce and enhance direction selectivity. PLoS Comput Biol. 2008;4(2):e32. doi: 10.1371/journal.pcbi.0040032. [DOI] [PMC free article] [PubMed] [Google Scholar]
- Curcio CA, Allen KA. Topography of ganglion cells in human retina. J Comp Neurol. 1990;300(1):5–25. doi: 10.1002/cne.903000103. [DOI] [PubMed] [Google Scholar]
- Deen B, Richardson H, Dilks DD, Takahashi A, Keil B, Wald LL, Saxe R. Organization of high-level visual cortex in human infants. Nat Commun. 2017;8:13995. doi: 10.1038/ncomms13995. [DOI] [PMC free article] [PubMed] [Google Scholar]
- Dubner R, Zeki SM (1971) Response properites and receptive fields of cells in an anatomically defined region of the superior temporal sulcus in the monkey. Brain Res [DOI] [PubMed]
- Fan H, Pan X, Wang R, Sakagami M. Differences in reward processing between putative cell types in primate prefrontal cortex. PLoS ONE. 2017;12(12):e0189771. doi: 10.1371/journal.pone.0189771. [DOI] [PMC free article] [PubMed] [Google Scholar]
- Ferrell JE., Jr Simple rules for complex processes: new lessons from the budding yeast cell cycle. Mol Cell. 2011;43(4):497–500. doi: 10.1016/j.molcel.2011.08.002. [DOI] [PMC free article] [PubMed] [Google Scholar]
- Fukushima K. Neocognitron: a self-organizing neural network model for a mechanism of pattern recognition unaffected by shift in position. Biol Cybern. 1980;36(4):193–202. doi: 10.1007/BF00344251. [DOI] [PubMed] [Google Scholar]
- Gaume A, Dreyfus G, Vialatte F-B. A cognitive brain–computer interface monitoring sustained attentional variations during a continuous task. Cognit Neurodyn. 2019;13(3):257–269. doi: 10.1007/s11571-019-09521-4. [DOI] [PMC free article] [PubMed] [Google Scholar]
- Gazzaniga MS, Ivry RB, Mangun GR. Cognitive neuroscience: the biology of the mind. New York: W. W. Norton; 2014. [Google Scholar]
- Gu F, Liang P. Neural information processing. Beijing: Beijing University of Technology Press; 2007. [Google Scholar]
- Hubel DH, Wiesel TN. Receptive fields, binocular interaction and functional architecture in the cat’s visual cortex. J Physiol. 1962;160(1):106–154. doi: 10.1113/jphysiol.1962.sp006837. [DOI] [PMC free article] [PubMed] [Google Scholar]
- Ji X, Hu X, Zhou Y, Dong Z, Duan S. Adaptive sparse coding based on memristive neural network with applications. Cogn Neurodyn. 2019 doi: 10.1007/s11571-019-09537-w. [DOI] [PMC free article] [PubMed] [Google Scholar]
- Joukes J, Hartmann TS, Krekelberg B. Motion detection based on recurrent network dynamics. Front Syst Neurosci. 2014;8(7):239. doi: 10.3389/fnsys.2014.00239. [DOI] [PMC free article] [PubMed] [Google Scholar]
- Kim S-Y, Lim W. Burst synchronization in a scale-free neuronal network with inhibitory spike-timing-dependent plasticity. Cogn Neurodyn. 2019;13(1):53–73. doi: 10.1007/s11571-018-9505-1. [DOI] [PMC free article] [PubMed] [Google Scholar]
- Köppen M, Kasabov N, Coghill G (2009) Advances in neuro-information processing. Lecture Notes in Computer Science, vol 5506
- Kriegeskorte N. Deep neural networks: a new framework for modeling biological vision and brain information processing. Annu Rev Vis Sci. 2015;1:417–446. doi: 10.1146/annurev-vision-082114-035447. [DOI] [PubMed] [Google Scholar]
- Kumar RK, Garain J, Kisku DR, Sanyal G. Guiding attention of faces through graph based visual saliency (GBVS) Cogn Neurodyn. 2019;13(2):125–149. doi: 10.1007/s11571-018-9515-z. [DOI] [PMC free article] [PubMed] [Google Scholar]
- Lamti HA, Khelifa MMB, Hugel V. Mental fatigue level detection based on event related and visual evoked potentials features fusion in virtual indoor environment. Cogn Neurodyn. 2019;13(3):271–285. doi: 10.1007/s11571-019-09523-2. [DOI] [PMC free article] [PubMed] [Google Scholar]
- LeCun Y, Boser B, Denker JS, Henderson D, Howard RE, Hubbard W, Jackel LD. Backpropagation applied to handwritten zip code recognition. Neural Comput. 1989;1(4):541–551. doi: 10.1162/neco.1989.1.4.541. [DOI] [Google Scholar]
- LeCun Y, Bengio Y, Hinton G. Deep learning. Nature. 2015;521(7553):436. doi: 10.1038/nature14539. [DOI] [PubMed] [Google Scholar]
- Liu B-H, Li P, Sun YJ, Li Y-T, Zhang LI, Tao HW. Intervening inhibition underlies simple-cell receptive field structure in visual cortex. Nat Neurosci. 2010;13(1):89. doi: 10.1038/nn.2443. [DOI] [PMC free article] [PubMed] [Google Scholar]
- Marblestone AH, Wayne G, Kording KP. Toward an integration of deep learning and neuroscience. Front Comput Neurosci. 2016;10:94. doi: 10.3389/fncom.2016.00094. [DOI] [PMC free article] [PubMed] [Google Scholar]
- Markram H. The human brain project. Sci Am. 2012;306(6):50–55. doi: 10.1038/scientificamerican0612-50. [DOI] [PubMed] [Google Scholar]
- Marr D (1982) Vision: a computational investigation into the human representation and processing of visual information. In: WH Freeman, San Francisco
- Okano H, Miyawaki A, Kasai K. Brain/MINDS: brain-mapping project in Japan. Philos Trans R Soc B Biol Sci. 2015;370(1668):20140310. doi: 10.1098/rstb.2014.0310. [DOI] [PMC free article] [PubMed] [Google Scholar]
- Owsley C, McGwin G, Jr, Clark ME, Jackson GR, Callahan MA, Kline LB, Curcio CA. Delayed rod-mediated dark adaptation is a functional biomarker for incident early age-related macular degeneration. Ophthalmology. 2016;123(2):344–351. doi: 10.1016/j.ophtha.2015.09.041. [DOI] [PMC free article] [PubMed] [Google Scholar]
- Parhizi B, Daliri MR, Behroozi M. Decoding the different states of visual attention using functional and effective connectivity features in fMRI data. Cogn Neurodyn. 2018;12(2):157–170. doi: 10.1007/s11571-017-9461-1. [DOI] [PMC free article] [PubMed] [Google Scholar]
- Peters JF, Tozzi A, Ramanna S, Inan E. The human brain from above: an increase in complexity from environmental stimuli to abstractions. Cogn Neurodyn. 2017;11(4):391–394. doi: 10.1007/s11571-017-9428-2. [DOI] [PMC free article] [PubMed] [Google Scholar]
- Poo MM, Du JL, Ip N, Xiong ZQ, Xu B, Tan T. China brain project: basic neuroscience, brain diseases, and brain-inspired computing. Neuron. 2016;92(3):591–596. doi: 10.1016/j.neuron.2016.10.050. [DOI] [PubMed] [Google Scholar]
- Qu J, Wang R. Collective behavior of large-scale neural networks with GPU acceleration. Cogn Neurodyn. 2017;11(6):553–563. doi: 10.1007/s11571-017-9446-0. [DOI] [PMC free article] [PubMed] [Google Scholar]
- Raichle ME. Two views of brain functioning. Trends Cogn Sci. 2010;14(4):180–190. doi: 10.1016/j.tics.2010.01.008. [DOI] [PubMed] [Google Scholar]
- Rolfs M. Microsaccades: small steps on a long way. Vis Res. 2009;49(20):2415–2441. doi: 10.1016/j.visres.2009.08.010. [DOI] [PubMed] [Google Scholar]
- Shou T. Brain mechanisms of visual information processing. Hefei: University of Science and Technology of China Press; 2010. [Google Scholar]
- Talebi N, Nasrabadi AM, Mohammad-Rezazadeh I. Estimation of effective connectivity using multi-layer perceptron artificial neural network. Cogn Neurodyn. 2018;12(1):21–42. doi: 10.1007/s11571-017-9453-1. [DOI] [PMC free article] [PubMed] [Google Scholar]
- Vinberg F, Chen J, Kefalov VJ. Regulation of calcium homeostasis in the outer segments of rod and cone photoreceptors. Progr Retin Eye Res. 2018;67:87–101. doi: 10.1016/j.preteyeres.2018.06.001. [DOI] [PMC free article] [PubMed] [Google Scholar]
- Xiao J, Huang X. Distributed and dynamic neural encoding of multiple motion directions of transparently moving stimuli in cortical area MT. J Neurosci. 2015;35(49):16180–16198. doi: 10.1523/JNEUROSCI.2175-15.2015. [DOI] [PMC free article] [PubMed] [Google Scholar]
- Zhang T, Pan X, Xu X, Wang R. A cortical model with multi-layers to study visual attentional modulation of neurons at the synaptic level. Cogn Neurodyn. 2019 doi: 10.1007/s11571-019-09540-1. [DOI] [PMC free article] [PubMed] [Google Scholar]
- Zhu M, Xu Y, Ma H (2018) Edge detection based on the characteristic of primary visual cortex cells. Paper presented at the journal of physics: conference series


