Abstract
Purpose
To assess the impact of adding thin-section CT–derived semiquantitative fibrotic score to gender, age, and physiology (GAP) model for predicting survival in idiopathic pulmonary fibrosis (IPF).
Materials and Methods
In this retrospective study of 194 patients with IPF, primary outcome was transplant-free survival. Two thoracic radiologists visually estimated the percentage of reticulation and honeycombing at baseline thin-section CT, which were added to give fibrotic score. For analysis, fibrotic score cutoff (x) determined by using receiver operating characteristic analysis categorized patients into group A (<x) and group B (≥x). Another categorization based on GAP score created group 1 (score 0–3) and group 2 (score >3). Combining the above categories gave four groups (A1, A2, B1, B2). Kaplan-Meier survival analysis was performed with comparison statistics (log-rank test), and hazard ratios were calculated by using the Cox model.
Results
The study patients included 141 men (72.7%), with average age of 66.1 years ± 9.1 (standard deviation). Eighty-four patients (43.3%) has stage I disease with a median follow up of 3.3 years. The interobserver agreement for thin-section CT fibrotic score was substantial (83.3%; κ = 0.64). The optimal cutoff for fibrotic score was 25% (x), with area under the curve of 0.654 (95% confidence interval [CI]: 0.569, 0.74). Survival for group A1 was significantly better than in the other three groups (P < .001). The hazard ratios for respective groups were as follows: B1 was 4.03 (95% CI: 2.02, 8.07), A2 was 4.10 (95% CI: 1.89, 8.87), and B2 was 5.62 (95% CI: 2.86, 11.06) (P < .001 for all). Within the group with GAP score less than or equal to 3 (A1, B1), participants with higher fibrotic score (B1) had four times the increased risk of death or transplantation (P < .001).
Conclusion
Incorporating semiquantitative fibrotic score from thin-section CT to GAP score provides an improved prediction model for survival in idiopathic pulmonary fibrosis.
© RSNA, 2019
See also the commentary by Chung in this issue.
Summary
Incorporating semiquantitative fibrotic score from thin-section CT to gender, age, and physiology (GAP) score provides an improved prediction model for survival in patients with idiopathic pulmonary fibrosis, especially in early-stage or mild disease.
Key Points
■ The addition of a visual semiquantitative fibrotic score from thin-section CT of the chest to the gender, age, and physiology (GAP) score at the time of diagnosis provides a better prediction model for survival analysis in patients with idiopathic pulmonary fibrosis compared with GAP score alone.
■ This thin-section CT-GAP model combines fibrotic score with GAP score and shows improved correlation with outcomes, especially in patients with mild disease (GAP score ≤3).
Introduction
Idiopathic pulmonary fibrosis (IPF) is the most common type of idiopathic interstitial pneumonia and is associated with poor prognosis (1,2). Until recent years, lung transplant was the only treatment option available for IPF. Currently, a few antifibrotic medications are approved for use in patients with IPF that claim to slow down the disease progression (3). The clinical course of IPF is unpredictable and predictive models utilizing clinical variables have been proposed (4–8). Among these, gender, age, and physiologic (GAP) score has been demonstrated to be reliable for predicting survival in IPF and other chronic interstitial lung diseases and utilizes variables that are easily obtainable in clinical practice (8,9).
Thin-section CT of the chest is an essential tool in diagnosis of IPF (1,10). Studies have shown that a “definite usual interstitial pneumonia” pattern at thin-section CT is associated with higher mortality (11). In addition, the extent of reticulation and honeycombing has been shown to correlate with outcomes in IPF (10,12–19). Some other thin-section CT features such as traction bronchiectasis and honeycombing have also been linked with survival (20,21). The fibrotic score is considered as a combination of extent of reticulation and honeycomb changes seen at thin-section CT (22). However, none of the previous research evaluated the role of extent of thin-section CT changes as an adjunct to the GAP score. We hypothesized that the addition of fibrotic score from baseline chest thin-section CT would improve the value of GAP score in predicting disease progression and patient survival.
Materials and Methods
This retrospective study was approved by our institutional review board. This study was Health Insurance Portability and Accountability Act compliant. We reviewed all consecutive patients with IPF (n = 352) who were enrolled in the Pulmonary Translational Research and Clinical Database at our institution from January 1, 2000 to December 31, 2013. The diagnosis was reached according to 2011 American Thoracic Society/European Respiratory Society guidelines (1). As a part of work-up, an extensive serology and clinical history including occupation, drug, and environmental exposure were obtained. The diagnosis of IPF was established if a definite usual interstitial pneumonia pattern at thin-section CT of the chest was present in a patient clinically suspected of having IPF. A multidisciplinary panel (consisting of at least one pulmonologist, chest radiologist, thoracic surgeon, and chest pathologist each who are experts in this field) discussed clinically discordant cases, cases with possible definite usual interstitial pneumonia pattern, or cases with inconsistent definite usual interstitial pneumonia pattern. Diagnosis of IPF was established when tissue sampling showed definite usual interstitial pneumonia pattern or otherwise by consensus agreement by the panel in an appropriate clinical setting. We included all consecutive patients with a thin-section CT scan at initial presentation and at least one follow-up visit to the interstitial lung disease clinic. Demographic, clinical, and imaging data for these patients were reviewed. The total number of scans were equally distributed among the two blinded fellowship-trained thoracic radiologists (S.S., J.W.) with at least 5 years of experience in quality review. The exclusion criteria were suboptimal thin-section CT scan (nonadherence to American College of Radiology guidelines), presence of artifacts such as from considerable respiratory motion, and no expiratory images (23). For patients with serial thin-section CT scans, the earliest CT was used for the study. The selected thin-section CT scans of the chest were anonymized and equally divided between the two study radiologists who reviewed the axial and coronal reformats on the inspiratory scan and visually estimated the percentage of reticulation and honeycombing separately. Specifically, each lung was considered 50% each, making both lungs 100% together. The percentages were scored to the closest multiple of five, and the fibrotic score was calculated as sum of reticulation and honeycombing. In addition, both readers scored 15 more scans (each from other reader group) that were evenly distributed across the cohort, thus giving 30 scans (15%) in common for the assessments of interreader variability. GAP score, originally suggested by Ley et al (8), was calculated for each participant and is outlined in Table 1.
Table 1:
Gender, Age, and Physiology (GAP) Score
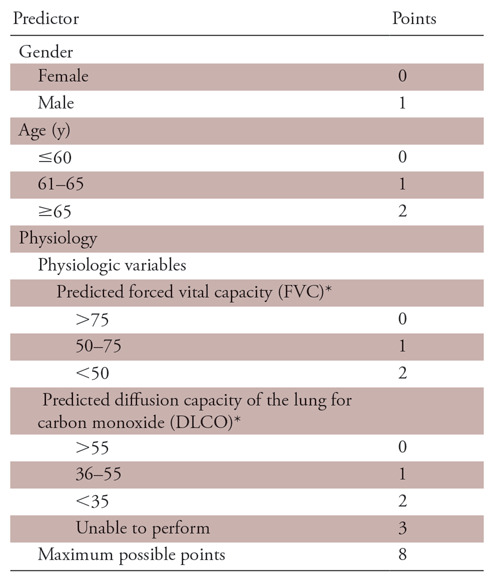
Note.—Score of 0–3 indicates GAP stage I, score of 4–5 indicates GAP stage II, and score of 6–8 indicates GAP stage III.
*Indicates percentage predicted.
Primary outcome for the study was transplant-free survival, defined as the time between initial visit to our institution and death or lung transplantation. The date of transplantation was extracted from the institutional lung transplantation and clinic database. Vital status was obtained from the Social Security Death Index or Institutional Pulmonary Translational Research and Clinical Database.
Statistical Analysis
Descriptive statistics for characteristics of the study cohort were estimated and presented with mean and standard deviation for continuous measures and frequency and percentage for categorical variables. Median and interquartile range were estimated for follow-up time. Surgical lung biopsy data were correlated with GAP stages and fibrotic score categories by using χ2 test. Correlation between lung function (functional vital capacity, diffusion capacity of carbon monoxide [DLCO]) and fibrotic score was assessed by using Pearson correlation coefficient. Optimal cutoff for reticulation, honeycombing, and fibrotic score was determined with receiver operating characteristic analysis, taking the primary outcome as the event. R software (version 3.3.2; R Foundation for Statistical Computing, Vienna, Austria) was used for the calculation of optimal cutoffs with Youden criteria. By using Cox proportional hazard model, hazard ratios (HRs) of honeycombing, reticulation, and fibrotic score were calculated, taking optimum cutoff points. Fibrotic score was then categorized as dichotomized variable based on this cutoff as group A, with fibrotic score less than the cutoff, and as group B, with fibrotic score equal to or greater than the cutoff. GAP score was dichotomized in group 1 with score 0–3 (stage I) and in group 2 with score greater than 3 (stage II or III). Combining the dichotomized GAP and fibrotic score variables created four groups (group A1, A2, B1, B2). Distribution information of these groups was presented as frequency and percentage. Kaplan-Meier survival curves were estimated for these four groups along with comparison statistics (log-rank test). By using Cox proportional hazard model, HRs of the groups 1 versus 2 and group A versus B were calculated. Additionally, combined groups of GAP scores and fibrotic scores were evaluated. Next, we examined the interaction term of GAP score in association between the thin-section CT score and transplant-free survival, which indicated GAP score could be a potential effect modifier. Therefore, subgroup analysis was conducted based on the GAP score of 0–3 versus GAP score greater than 3. Cox proportional hazard models were estimated by GAP stages to investigate whether the effect of dichotomized fibrotic score variables is varied by GAP stages. The hypothesis testing was two-sided, with P ≤.05 considered to indicate statistical significance. All the statistical analyses were performed with SAS (version 9.4; SAS Institute, Cary, NC).
Results
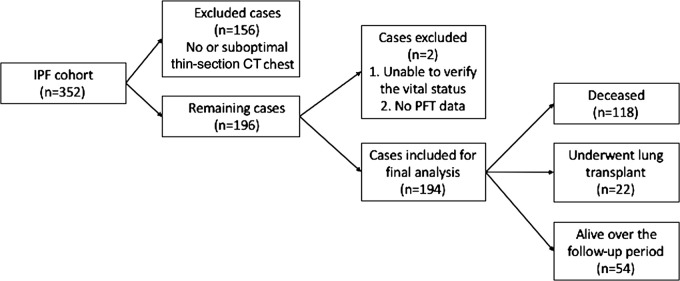
Of the 352 cases in the Institutional Pulmonary Translational Research and Clinical Database cohort, 156 cases were excluded because thin-section CT images were unavailable or were suboptimal compared with the American College of Radiology standards as judged by the study radiologists. Among 196 patients with optimum thin-section CT chest scans, two patients were excluded due to lack of clinical data and 194 patients were included in the final analysis (Fig 1). Average age of the patients was 66.6 years ± 9.1 (standard deviation). The majority of patients were men (141 of 194, 72.7%) and non-Hispanic white (182 of 194, 93.8%). Median follow-up time for the study was 3.3 years. Detailed demographic data are listed in Table 2. A total of 107 patients had undergone a surgical lung biopsy before being labeled as having IPF, whereas 87 patients did not undergo surgical lung biopsy and their diagnosis was established after multidisciplinary discussion as described previously. There was no significant association between surgical lung biopsy and fibrotic score. However, patients with a higher GAP score (score >3) were less likely to undergo a surgical lung biopsy (67.8% vs 46.7%; P =.003). Details are tabulated in Table 3.
Figure 1:
Flowchart shows study cohort and overall outcome after follow-up. IPF = idiopathic pulmonary fibrosis, PFT = pulmonary function test.
Table 2:
Baseline Study Characteristics
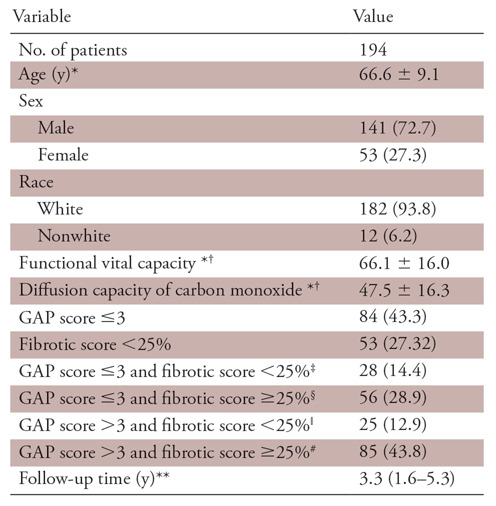
Note.—Unless otherwise specified, data are frequencies, with percentages in parentheses. GAP = gender, age, and physiology.
*Data are means ± standard deviation.
†Indicates percentage predicted.
‡Indicates group A1.
§Indicates group B1.
ǁIndicates group A2.
#Indicates group B2.
**Data are medians, with interquartile range in parentheses.
Table 3:
Correlation of Fibrotic Score and Gender, Age, and Physiology (GAP) Score with Surgical Lung Biopsy
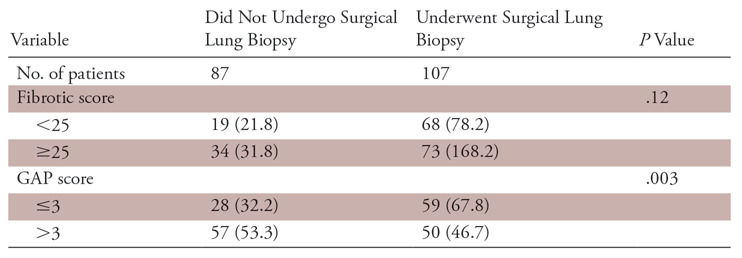
Note.—Data are numbers, with percentages in parentheses.
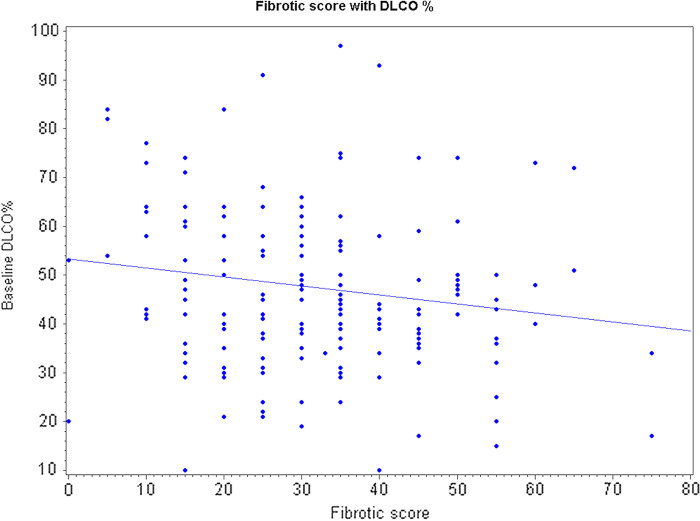
There was no significant correlation between baseline functional vital capacity (percentage predicted) and fibrotic score with a Pearson correlation coefficient (r = −0.10854; P =.1361). Baseline DLCO data were available for only 172 patients. Twenty-two patients could not get a baseline DLCO measurement due to their advanced disease. There is only a weak negative correlation between baseline DLCO data and fibrotic score (r =−0.163; P =.03). This weak correlation is caused by the extreme observation that has a fibrotic score of 75 and DLCO percentage of 17 that can be seen in Figure 2. If we exclude this extreme observation, then correlation is no longer significant (r = −0.1357; P =.0759).
Figure 2:
Line dot graph depicts distribution of diffusion capacity of carbon monoxide with fibrotic score. AUC = area under the curve, ROC = receiver operating characteristic.
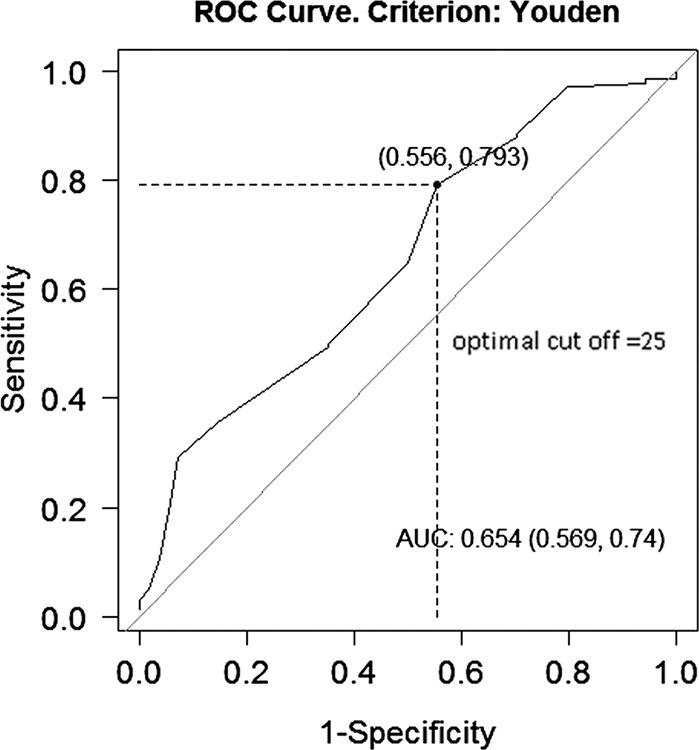
The optimum cutoff value from receiver operating characteristic analysis for honeycombing was 10% (area under the curve, 0.634 [95% confidence interval {CI}: 0.555, 0.712]), for reticulation was 15% (area under the curve, 0.574 [95% CI: 0.481, 0.667]), and for fibrotic score was 25% (area under the curve, 0.654 [95% CI: 0.569, 0.74]) (Fig 3). HRs were calculated taking these values as cutoff. Fifty-three (27.3%) patients had fibrotic scores of less than 25%. Eighty-four patients (43.3%) had stage I disease (GAP score ≤3). The interreader agreement between the two radiologists for the fibrotic score less than or equal to 25 versus score greater than 25 for 30 cases was 83.3% (κ = 0.64; P =.001), indicating substantial agreement.
Figure 3:
Graph shows fibrotic score optimal cutoff (Youden J index). DLCO = diffusion capacity of carbon monoxide with fibrotic score.
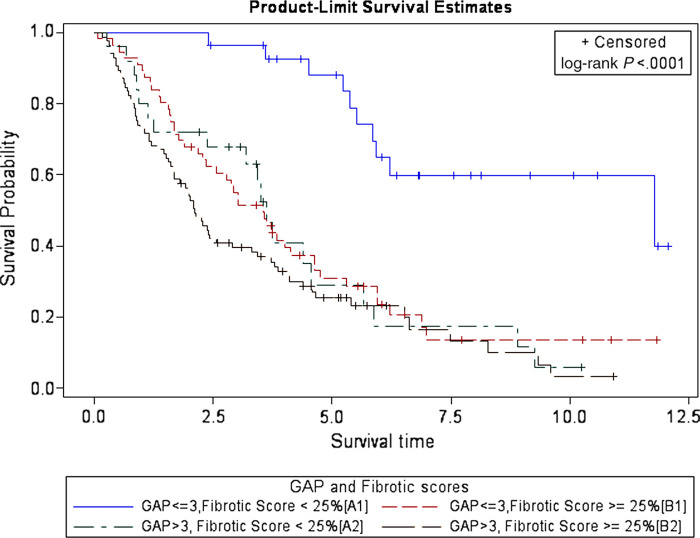
The findings of Kaplan-Meier survival analysis using four groups of combinations of dichotomized GAP scores and fibrotic scores for predicting patient survival are shown in Figure 4. Survival curve for lower GAP and fibrotic score group (GAP score ≤3 and fibrotic score <25%, or group A1) is markedly separated from the other three groups. P value obtained by performing log-rank test indicates that this separation is statistically significant (P <.001).
Figure 4:
Graph shows survival curves of patients with idiopathic pulmonary fibrosis by combined groups of gender, age, and physiology (GAP) score and CT fibrotic score at baseline thin-section CT.
Estimated HRs for the patients with IPF based on different variables and their proposed combinations are shown in Table 4 and HRs of patients with IPF by GAP stages are shown in Table 5. Participants with lower GAP stage and higher fibrotic score (group B1) had 4.0 times the increased risk of death or transplantation compared with those with lower GAP stage and lower fibrotic score (P <.001). Participants with higher GAP stage and lower fibrotic score (group A2) had 4.1 times the increased risk of death or transplantation compared with those with lower GAP stage and lower fibrotic score (P =.0003). Participants with higher GAP stage and higher fibrotic score (group B2) had 5.62 times the increased risk of death or transplantation compared with those with lower GAP stage and lower fibrotic score (P <.001). Within group 1 (GAP score ≤3), participants with higher fibrotic score had 4.07 times the increased risk of death or transplantation compared with those with lower fibrotic score (group B1 > A1; P <.001) (Figs 5, 6). Within group 2 (GAP score >3), there was no difference of HR between participants with higher and lower fibrotic score (groups A2, B2).
Table 4:
Estimated Hazard Ratios of Patients with Idiopathic Pulmonary Fibrosis
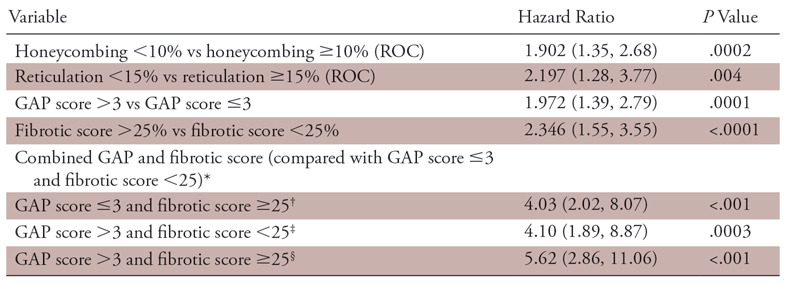
Note.—Data in parentheses are 95% confidence intervals. GAP = gender, age, and physiology, ROC = receiver operating characteristic.
*Indicates group A1.
†Indicates group B1.
‡Indicates group A2.
§Indicates group B2.
Table 5:
Estimated Hazard Ratio of Patients with Idiopathic Pulmonary Fibrosis by Gender, Age, and Physiology (GAP) Stages
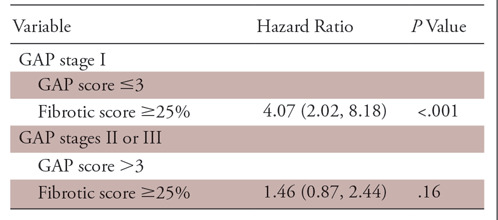
Note.—Data in parentheses are 95% confidence intervals.
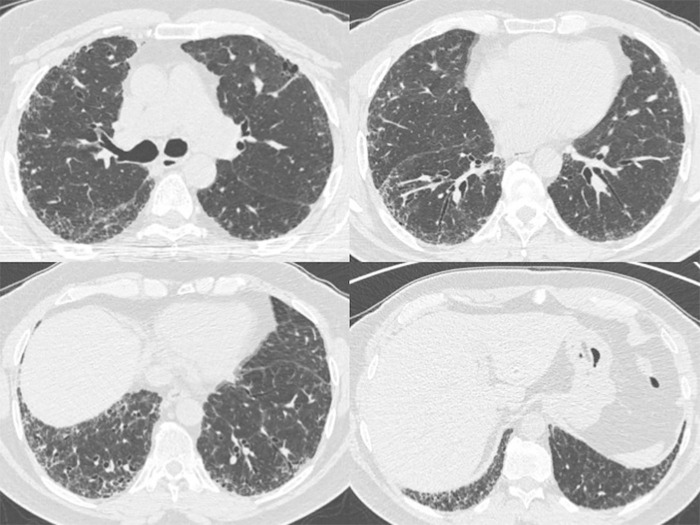
Figure 5:
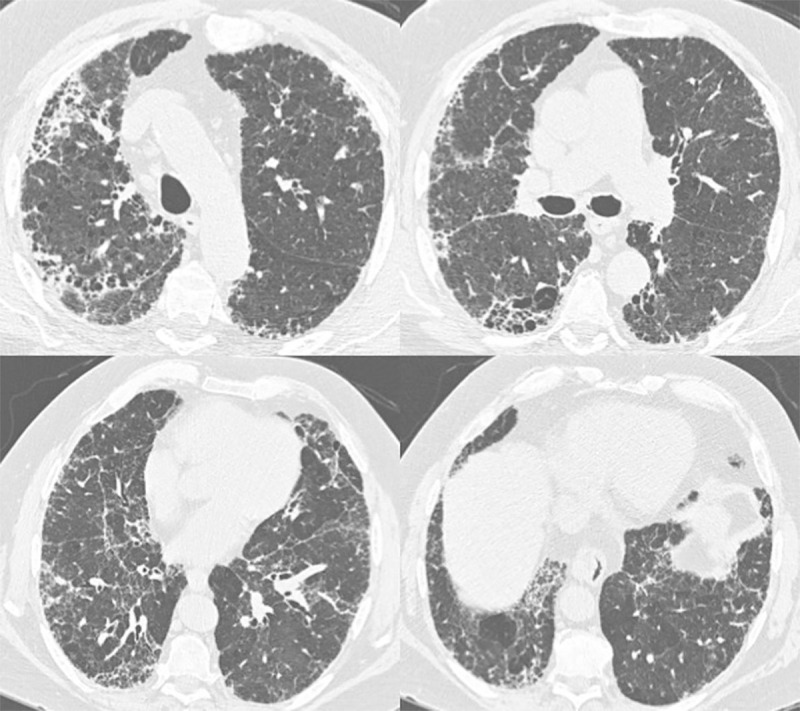
Axial thin-section CT images of chest in a 72-year-old man with gender, age, and physiology score of 3 and fibrotic score of 30 (reticulation 15%; honeycombing 15%) (group B1). He was deceased at study follow-up.
Figure 6:
Axial thin-section CT images of chest in a 62-year-old man with gender, age, and physiology score of 3 and fibrotic score of 15 (reticulation 15%; honeycombing 0%) (group A1). He was alive at study follow-up.
Discussion
In this study, we investigated whether addition of semiquantitative thin-section CT fibrotic score to the clinical GAP score could yield significant information for patient survival in IPF. We constructed four groups by using two GAP and fibrotic score groups for patient survival and found that in patients with lower GAP stage (GAP score ≤3), the fibrotic score is a much better tool for outcome.
Thin-section CT of the chest has an important part to play in the diagnosis of IPF. Specifically, it obviates tissue sampling or biopsy in a case with “definite usual interstitial pneumonia” pattern, in an appropriate clinical setting (23). These thin-section CT criteria provide a good tool for diagnosis of IPF and can also assist in determining its prognosis. Multiple quantifiable imaging findings at thin-section CT, including traction bronchiectasis and fibrotic score, have been shown to consistently correlate with prognosis (20,22,24). In one of these studies (20) including patients with biopsy-proven IPF, extent of traction bronchiectasis and fibrotic score correlated well with prognosis irrespective of radiographic disease pattern. A study (25) evaluating the role of serial CT to monitor disease progression concluded that the extent of fibrosis at the baseline scan was the only predictor of mortality. Also, development of honeycombing at serial CT monitoring for disease progression has not been shown to affect prognosis (26). In one of the early attempts at quantitative assessment of fibrosis, semiquantitative visual extent of fibrosis was the single best predictor of mortality and correlated much better than did quantitative measures such as skewness and kurtosis (27). The results from these studies indicate that increasing extent of disease at CT is undeniably related to adverse prognosis in IPF. However, clinically useful staging systems based on imaging traditionally require absolute cutoffs for analysis and prognostication. In this regard, there is a paucity of research in quantification of the extent of fibrotic features in IPF. An attempt in this direction was made by Romei et al (18), who showed in their study that baseline honeycombing greater than 25%, fibrotic score greater than 30%, and traction bronchiectasis in all the lobes are associated with poor outcome.
GAP is a clinical prediction model based on gender, age, and physiologic variables such as functional vital capacity and DLCO. It is the most widely used clinical tool for prognostication in patients with IPF due to its good prediction ability and ease of calculation in an office setting. However, assessing DLCO (a component of GAP score) might be impossible in some patients with extensive disease who have high baseline oxygen requirement and coexisting pulmonary hypertension. Some studies report the limited capability of the GAP score to accurately predict outcomes, emphasizing the need for more robust prediction models (28). To address this shortcoming, a new modified GAP model (CT-GAP) by substituting DLCO with CT fibrotic score was found to have comparable performance for prognostication by Ley et al (16). In our study, the extent of honeycombing, reticulation, and especially a combined fibrotic score showed a good correlation with patient outcome. Both honeycombing and reticulation at thin-section CT indicate fibrosis but can be hard to distinguish from each other. Therefore, the combined fibrotic score might be a better parameter with less interreader variability as observed in the current study. In the study model (thin-section CT-GAP), the CT fibrotic score was added as a new variable to the GAP score that showed a good correlation with transplant-free survival. Particularly, the fibrotic score was an important prediction variable in the patient group with lower GAP stages (GAP score ≤3). The predicted functional vital capacity did not have significant correlation with fibrotic score and predicted DLCO showed a weak correlation that was not significant when extreme values were removed. These are interesting study findings, suggesting that the imaging changes do not always parallel physiologic decline shown by pulmonary function tests. We speculate a few reasons for this discordance, such as variability in patients’ respiratory reserve; imaging changes preceding the physiologic changes and vice versa in different patients; variable degree of small airway affection; and lack of including comorbidities (such as chronic obstructive pulmonary disease, pulmonary hypertension, etc) in the GAP model. Moreover, recent studies (29) advocate additional physiologic testing including measurement of lung compliance and quantification of dead space ventilation for better pulmonary functional evaluation of patients with IPF, and thus better correlation with survival.
Recently, many automated image analysis techniques at thin-section CT including density histogram analysis (such as Gaussian histogram normalized correlation system), density mask technique, and texture classification have been used to quantify fibrosis. Most of them document a good correlation with pulmonary function tests and clinical outcome (30–32). Further work with machine learning for developing reliable automated quantification algorithms for fibrotic score will not only overcome the subjectivity in visual fibrotic scoring, but also make our study findings easily applicable in the clinical setting.
In addition to the retrospective nature, we acknowledge a few limitations of our study. The diagnosis of IPF was already established according to the 2011 guidelines in this retrospective cohort (1). However, recent guidelines were published in 2018 that are more comprehensive and will be used in practice onwards (23). We dichotomized the GAP stages in the model instead of retaining the three GAP stages described. This was because of limited and uneven distribution of the number of cases in each GAP stage. Moreover, it has been reported that patients with GAP stage I disease are prognostically very different from patients with GAP stage II and III disease, whereas the difference is not so marked between stages II and III (33). Two different radiologists did not double read all the cases. However, both the readers independently scored 30 (15%) cases, with a substantial interreader agreement for fibrotic score categories. We did not assess the role of comorbidities such as emphysema or pulmonary hypertension at CT that could have significantly affected lung function and GAP score, at least in some patients.
The proposed thin-section CT-GAP model in our study has a potential for better patient stratification to target therapy and monitor treatment response with the newer antifibrotic drugs. Further research with larger cohorts and utilization of machine learning algorithms are needed to emphasize these findings.
In conclusion, the addition of a visual semiquantitative fibrotic score from thin-section CT of the chest to the GAP score at the time of diagnosis provides a better prediction model for survival analysis in patients with IPF compared with GAP score alone. The thin-section CT-GAP model combines the fibrotic score with GAP score and shows improved correlation with outcomes, especially in patients with mild disease (GAP score ≤3).
Current address: Mayo Clinic, Jacksonville, Fla
Disclosures of Conflicts of Interest: A.C. disclosed no relevant relationships. R.S. disclosed no relevant relationships. J.W. Activities related to the present article: disclosed no relevant relationships. Activities not related to the present article: author received payment for lectures including service on speakers bureaus from Boehringer Ingelheim and Genetech. Other relationships: disclosed no relevant relationships. J.d.A. Activities related to the present article: disclosed no relevant relationships. Activities not related to the present article: author received payment for lectures including service on speakers bureaus from Boehringer Ingelheim and Genetech; received payment for development of educational presentations from American College of Chest Physicians. Other relationships: disclosed no relevant relationships. T.L. Activities related to the present article: disclosed no relevant relationships. Activities not related to the present article: author received payment for lectures including service on speakers bureaus from Boehringer Ingelheim. Other relationships: disclosed no relevant relationships. Y.I.K. disclosed no relevant relationships. R.R. disclosed no relevant relationships. S.S. Activities related to the present article: disclosed no relevant relationships. Activities not related to the present article: has grants/grants pending with Columbia University; author received payment for development of educational presentations from Paradigm Medical Communications. Other relationships: is co-investigator on University of Alabama at Birmingham pulmonary medicine grants; institution received money for Radiology Research Initiative Pilot Project Award (RRIPA) 2016–2018.
Abbreviations:
- CI
- confidence interval
- GAP
- gender, age, and physiology
- DLCO
- diffusion capacity of carbon monoxide
- HR
- hazard ratio
- IPF
- idiopathic pulmonary fibrosis
References
- 1.Raghu G, Collard HR, Egan JJ, et al. An official ATS/ERS/JRS/ALAT statement: idiopathic pulmonary fibrosis: evidence-based guidelines for diagnosis and management. Am J Respir Crit Care Med 2011;183(6):788–824. [DOI] [PMC free article] [PubMed] [Google Scholar]
- 2.Travis WD, Costabel U, Hansell DM, et al. An official American Thoracic Society/European Respiratory Society statement: update of the international multidisciplinary classification of the idiopathic interstitial pneumonias. Am J Respir Crit Care Med 2013;188(6):733–748. [DOI] [PMC free article] [PubMed] [Google Scholar]
- 3.Raghu G, Selman M. Nintedanib and pirfenidone: new antifibrotic treatments indicated for idiopathic pulmonary fibrosis offer hopes and raises questions. Am J Respir Crit Care Med 2015;191(3):252–254. [DOI] [PubMed] [Google Scholar]
- 4.Erbes R, Schaberg T, Loddenkemper R. Lung function tests in patients with idiopathic pulmonary fibrosis: are they helpful for predicting outcome? Chest 1997;111(1):51–57. [DOI] [PubMed] [Google Scholar]
- 5.Lederer DJ, Arcasoy SM, Wilt JS, D’Ovidio F, Sonett JR, Kawut SM. Six-minute-walk distance predicts waiting list survival in idiopathic pulmonary fibrosis. Am J Respir Crit Care Med 2006;174(6):659–664. [DOI] [PMC free article] [PubMed] [Google Scholar]
- 6.Ley B, Collard HR, King TE Jr. Clinical course and prediction of survival in idiopathic pulmonary fibrosis. Am J Respir Crit Care Med 2011;183(4):431–440. [DOI] [PubMed] [Google Scholar]
- 7.du Bois RM, Weycker D, Albera C, et al. Ascertainment of individual risk of mortality for patients with idiopathic pulmonary fibrosis. Am J Respir Crit Care Med 2011;184(4):459–466. [DOI] [PubMed] [Google Scholar]
- 8.Ley B, Ryerson CJ, Vittinghoff E, et al. A multidimensional index and staging system for idiopathic pulmonary fibrosis. Ann Intern Med 2012;156(10):684–691. [DOI] [PubMed] [Google Scholar]
- 9.Ryerson CJ, Vittinghoff E, Ley B, et al. Predicting survival across chronic interstitial lung disease: the ILD-GAP model. Chest 2014;145(4):723–728. [DOI] [PubMed] [Google Scholar]
- 10.Lynch DA, Travis WD, Müller NL, et al. Idiopathic interstitial pneumonias: CT features. Radiology 2005;236(1):10–21. [DOI] [PubMed] [Google Scholar]
- 11.Migita K, Arai T, Jiuchi Y, et al. Predictors of mortality in patients with interstitial lung disease treated with corticosteroids: results from a cohort study. Medicine (Baltimore) 2014;93(26):e175. [DOI] [PMC free article] [PubMed] [Google Scholar]
- 12.Flaherty KR, Thwaite EL, Kazerooni EA, et al. Radiological versus histological diagnosis in UIP and NSIP: survival implications. Thorax 2003;58(2):143–148. [DOI] [PMC free article] [PubMed] [Google Scholar]
- 13.Shin KM, Lee KS, Chung MP, et al. Prognostic determinants among clinical, thin-section CT, and histopathologic findings for fibrotic idiopathic interstitial pneumonias: tertiary hospital study. Radiology 2008;249(1):328–337. [DOI] [PubMed] [Google Scholar]
- 14.Noth I, Zangan SM, Soares RV, et al. Prevalence of hiatal hernia by blinded multidetector CT in patients with idiopathic pulmonary fibrosis. Eur Respir J 2012;39(2):344–351. [DOI] [PubMed] [Google Scholar]
- 15.Gruden JF, Panse PM, Leslie KO, Tazelaar HD, Colby TV. UIP diagnosed at surgical lung biopsy, 2000-2009: HRCT patterns and proposed classification system. AJR Am J Roentgenol 2013;200(5):W458–W467. [DOI] [PubMed] [Google Scholar]
- 16.Ley B, Elicker BM, Hartman TE, et al. Idiopathic pulmonary fibrosis: CT and risk of death. Radiology 2014;273(2):570–579. [DOI] [PMC free article] [PubMed] [Google Scholar]
- 17.Oda K, Ishimoto H, Yatera K, et al. High-resolution CT scoring system-based grading scale predicts the clinical outcomes in patients with idiopathic pulmonary fibrosis. Respir Res 2014;15(1):10. [DOI] [PMC free article] [PubMed] [Google Scholar]
- 18.Romei C, Tavanti L, Sbragia P, et al. Idiopathic interstitial pneumonias: do HRCT criteria established by ATS/ERS/JRS/ALAT in 2011 predict disease progression and prognosis? Radiol Med (Torino) 2015;120(10):930–940. [DOI] [PubMed] [Google Scholar]
- 19.Tanizawa K, Handa T, Nagai S, et al. Clinical impact of high-attenuation and cystic areas on computed tomography in fibrotic idiopathic interstitial pneumonias. BMC Pulm Med 2015;15(1):74. [DOI] [PMC free article] [PubMed] [Google Scholar]
- 20.Sumikawa H, Johkoh T, Colby TV, et al. Computed tomography findings in pathological usual interstitial pneumonia: relationship to survival. Am J Respir Crit Care Med 2008;177(4):433–439. [DOI] [PubMed] [Google Scholar]
- 21.Edey AJ, Devaraj AA, Barker RP, Nicholson AG, Wells AU, Hansell DM. Fibrotic idiopathic interstitial pneumonias: HRCT findings that predict mortality. Eur Radiol 2011;21(8):1586–1593. [DOI] [PubMed] [Google Scholar]
- 22.Lynch DA, Godwin JD, Safrin S, et al. High-resolution computed tomography in idiopathic pulmonary fibrosis: diagnosis and prognosis. Am J Respir Crit Care Med 2005;172(4):488–493. [DOI] [PubMed] [Google Scholar]
- 23.Raghu G, Remy-Jardin M, Myers JL, et al. Diagnosis of idiopathic pulmonary fibrosis: an official ATS/ERS/JRS/ALAT clinical practice guideline. Am J Respir Crit Care Med 2018;198(5):e44–e68. [DOI] [PubMed] [Google Scholar]
- 24.Battista G, Zompatori M, Fasano L, Pacilli A, Basile B. Progressive worsening of idiopathic pulmonary fibrosis: high resolution computed tomography (HRCT) study with functional correlations. Radiol Med (Torino) 2003;105(1-2):2–11. [PubMed] [Google Scholar]
- 25.Lee HY, Lee KS, Jeong YJ, et al. High-resolution CT findings in fibrotic idiopathic interstitial pneumonias with little honeycombing: serial changes and prognostic implications. AJR Am J Roentgenol 2012;199(5):982–989. [DOI] [PubMed] [Google Scholar]
- 26.Yamauchi H, Bando M, Baba T, et al. Clinical course and changes in high-resolution computed tomography findings in patients with idiopathic pulmonary fibrosis without honeycombing. PLoS One 2016;11(11):e0166168. [DOI] [PMC free article] [PubMed] [Google Scholar]
- 27.Best AC, Meng J, Lynch AM, et al. Idiopathic pulmonary fibrosis: physiologic tests, quantitative CT indexes, and CT visual scores as predictors of mortality. Radiology 2008;246(3):935–940. [DOI] [PubMed] [Google Scholar]
- 28.Lee SH, Park JS, Kim SY, et al. Comparison of CPI and GAP models in patients with idiopathic pulmonary fibrosis: a nationwide cohort study. Sci Rep 2018;8(1):4784. [DOI] [PMC free article] [PubMed] [Google Scholar]
- 29.Plantier L, Cazes A, Dinh-Xuan AT, Bancal C, Marchand-Adam S, Crestani B. Physiology of the lung in idiopathic pulmonary fibrosis. Eur Respir Rev 2018;27(147):170062. [DOI] [PMC free article] [PubMed] [Google Scholar]
- 30.Iwasawa T, Asakura A, Sakai F, et al. Assessment of prognosis of patients with idiopathic pulmonary fibrosis by computer-aided analysis of CT images. J Thorac Imaging 2009;24(3):216–222. [DOI] [PubMed] [Google Scholar]
- 31.Nakagawa H, Nagatani Y, Takahashi M, et al. Quantitative CT analysis of honeycombing area in idiopathic pulmonary fibrosis: correlations with pulmonary function tests. Eur J Radiol 2016;85(1):125–130. [DOI] [PubMed] [Google Scholar]
- 32.Humphries SM, Yagihashi K, Huckleberry J, et al. Idiopathic pulmonary fibrosis: data-driven textural analysis of extent of fibrosis at baseline and 15-month follow-up. Radiology 2017;285(1):270–278. [DOI] [PMC free article] [PubMed] [Google Scholar]
- 33.Lee SH, Kim SY, Kim DS, et al. Comparisons of prognosis between surgically and clinically diagnosed idiopathic pulmonary fibrosis using Gap model: a Korean national cohort study. Medicine (Baltimore) 2016;95(11):e3105. [DOI] [PMC free article] [PubMed] [Google Scholar]


