

This cross-sectional study compares use of low-value care among individuals enrolled in traditional Medicare and those enrolled in Medicare Advantage and examines trends in use from 2006 to 2015.
Key Points
Question
Were there differences in use of low-value care between individuals enrolled in traditional fee-for-service Medicare (TM) and those enrolled in Medicare Advantage (MA) from 2006 to 2015?
Findings
In this cross-sectional study of 11 677 individuals enrolled in TM and 5164 individuals enrolled in MA, there were no significant differences between individuals enrolled in TM and those enrolled in MA in most measures of use of low-value care. There was no significant decrease in most measures of use of low-value care among individuals enrolled in TM or MA over time.
Meaning
Use of low-value care is prevalent in TM and MA, suggesting that managed care enrollment is not associated with decreased use of low-value care.
Abstract
Importance
Decreasing use of low-value care is a major goal for Medicare given the potential to decrease costs and harms. Compared with traditional fee-for-service Medicare (TM), Medicare Advantage (MA) is more strongly financially incentivized to decrease use of low-value care.
Objectives
To compare use of low-value care among individuals enrolled in TM and those enrolled in MA overall and to examine trends in use of low-value care in both programs from 2006 to 2015.
Design, Setting, and Participants
This cross-sectional study analyzed individuals enrolled in TM and MA using data from the 2006 to 2015 Medical Expenditure Panel Survey. To account for differences in characteristics between individuals enrolled in TM and those enrolled in MA, a propensity score–based approach was used. Data were analyzed from August 2020 through January 2021.
Exposures
Being enrolled in MA or TM.
Main Outcomes and Measures
Binary measures of use were collected for 13 low-value services in 4 categories (ie, [1] cancer screening: cervical, colorectal, and prostate cancer screening in older adults; [2] antibiotic use: antibiotic for acute upper respiratory infection and antibiotic for influenza; [3] medication: anxiolytic, sedative, or hypnotic in an adult older than 65 years; benzodiazepine for depression; opioid for headache; opioid for back pain; and nonsteroidal anti-inflammatory drug [NSAID] for hypertension, heart failure, or chronic kidney disease; and [4] imaging: magnetic resonance imaging [MRI] or computed tomography [CT] for back pain, radiograph for back pain, and MRI or CT for headache) and 4 low-value composites corresponding to the categories (ie, cancer screening composite, antibiotic use composite, medication composite, and imaging composite).
Results
Among 11 677 individuals enrolled in TM and 5164 individuals enrolled in MA, 9429 (56.0%) were women and the mean (SD) age was 74.5 (6.3) years. Of 13 low-value services and 4 low-value composites, statistically significant differences were found in 2 measures. For the low-value medication composite, 2054 of 11 636 eligible individuals enrolled in TM (adjusted mean, 17.6%; 95% CI, 16.8%-18.3%) received the care, and 981 of 5141 eligible individuals enrolled in MA (adjusted mean, 19.7%; 95% CI, 18.3%-21.2%) received the care, for a rate of use that was significantly higher among individuals enrolled in MA, by 2.2 percentage points (95% CI, 0.5-3.8 percentage points; P = .02). For the NSAID use for hypertension, heart failure, or kidney disease metric, 807 of 7832 individuals enrolled in TM (adjusted mean, 10.0%; 95% CI, 9.2%-10.8%) received the care, and 447 of 3566 individuals enrolled in MA (adjusted mean, 12.9%; 95% CI, 19.7%-27.1%) received the care, for a rate of use that was significantly higher among individuals enrolled in MA, by 2.9 percentage points (95% CI, 1.3-4.6 percentage points; P = .001). Overall, there were no decreases in use of low-value care in TM or MA over time.
Conclusions and Relevance
This cross-sectional study found that use of low-value care was similarly prevalent in MA and TM, suggesting that MA enrollment was not associated with decreased provision of low-value care compared with TM.
Introduction
Low-value care is defined as a service that provides little to no clinical benefit but incurs health care costs.1 A significant share of health care costs in the US is of low value, estimated to account for 0.6% to 2.7% of annual health care spending2 or $75.7 billion to $101.2 billion annually.3 In some cases, low-value care can be associated with harmful patient outcomes and further unnecessary testing or treatment. Thus, decreasing use of low-value care has potential for cost savings and harm reduction in the US health care system.
Use of low-value care is especially prevalent among older adults in the US.2,4,5,6,7,8,9,10 A 2014 study2 found that among 26 low-value services in 6 categories (ie, cancer screening, diagnostic and preventive testing, preoperative testing, imaging, cardiovascular testing and procedures, and other surgical procedures), 24% to 41% of individuals enrolled in traditional fee-for-service Medicare (TM) received at least 1 low-value service in 2009. The rate of use of low-value care varied across services, ranging from 0.1% for electroencephalography for headache to 12.4% for imaging for low-risk low back pain. Among the 6 categories of low-value care, the most prevalent were imaging, which accounted for 43% of low-value care, and cancer screening, which accounted for 31% of low-value care.
Although most individuals enrolled in Medicare receive care through TM, 36% of individuals enrolled in Medicare were enrolled in Medicare Advantage (MA), known as Medicare managed care, in 2020.11 Understanding whether individuals enrolled in TM and those enrolled in MA had different rates of use of low-value care may be of high policy relevance because MA plans are financially incentivized to use lower-cost care through capitated payments. These plans can also implement network and prior authorization restrictions to control health care use. Furthermore, MA plans can offer supplemental benefits to address the needs of individuals with chronic illness.12,13 Indeed, MA tends to deliver care more efficiently than TM by increasing use of primary care visits14,15 and decreasing use of unnecessary care or intensity of care.16,17,18,19,20 However, to our knowledge, evidence on use of low-value care in MA is limited. A 2017 study5 examined use of low-value care in MA but was limited to using data from a single insurer. Evidence suggests that low-value services among individuals enrolled in MA varied widely in frequency and cost, with spending on low-value care in 2014 totaling $100.8 million for individuals enrolled in MA.5
Another important policy question is how use of low-value care in TM and MA has changed over time. Since 2012, several initiatives, including Choosing Wisely,1 have been launched to decrease use of low-value care. Evidence suggests that Choosing Wisely was associated with modest decreases in use of low-value care in TM and MA.5,6,21,22 Concurrently, new delivery models have been implemented to decrease use of unnecessary care. Evidence suggests that Medicare accountable care organization (ACO) programs were associated with decreases in use of low-value care, but the magnitude of the decreases was small.22 However, it remains unknown whether this trend occurred in both TM and MA.
We addressed these knowledge gaps regarding use of low-value care in TM and MA. First, we compared use of low-value care between individuals enrolled in TM and those enrolled in MA. Second, we examined trends in use of low-value care in the programs from 2006 to 2015.
Methods
This cross-sectional study was exempted from review and informed consent by the institutional review board of Drexel University because the data were deidentified and publicly available. Reporting followed the Strengthening the Reporting of Observational Studies in Epidemiology (STROBE) reporting guideline.
Data and Study Sample
We used data from the 2006 to 2015 Medical Expenditure Panel Survey (MEPS). The MEPS is a nationally representative survey of the US noninstitutionalized civilian population. This survey annually collects information on respondents’ demographic and socioeconomic characteristics, health status, and health care use. The data are collected in person via 3 rounds per year.
Specifically, we used the following 6 data sets from the MEPS: the full-year consolidated data files, longitudinal files, medical condition files, outpatient visit files, office-based medical clinic visit files, and prescribed medicine files. Compared with claims data, the MEPS has several strengths for comparing use of low-value care between individuals enrolled in TM and MA. First, the MEPS offers service-specific data for those enrolled in MA, which allowed us to identify these individuals’ use of low-value care. By comparison, claims data for this population is limited. Second, the MEPS provides comprehensive information on socioeconomic and health status, which are associated with rates of health services use but are imperfectly captured in claims data. Third, clinician coding patterns may be associated with differences in health risks as constructed from claims data; studies from 201423 and 202024 suggest differences in coding between MA and TM. However, the MEPS offers self-reported health status, which allowed us to control for a measure of health that is comparable across TM and MA populations.
We included individuals enrolled in Medicare for the entire year sampled and excluded those who were younger than 65 years, were dual eligible for Medicare and Medicaid, and switched between TM and MA within the year. The MEPS asked respondents whether they enrolled in MA or TM in each round of data collection (conducted 3 times every year). We defined individuals as enrolled in TM if they were continuously enrolled in the program throughout the 3 rounds in the year, and we identified individuals as enrolled in MA if they were continuously enrolled in the program throughout the 3 rounds.
Measurement of Low-Value Care
Following studies from 201625 and 201926 that identified low-value care using the MEPS, we identified 13 low-value services in 4 categories. Use of low-value care was measured as a binary outcome. For each measure,27,28,29,30,31,32,33,34,35,36 we identified individuals who were eligible for the measure (ie, the denominator) and then determined whether those individuals received the particular low-value service (ie, the numerator) (Table 1). We excluded individuals with some conditions associated with clinical red flags, because use of some care for particular conditions may not be deemed to be low value. Additionally, we constructed a composite measure for each of the 4 categories of low-value care; for these categories, use was defined as the use of any low-value service in the category.27,28,29,30,31,32,33,34,35,36
Table 1. Measures for Low-Value Care.
| Measure or composite | Source | MEPS data source | Measure (ie, numerator) | Eligible population (ie, denominator) |
|---|---|---|---|---|
| Low-value cancer screening composite | ||||
| Cervical cancer screening | Vesco et al,27 2011 | Self-report | Papanicolaou test in the given survey year | Women aged >65 y without a diagnosis of cervical cancer or other genital cancer found among women in the prior yeara |
| Colorectal cancer screening | Whitlock et al,28 2008 | Self-report | Colorectal cancer screening (ie, colonoscopy, sigmoidoscopy, or hemoccult test) in the given survey year | Individuals aged >75 y without a diagnosis of colon cancer in the prior yeara |
| Prostate cancer screening | Lin et al,29 2011 | Self-report | Prostate-specific antigen test in the given survey year | Men aged >75 y without a diagnosis of prostate cancer in the prior yeara |
| Low-value antibiotic use composite | ||||
| Antibiotic for acute upper respiratory infection | Cooper et al,30 2001 | Prescribed medicine | Antibiotic prescription during visit | Individuals with a primary diagnosis of acute upper respiratory infection without a diagnosis of bacterial infection, chronic obstructive pulmonary disease, or cancer in the given survey year (as competing diagnosis for acute upper respiratory infection)b |
| Antibiotic for influenza | Cooper et al,30 2001 | Prescribed medicine | Antibiotic prescription during visit | Individuals with a primary diagnosis of influenza without a diagnosis of bacterial infection, chronic obstructive pulmonary disease, or cancer in the given survey yearb |
| Low-value medication composite | ||||
| Anxiolytic, sedative, or hypnotic | American Geriatrics Society 2012 Beers Criteria Update Expert Panel,31 2012 | Prescribed medicine | Anxiolytic, sedative, or hypnotic prescription during visit | Individuals aged >65 y |
| Benzodiazepine for depression | Trangle et al,32 2016 | Prescribed medicine | Benzodiazepine prescription during visit | Individuals with a diagnosis of depression |
| Opioid for headache | American Academy of Neurology,33 2013 | Prescribed medicine | Opioid prescription during visit | Individuals with a diagnosis of headache but no diagnosis of pregnancy, cancer, or epilepsy in the given survey yearc |
| Opioid for back pain | American Society of Anesthesiologists,34 2014 | Prescribed medicine | Opioid prescription during visit | Individuals with a diagnosis of back pain but no diagnosis of fever or cancer in the given survey yeard |
| NSAID for hypertension, heart failure, or kidney disease | American Society of Anesthesiologists,34 2014 | Prescribed medicine | NSAID prescription during visit | Individuals with a diagnosis of hypertension, heart failure, or kidney disease in the given survey year |
| Low-value imaging composite | ||||
| MRI or CT for back pain | Chou et al,35 2009 | Outpatiente | MRI or CT scan during visit | Individuals with a diagnosis of back pain but no diagnosis of fever or cancer in the given survey yeard |
| Radiograph for back pain | Chou et al,35 2009 | Outpatiente | Radiograph during visit | Individuals with a diagnosis of back pain but no diagnosis of fever or cancer in the given survey yeard |
| MRI or CT for headache | American College of Radiology,36 2012 | Outpatiente | MRI or CT scan during visit | Individuals with a diagnosis of headache but no diagnosis of pregnancy, cancer, or epilepsy in the given survey yearc |
Abbreviations: CT, computed tomography; MEPS, Medical Expenditure Panel Survey; MRI, magnetic resonance imaging; NSAID, nonsteroidal anti-inflammatory drug.
History of cancer in prior years could not be identified, owing to lack of data availability. As an alternative, MEPS longitudinal files were used to identify individuals diagnosed with each type of cancer in the prior year.
Vaginitis and HIV could not be included as competing diagnoses because they could not be identified based on Clinical Classification Software or 3-digit International Classification of Diseases, Ninth Revision, Clinical Modification codes.
Not all conditions associated with clinical red flags (ie, HIV, neurologic symptoms [ie, weakness, sensory changes, and altered mental status], and head trauma) could be excluded, because they could not be identified based on Clinical Classification Software or 3-digit International Classification of Diseases, Ninth Revision, Clinical Modification codes.
Not all conditions associated with clinical red flags (ie, weight loss, cachexia, neurologic symptoms, spinal fracture, myelopathy, and postlaminectomy) could be excluded, because they could not be identified based on Clinical Classification Software or 3-digit International Classification of Diseases, Ninth Revision, Clinical Modification codes.
Includes office-based medical clinic visit.
The cancer composite included 3 low-value cancer screenings: cervical, colorectal, and prostate cancer screening in older adults. We used self-reports to identify use of cancer screening in a given year. Using longitudinal files, we excluded individuals diagnosed with each type of cancer in the prior year. The treatment composite had 2 low-value antibiotic use measures: antibiotic for acute upper respiratory infection and antibiotic for influenza. The medication composite had 5 measures for use of low-value medication: use of an anxiolytic, a sedative, or a hypnotic in an adult older than 65 years; use of benzodiazepine for depression; use of opioid for headache; use of opioid for back pain; and use of nonsteroidal anti-inflammatory drug (NSAID) for hypertension, heart failure, or chronic kidney disease. For measures in the treatment and medication composites, we first used the medical condition files to identify individuals eligible for each measure and then used the prescribed medicine files to identify use of specific medications or services as an indication for each condition. Use of prescription drugs was identified via drug names or therapeutic drug classes. We identified therapeutic drug classes for each prescription using the National Drug Code directory, generic names, and the Multum Lexicon therapeutic classification database (Cerner Multum). The imaging composite included 3 measures capturing use of a low-value imaging test: magnetic resonance imaging (MRI) or computed tomography (CT) for back pain, radiograph for back pain, and MRI or CT for headache. Using medical condition files, we identified individuals eligible for each measure. Then, we used outpatient visit files and office-based clinic visit files to identify use of imaging during visit. For each measure in the treatment, medication, and imaging composites, we excluded individuals with competing diagnoses or with some conditions associated with clinical red flags (Table 1).
Following studies from 201625 and 2019,26 we identified individuals enrolled in Medicare eligible for each measure using the Clinical Classification Software (CCS) for the International Classification of Diseases, Ninth Revision, Clinical Modification (ICD-9-CM).37 This software collapses diagnosis and procedure codes from the ICD-9-CM and then aggregates the codes into clinically meaningful categories that group similar conditions.
Covariates
We included individual-level demographic, socioeconomic, and health status variables. These were age, sex, race/ethnicity, marital status, family income, US census region of residence, perceived health status, perceived mental health status, presence of any limitation, presence of cognitive limitation, presence of functional limitation, presence of social limitation, and 13 chronic conditions.
Statistical Analysis
We compared unadjusted and adjusted sample characteristics between individuals enrolled in TM and those enrolled in MA. Studies from 2012 to 201938,39,40 found that individuals enrolled in MA are healthier than those enrolled in TM, making a direct comparison between the 2 groups potentially biased. To address selective enrollment, we used a propensity score–based approach. Following a 2020 study,14 we computed the inverse probability of treatment weighting (IPTW) as a propensity for enrolling in MA based on the variables described. Enrollment in MA has grown rapidly over the past decade,11 suggesting potential differences in the composition of TM and MA populations over time. To account for changes in these compositions over time, we estimated IPTW separately for 5 periods (ie, 2006-2007, 2008-2009, 2010-2011, 2012-2013, and 2014-2015). We then determined whether IPTW-weighted samples were balanced on individual-level demographic, socioeconomic, and health status variables between TM and MA populations overall as well as within each period. We also determined whether the propensity score had an adequate overlap between TM and MA populations in each period.
To estimate differences in use of low-value care between individuals enrolled in TM and those enrolled in MA, we performed logit estimation after controlling for all covariates described previously, as well as MA enrollment, periods (ie, 2006-2007, 2008-2009, 2010-2011, 2012-2013, and 2014-2015), interaction terms associated with MA enrollment and periods, interaction terms associated with census regions and periods, and share of individuals enrolled in Medicare enrolled in MA plans by year and census region. We applied IPTW while conducting the analysis. From the regression results, we calculated the mean adjusted values of the outcomes for individuals enrolled in TM and MA while holding constant all other variables except the variable of interest, allowing us to compare the outcome of interest between individuals enrolled in TM and those enrolled in MA. We then examined the difference in these adjusted mean outcomes among individuals enrolled in MA compared with those enrolled in TM.
We also examined trends in use of low-value care among individuals enrolled in TM and MA using 4 low-value care composite measures. We conducted the same analysis as described previously and estimated the adjusted mean outcomes for individuals enrolled in TM and MA in each period. Because changes in data collection may be associated with changes in trends, we compared the numbers for individuals eligible for each measure across 5 periods. We also examined whether the sample size varied by year in association with sample fluctuations.
We conducted several sensitivity analyses to determine the robustness of our findings. First, because MEPS has smaller sample sizes than claims data do, which could bias toward the null, we conducted bootstrapping with 1000 iterations to measure robust CIs. Second, we conducted a heterogeneity analysis to identify whether prevalence of low-value care varied by socioeconomic and health status. We performed the analysis stratified by race/ethnicity, family income, and perceived health status.
For all analyses, we clustered standard errors within individuals because some individuals were included in the data over the course of multiple years. We used survey weights to adjust sample characteristics to be representative of the Medicare population. All P values were from 2-sided tests, and results were deemed significant at P < .05. Study data were analyzed using Stata statistical software version 16.1 (StataCorp) from August 2020 through January 2021.
Results
Among 11 677 individuals enrolled in TM and 5164 individuals enrolled in MA, mean [SD] age was 74.5 [6.3] years and 9429 (56.0%) were women (Table 2). While there were several differences in weighted sample characteristics between TM and MA populations, differences in health status variables were marginal. In our analyses estimating IPTW, we found that MA enrollment was not associated with better health status (eTable 1 in the Supplement). These differences decreased after applying IPTW. Additionally, demographic, socioeconomic, and health status variables of individuals enrolled in TM and MA were similar in each of the 5 periods (eTable 2 in the Supplement). There was a substantial overlap in propensity scores between individuals enrolled in TM and those enrolled in MA in each of the 5 periods (eFigure in the Supplement).
Table 2. Characteristics of Individuals Enrolled in Medicare, 2006 to 2015.
| Characteristic | No. (%) | Weighted % (95% CI) | |||||
|---|---|---|---|---|---|---|---|
| Without IPTWa | With IPTW | ||||||
| TM (n = 11 677) | MA (n = 5164) | TM | MA | TM | MA | ||
| Age, y | |||||||
| 65-69 | 3391 (29.0) | 1450 (28.1) | 27.8 (27.0-28.6) | 27.4 (26.2-28.6) | 27.8 (27.0-28.6) | 28.2 (27.0-29.4) | |
| 70-74 | 2925 (25.0) | 1369 (26.5) | 25.6 (24.8-26.4) | 25.9 (24.7-27.1) | 25.7 (24.9-26.4) | 25.3 (24.1-26.5) | |
| 75-79 | 2291 (19.6) | 1074 (20.8) | 20.0 (19.2-20.7) | 20.5 (19.4-21.6) | 20.1 (19.4-20.8) | 20.3 (19.2-21.4) | |
| ≥80 | 3070 (26.3) | 1271 (24.6) | 26.6 (25.8-27.4) | 26.2 (25-27.4) | 26.4 (25.6-27.2) | 26.2 (25.0-27.4) | |
| Sex | |||||||
| Men | 5260 (45.0) | 2152 (41.7) | 45.4 (44.5-46.3) | 42.0 (40.6-43.3) | 44.4 (43.5-45.3) | 44.7 (43.4-46.1) | |
| Women | 6417 (55.0) | 3012 (58.3) | 54.6 (53.7-55.5) | 58.0 (56.6-59.3) | 55.5 (54.6-56.4) | 55.2 (53.9-56.6) | |
| Race/ethnicity | |||||||
| Non-Hispanic White | 8973 (76.8) | 3183 (61.6) | 87.6 (87.1-88.2) | 79.2 (78.1-80.3) | 84.9 (84.3-85.6) | 85.0 (84.0-86.0) | |
| Hispanic | 583 (5.0) | 780 (15.1) | 2.8 (2.5-3.1) | 8.6 (7.8-9.4) | 4.8 (4.4-5.2) | 4.7 (4.1-5.3) | |
| Non-Hispanic Black | 1553 (13.3) | 760 (14.7) | 6.1 (5.7-6.6) | 7.3 (6.6-8) | 6.4 (6-6.9) | 6.5 (5.8-7.2) | |
| Non-Hispanic Asian | 371 (3.2) | 365 (7.1) | 1.8 (1.5-2.0) | 3.8 (3.3-4.3) | 2.3 (2.1-2.6) | 2.3 (1.9-2.7) | |
| Other or multiple | 197 (1.7) | 76 (1.5) | 1.7 (1.4-1.9) | 1.1 (0.8-1.4) | 1.5 (1.3-1.7) | 1.5 (1.2-1.9) | |
| Married | 6736 (57.7) | 2820 (54.6) | 59.6 (58.7-60.5) | 56.5 (55.1-57.8) | 58.8 (57.9-59.7) | 59.0 (57.6-60.3) | |
| Family income, % of FPL | |||||||
| <200 | 3759 (32.2) | 1864 (36.1) | 27.4 (26.6-28.2) | 31.2 (29.9-32.5) | 28.5 (27.6-29.3) | 28.3 (27.1-29.5) | |
| 200-399 | 3530 (30.2) | 1737 (33.6) | 28.8 (27.9-29.6) | 32.8 (31.5-34.1) | 30.1 (29.3-30.9) | 31.0 (29.8-32.3) | |
| ≥400 | 4388 (37.6) | 1563 (30.3) | 43.8 (42.9-44.7) | 36.0 (34.7-37.3) | 41.4 (40.5-42.3) | 40.7 (39.4-42.0) | |
| US Census region | |||||||
| Northeast | 1748 (15.0) | 760 (14.7) | 17.4 (16.7-18.1) | 17.8 (16.8-18.9) | 17.4 (16.7-18.0) | 17.1 (16.1-18.1) | |
| Midwest | 3049 (26.1) | 845 (16.4) | 26.3 (25.5-27.1) | 18.4 (17.3-19.5) | 24.0 (23.3-24.8) | 24.4 (23.3-25.6) | |
| South | 5072 (43.4) | 1718 (33.3) | 41.7 (40.8-42.6) | 31.1 (29.9-32.4) | 38.5 (37.6-39.3) | 38.5 (37.1-39.8) | |
| West | 1808 (15.5) | 1841 (35.7) | 14.6 (14.0-15.2) | 32.6 (31.4-33.9) | 20.2 (19.4-20.9) | 20.0 (19.0-21.1) | |
| Perceived health status | |||||||
| Excellent, very good, or good | 9177 (78.6) | 4069 (78.8) | 80.3 (79.6-81.1) | 81.8 (80.8-82.9) | 80.8 (80.0-81.5) | 81.1 (80.0-82.1) | |
| Poor or fair | 2469 (21.1) | 1087 (21.0) | 19.4 (18.7-20.2) | 18.1 (17.0-19.1) | 19.0 (18.3-19.7) | 18.8 (17.7-19.9) | |
| Perceived mental health status | |||||||
| Excellent, very good, or good | 10 461 (89.6) | 4644 (89.9) | 90.7 (90.2-91.2) | 91.2 (90.4-92.0) | 90.9 (90.4-91.4) | 91.1 (90.3-91.9) | |
| Poor or fair | 1188 (10.2) | 513 (9.9) | 9.1 (8.6-9.6) | 8.7 (7.9-9.5) | 8.9 (8.4-9.4) | 8.8 (8.0-9.6) | |
| Limitation | |||||||
| Any | 3259 (27.9) | 1398 (27.1) | 27.0 (26.2-27.8) | 26.4 (25.2-27.6) | 26.7 (25.9-27.5) | 26.3 (25.1-27.5) | |
| Functional | 1664 (14.3) | 731 (14.2) | 13.5 (12.9-14.1) | 13.4 (12.4-14.3) | 13.3 (12.7-14.0) | 12.9 (12.0-13.8) | |
| Cognitive | 4963 (42.5) | 2067 (40.0) | 42.3 (41.4-43.2) | 40.8 (39.4-42.1) | 41.8 (40.9-42.6) | 41.7 (40.3-43.0) | |
| Social | 1949 (16.7) | 776 (15.0) | 15.9 (15.2-16.6) | 15.0 (14.1-16.0) | 15.6 (14.9-16.2) | 15.7 (14.7-16.7) | |
| Chronic condition | |||||||
| Angina | 967 (8.3) | 347 (6.7) | 8.5 (8.0-9) | 7.2 (6.5-8.0) | 8.1 (7.6-8.6) | 8.1 (7.3-8.8) | |
| Arthritis | 6877 (58.9) | 3115 (60.3) | 59.2 (58.3-60.1) | 60.5 (59.2-61.8) | 59.5 (58.6-60.4) | 59.5 (58.2-60.9) | |
| Asthma | 1011 (8.7) | 447 (8.7) | 8.8 (8.2-9.3) | 8.4 (7.6-9.1) | 8.7 (8.2-9.2) | 8.6 (7.8-9.3) | |
| Coronary heart disease | 2277 (19.5) | 893 (17.3) | 20.0 (19.2-20.7) | 18.9 (17.8-19.9) | 19.7 (18.9-20.4) | 19.8 (18.7-20.8) | |
| Diabetes | 2652 (22.7) | 1263 (24.5) | 20.7 (20.0-21.5) | 21.8 (20.7-22.9) | 21.0 (20.2-21.7) | 20.9 (19.8-22.0) | |
| Emphysema | 735 (6.3) | 312 (6.0) | 6.6 (6.2-7.1) | 6.4 (5.7-7.0) | 6.5 (6.1-7) | 6.7 (6.0-7.4) | |
| High cholesterol | 7314 (62.6) | 3313 (64.2) | 62.8 (61.9-63.6) | 64.8 (63.5-66.1) | 63.2 (62.3-64.1) | 63.5 (62.2-64.8) | |
| High blood pressure | 8121 (69.5) | 3664 (71.0) | 68.2 (67.4-69.1) | 69.1 (67.9-70.4) | 68.4 (67.6-69.3) | 68.0 (66.8-69.3) | |
| MI | 1415 (12.1) | 547 (10.6) | 12.3 (11.8-12.9) | 11.5 (10.7-12.4) | 12.2 (11.6-12.8) | 12.3 (11.4-13.2) | |
| Stroke | 3179 (27.2) | 1273 (24.7) | 28.9 (28.1-29.7) | 27 (25.8-28.2) | 28.3 (27.5-29.2) | 28.1 (26.9-29.3) | |
| Other heart condition | 1401 (12.0) | 600 (11.6) | 11.7 (11.1-12.3) | 11.8 (10.9-12.7) | 11.7 (11.1-12.3) | 11.3 (10.5-12.2) | |
| Cancer | 2626 (22.5) | 954 (18.5) | 24.9 (24.1-25.7) | 21.3 (20.2-22.4) | 23.8 (23-24.5) | 24.2 (23-25.4) | |
| AD and related dementia | 458 (3.9) | 150 (2.9) | 3.6 (3.3-4) | 2.9 (2.4-3.3) | 3.4 (3.1-3.7) | 3.3 (2.8-3.8) | |
Abbreviations: AD, Alzheimer disease; FPL, federal poverty level; IPTW, inverse probability of treatment weighting; MA, Medicare Advantage; MI, myocardial infarction; TM, traditional Medicare.
Sampling weights provided by the Medical Expenditure Panel Survey data were used.
Our IPTW-adjusted analyses found no significant differences between individuals enrolled in TM and those enrolled in MA in use of most of the measures of low-value care (Table 3). Statistically significant differences were found in 2 measures: low-value medication composite and NSAID use for hypertension, heart failure, or kidney disease. For the low-value medication composite, 2054 of 11 636 eligible individuals enrolled in TM (adjusted mean, 17.6%; 95% CI, 16.8%-18.3%) received the care, and 981 of 5141 eligible individuals enrolled in MA (adjusted mean, 19.7%; 95% CI, 18.3%-21.2%) received the care, for a rate of use that was statistically significantly higher among individuals enrolled in MA, by 2.2 percentage points (95% CI, 0.5-3.8 percentage points; P = .02). For NSAID use for hypertension, heart failure, or kidney disease, 807 of 7832 eligible individuals enrolled in TM (adjusted mean, 10.0%; 95% CI, 9.2%-10.8%) received the care, and 447 of 3566 eligible individuals enrolled in MA (adjusted mean, 12.9%; 95% CI, 19.7%-27.1%) received the care, for a rate of use that was statistically significantly higher among individuals enrolled in MA, by 2.9 percentage points (95% CI, 1.3-4.6 percentage points; P = .001). For other outcomes, use of low-value service was higher among individuals enrolled in MA than those enrolled in TM except for colorectal cancer screening, but no difference was statistically significant.
Table 3. Use of Low-Value Care, 2006 to 2015.
| Measure or composite | TM | MA | Difference, mean % (95% CI) | P value | ||||
|---|---|---|---|---|---|---|---|---|
| Eligible patients, No. | Patients receiving care, No. | Adjusted mean, % (95% CI) | Eligible patients, No. | Patients receiving care, No. | Adjusted mean, % (95% CI) | |||
| Low-value cancer screening composite | 8375 | 1577 | 18.1 (17.2-19.0) | 3793 | 659 | 18.7 (17.1-20.3) | 0.6 (−1.3 to 2.5) | .43 |
| Cervical cancer screening | 6307 | 852 | 12.6 (11.7-13.5) | 2948 | 372 | 13.3 (11.7-14.9) | 0.7 (−1.2 to 2.5) | .56 |
| Colorectal cancer screening | 4830 | 312 | 5.9 (5.2-6.6) | 2100 | 110 | 5.1 (3.9-6.4) | −0.8 (−2.2 to 0.7) | .35 |
| Prostate cancer screening | 2068 | 565 | 27.9 (25.7-30.2) | 845 | 231 | 28.8 (25.3-32.3) | 0.9 (−3.3 to 5.1) | .55 |
| Low-value antibiotic use composite | 1942 | 620 | 31.1 (28.7-33.4) | 799 | 232 | 33.2 (29.1-37.3) | 2.1 (−2.5 to 6.8) | .19 |
| Antibiotic for acute upper respiratory infection | 1658 | 557 | 33.2 (30.6-35.8) | 658 | 207 | 35.6 (31.0-40.1) | 2.3 (−2.8 to 7.5) | .19 |
| Antibiotic for influenza | 339 | 67 | 17.4 (12.8-22.0) | 167 | 27 | 17.7 (11.8-23.6) | 0.3 (−7.5 to 8.1) | .54 |
| Low-value medication composite | 11 636 | 2054 | 17.6 (16.8-18.3) | 5141 | 981 | 19.7 (18.3-21.2) | 2.2 (0.5 to 3.8) | .02 |
| Anxiolytic, sedative, or hypnotic | 11 461 | 931 | 8.2 (7.6-8.7) | 5064 | 422 | 8.9 (7.8-9.9) | 0.7 (−0.5 to 1.9) | .34 |
| Benzodiazepine for depression | 1127 | 512 | 46.4 (43.0-49.8) | 455 | 212 | 47.0 (41.9-52.1) | 0.6 (−5.5 to 6.7) | .40 |
| Opioid for headache | 331 | NAa | NAa | 140 | NAa | NAa | NAa | NA |
| Opioid for back pain | 1847 | 264 | 14.0 (12.2-15.7) | 762 | 122 | 14.6 (11.8-17.5) | 0.7 (−2.7 to 4.0) | .43 |
| NSAID for hypertension, heart failure, or kidney disease | 7832 | 807 | 10.0 (9.2-10.8) | 3566 | 447 | 12.9 (11.5-14.4) | 2.9 (1.3 to 4.6) | .001 |
| Low-value imaging composite | 2094 | 457 | 22.0 (19.9-24.1) | 870 | 174 | 23.4 (19.7-27.1) | 1.4 (−2.9 to 5.7) | .34 |
| MRI or CT for back pain | 1847 | 224 | 12.3 (10.6-14.1) | 762 | 83 | 12.5 (9.7-15.3) | 0.1 (−3.1 to 3.4) | .57 |
| Radiograph for back pain | 1847 | 284 | 15.1 (13.1-17.0) | 762 | 109 | 17.0 (13.4-20.6) | 1.9 (−2.2 to 6.0) | .31 |
| MRI or CT for headache | 331 | NAa | NAa | 140 | NAa | NAa | NAa | NA |
Abbreviations: CT, computed tomography; MA, Medicare Advantage; MRI, magnetic resonance imaging; NA, not applicable; NSAID, nonsteroidal anti-inflammatory drug; TM, traditional Medicare.
There were fewer than 5 individuals with use of low-value care.
Odds ratios (ORs) from logit estimation of use of low-value care between individuals enrolled in TM and those enrolled in MA are presented in eTable 3 in the Supplement. In subgroup analyses, there were no differences in the cancer or treatment composites. Being a non-Hispanic White individual, being in good perceived health, and having an income greater than 400% of the federal poverty level were associated with higher rates of low-value medication use in the MA population, and being in poor health was associated with higher rates of low-value imaging, as measured by the imaging composite, in the MA population (eTable 4 in the Supplement).
Our analyses also found little evidence that use of low-value care among individuals enrolled in TM and MA decreased over time. Overall, there were no decreases in low-value composite measures in TM or MA over time except for the low-value cancer screening composite, which decreased in the 2 populations similarly over time (Figure). In other words, there was a statistically significant decrease in use of low-value cancer screening composite among individuals enrolled in TM and those enrolled in MA from the 2006 to 2008 period to the 2014 to 2015 period (OR, 0.29; 95% CI, 0.11-0.77; P = .01) (Table 4), but there were no differences in the low-value cancer screening composite measure between individuals enrolled in TM and those enrolled in MA over time. However, a different trend between individuals enrolled in TM and those enrolled in MA was observed in a few composites. We found that the low-value imaging composite measure was statistically significantly higher among individuals enrolled in MA compared with individuals enrolled in TM in 2006 to 2007 (OR, 1.98; 95% CI, 1.15-3.42; P = .01), but the trend reversed, with statistically significantly higher rates among individuals enrolled in TM in 2012 to 2013 (OR, 0.39; 95% CI, 0.18-0.85; P = .02) and 2014 to 2015 (OR, 0.46; 95%, CI, 0.23-0.96; P = .04). The numbers of individuals eligible for each measure were consistent across the 5 periods (eTable 5 in the Supplement). Although the numbers of individuals eligible for each measure were higher in 2014 to 2015, this may be associated with a larger sample size in that period (eTable 6 in the Supplement).
Figure. Trends in Use of Low-Value Care From 2006 to 2015.
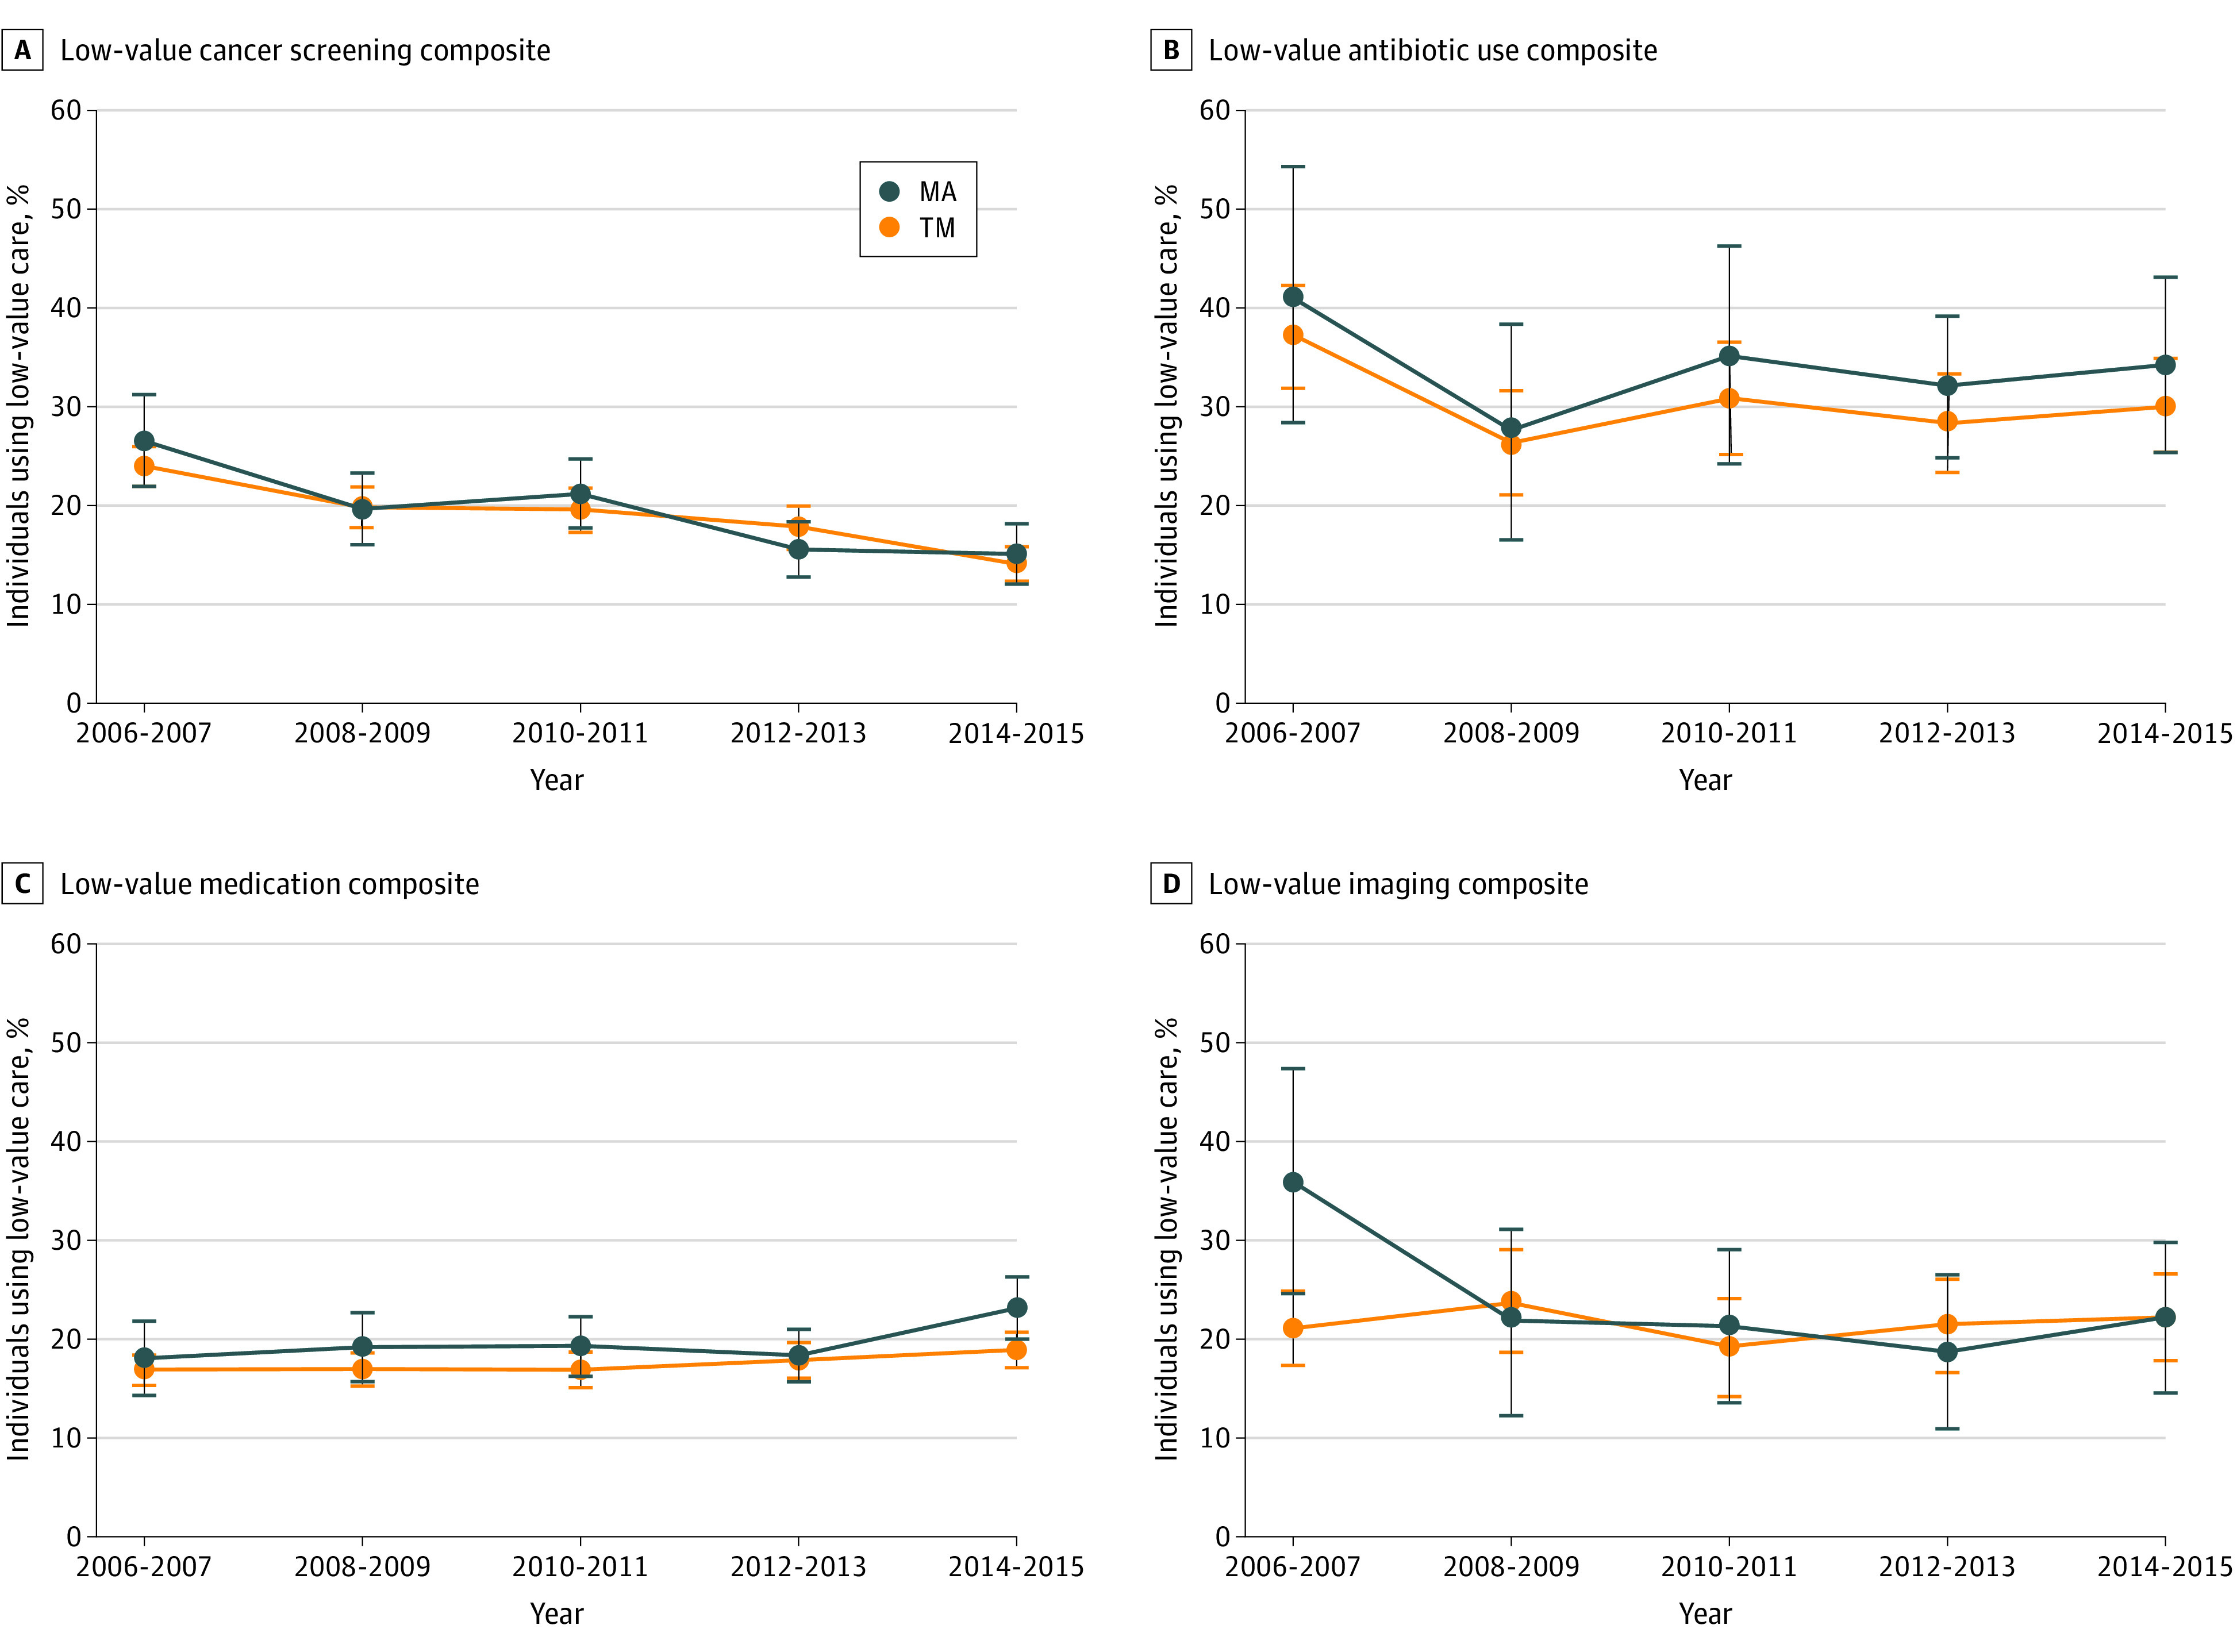
Error bars indicate 95% CIs; TM, traditional Medicare; MA, Medicare Advantage.
Table 4. Logistic Regression for Use of Low-Value Care, 2006 to 2015.
| Variable | Low-value care composite | |||||||
|---|---|---|---|---|---|---|---|---|
| Cancer screening | Antibiotic use | Medication | Imaging | |||||
| OR (95% CI)a | P value | OR (95% CI)a | P value | OR (95% CI)a | P value | OR (95% CI)a | P value | |
| MA enrollment | 1.16 (0.86-1.55) | .33 | 1.15 (0.62-2.14) | .66 | 1.11 (0.82-1.51) | .48 | 1.98 (1.15-3.42) | .01 |
| Period | ||||||||
| 2006-2007 | 1 [Reference] | NA | 1 [Reference] | NA | 1 [Reference] | NA | 1 [Reference] | NA |
| 2008-2009 | 0.78 (0.41-1.50) | .46 | 0.45 (0.13-1.62) | .22 | 0.70 (0.38-1.29) | .25 | 1.58 (0.41-6.12) | .51 |
| 2010-2011 | 0.55 (0.25-1.18) | .13 | 0.20 (0.05-0.88) | .03 | 0.75 (0.38-1.48) | .40 | 1.24 (0.31-4.95) | .76 |
| 2012-2013 | 0.44 (0.19-1.01) | .05 | 0.32 (0.07-1.40) | .13 | 1.04 (0.49-2.19) | .93 | 1.52 (0.32-7.15) | .59 |
| 2014-2015 | 0.29 (0.11-0.77) | .01 | 0.33 (0.06-1.70) | .18 | 0.98 (0.43-2.25) | .96 | 1.14 (0.20-6.68) | .88 |
| Interaction between MA and period | ||||||||
| MA × 2006-2007 | 1 [Reference] | NA | 1 [Reference] | NA | 1 [Reference] | NA | 1 [Reference] | NA |
| MA × 2008-2009 | 0.88 (0.58-1.35) | .57 | 0.94 (0.39-2.24) | .89 | 1.07 (0.72-1.61) | .73 | 0.47 (0.20-1.08) | .08 |
| MA × 2010-2011 | 0.95 (0.63-1.42) | .79 | 0.90 (0.40-2.06) | .81 | 1.07 (0.72-1.58) | .75 | 0.58 (0.26-1.30) | .19 |
| MA × 2012-2013 | 0.72 (0.48-1.10) | .13 | 1.03 (0.49-2.18) | .94 | 0.93 (0.63-1.36) | .70 | 0.39 (0.18-0.85) | .02 |
| MA × 2014-2015 | 0.95 (0.62-1.45) | .80 | 0.93 (0.43-2.00) | .86 | 1.19 (0.82-1.74) | .37 | 0.46 (0.23-0.96) | .04 |
Abbreviations: MA, Medicare Advantage; NA, not applicable; OR, odds ratio.
Findings for other covariates are not shown.
Discussion
This cross-sectional study had 2 key findings on use of low-value care among individuals enrolled in TM and MA. First, few differences were found overall in use of low-value care between TM and MA populations. Statistically significant differences were found in the low-value medication composite and the NSAID use in hypertension, heart failure, or kidney disease measure. Second, there was little evidence for decreases in use of low-value care in TM and MA over time, with a decrease found in 1 measure.
We found that use of low-value care in MA was as prevalent as in TM during the study period, suggesting that the structure of MA may not be associated with decreases in use of low-value care. These findings may appear to contradict results of studies from 2017 to 2020,16,17,18,19,20 which found that MA provided lower rates of unnecessary care and intensive care than TM. There are several potential explanations for our findings. First, a 2017 study41 found that a large share of low-value care was low cost or very low cost; MA plans may not be motivated to reduce low-cost services given that the potential for cost saving from low-cost services may be modest. Second, MA plans may promote targeted investment in areas that are associated with quality score or payment levels, but low-value care metrics may not be targeted as part of these scores or payments. Third, there may still be misaligned incentives for clinicians in MA plans to decrease provision of low-value care. Some clinicians serving individuals enrolled in MA are still operating under volume-based incentives, which are associated with less leverage in decreasing low-value care. Use of low-value services in our study was higher among individuals enrolled in MA compared with those enrolled in TM in almost all services, although the differences were statistically insignificant for most services. These findings suggest the need to reconsider the design of financial incentives in the TM and MA programs.
Our null findings for decreases in use of low-value care in TM or MA over time are consistent with the results of a 2016 study.25 This may suggest that recent efforts aimed at decreasing use of low-value care have a limited role and are associated with a limited outcome. However, 2 other findings in our study were notable. First, decreasing rates in the low-value cancer screening composite measure in both programs were of interest. This finding may suggest that it takes time to observe significant changes, owing to low participation rates in early years and time lags in changes in practice patterns. Second, individuals enrolled in MA had a higher likelihood of having a low-value imaging composite use compared with individuals enrolled in TM in 2006 to 2007, but low-value imaging composite rates remained lower among those enrolled in MA in later years. This may suggest that decreases in use of some low-value services are partly associated with MA’s more recent efforts to decrease low-value imaging services that are costly.2
Limitations
This study has several limitations. First, we could not measure all potentially relevant exclusions when identifying the use of low-value care. The MEPS reports health conditions based on CCS or 3-digit ICD-9-CM diagnosis and procedure codes, and thus we could not precisely identify individuals with competing diagnoses or exclude all conditions associated with clinical red flags. Our identification of low-value service use might thus have included some inappropriate individuals and conditions. Second, there may be selection into MA. Although we accounted for differences in sample characteristics between individuals enrolled in TM and those enrolled in MA, unobserved differences in patient factors may have remained. Third, our measure of cancer screening was self-reported and thus may be subject to reporting bias. Fourth, the MEPS reports information on medical conditions, but there may be reporting bias because individuals were not necessarily required to self-report all information and the MEPS does not verify self-reported information. Fifth, we detected statistically insignificant differences in use of some low-value care between TM and MA populations, but this might be associated with the small sample size.
Conclusions
This cross-sectional study found that there were no significant differences in most measures of use of low-value care between individuals enrolled in TM and those enrolled in MA from 2006 to 2015. These findings suggest that neither the current structure of the TM and MA programs nor recent efforts to decrease use of low-value care have been associated with significant outcomes.
eTable 1. Logistic Regression to Estimate Inverse Probability of Treatment Weighting as a Propensity for Enrolling in Medicare Advantage Based on Control Variables
eTable 2. Sample Characteristics by Period, 2006 to 2015
eTable 3. Odds Ratios From Logistic Regression of Use of Low-Value Care, 2006 to 2015
eTable 4. Subgroup Analyses of Use of Low-Value Care, 2006 to 2015
eTable 5. Descriptive Statistics of Outcomes by Period, 2006 to 2015
eTable 6. Sample Size by Year
eFigure. Propensity Scores Determination
References
- 1.Morden NE, Colla CH, Sequist TD, Rosenthal MB. Choosing Wisely—the politics and economics of labeling low-value services. N Engl J Med. 2014;370(7):589-592. doi: 10.1056/NEJMp1314965 [DOI] [PMC free article] [PubMed] [Google Scholar]
- 2.Schwartz AL, Landon BE, Elshaug AG, Chernew ME, McWilliams JM. Measuring low-value care in Medicare. JAMA Intern Med. 2014;174(7):1067-1076. doi: 10.1001/jamainternmed.2014.1541 [DOI] [PMC free article] [PubMed] [Google Scholar]
- 3.Shrank WH, Rogstad TL, Parekh N. Waste in the US health care system: estimated costs and potential for savings. JAMA. 2019;322(15):1501-1509. doi: 10.1001/jama.2019.13978 [DOI] [PubMed] [Google Scholar]
- 4.Colla CH, Morden NE, Sequist TD, Mainor AJ, Li Z, Rosenthal MB. Payer type and low-value care: comparing Choosing Wisely services across commercial and Medicare populations. Health Serv Res. 2018;53(2):730-746. doi: 10.1111/1475-6773.12665 [DOI] [PMC free article] [PubMed] [Google Scholar]
- 5.Carter EA, Morin PE, Lind KD. Costs and trends in utilization of low-value services among older adults with commercial insurance or Medicare Advantage. Med Care. 2017;55(11):931-939. doi: 10.1097/MLR.0000000000000809 [DOI] [PubMed] [Google Scholar]
- 6.Rosenberg A, Agiro A, Gottlieb M, et al. Early trends among seven recommendations from the Choosing Wisely campaign. JAMA Intern Med. 2015;175(12):1913-1920. doi: 10.1001/jamainternmed.2015.5441 [DOI] [PubMed] [Google Scholar]
- 7.Colla CH, Morden NE, Sequist TD, Schpero WL, Rosenthal MB. Choosing Wisely: prevalence and correlates of low-value health care services in the United States. J Gen Intern Med. 2015;30(2):221-228. doi: 10.1007/s11606-014-3070-z [DOI] [PMC free article] [PubMed] [Google Scholar]
- 8.Schwartz AL, Jena AB, Zaslavsky AM, McWilliams JM. Analysis of physician variation in provision of low-value services. JAMA Intern Med. 2019;179(1):16-25. doi: 10.1001/jamainternmed.2018.5086 [DOI] [PMC free article] [PubMed] [Google Scholar]
- 9.Schmajuk G, Bozic KJ, Yazdany J. Using Medicare data to understand low-value health care: the case of intra-articular hyaluronic acid injections. JAMA Intern Med. 2014;174(10):1702-1704. doi: 10.1001/jamainternmed.2014.3926 [DOI] [PMC free article] [PubMed] [Google Scholar]
- 10.Ganguli I, Lupo C, Mainor AJ, et al. Prevalence and cost of care cascades after low-value preoperative electrocardiogram for cataract surgery in fee-for-service Medicare beneficiaries. JAMA Intern Med. 2019. doi: 10.1001/jamainternmed.2019.1739 [DOI] [PMC free article] [PubMed] [Google Scholar]
- 11.Freed M, Damico A, Neuman T. A dozen facts about Medicare Advantage in 2020. Kaiser Family Foundation. Accessed February 26, 2021. https://www.kff.org/medicare/issue-brief/a-dozen-facts-about-medicare-advantage-in-2020/
- 12.Park S, Langellier BA, Burke RE. Telehealth benefits offered by Medicare Advantage plans in 2020. Med Care. 2021;59(1):53-57. doi: 10.1097/MLR.0000000000001408 [DOI] [PubMed] [Google Scholar]
- 13.Meyers DJ, Durfey SNM, Gadbois EA, Thomas KS. Early adoption of new supplemental benefits by Medicare Advantage plans. JAMA. 2019;321(22):2238-2240. doi: 10.1001/jama.2019.4709 [DOI] [PMC free article] [PubMed] [Google Scholar]
- 14.Park S, Figueroa JF, Fishman P, Coe NB. Primary care utilization and expenditures in traditional Medicare and Medicare Advantage, 2007-2016. J Gen Intern Med. 2020;35(8):2480-2481. doi: 10.1007/s11606-020-05826-x [DOI] [PMC free article] [PubMed] [Google Scholar]
- 15.Feyman Y, Figueroa JF, Polsky DE, Adelberg M, Frakt A. Primary care physician networks in Medicare Advantage. Health Aff (Millwood). 2019;38(4):537-544. doi: 10.1377/hlthaff.2018.05501 [DOI] [PubMed] [Google Scholar]
- 16.Park S, White L, Fishman P, Larson EB, Coe NB. Health care utilization, care satisfaction, and health status for Medicare Advantage and traditional Medicare beneficiaries with and without Alzheimer disease and related dementias. JAMA Netw Open. 2020;3(3):e201809. doi: 10.1001/jamanetworkopen.2020.1809 [DOI] [PMC free article] [PubMed] [Google Scholar]
- 17.Huckfeldt PJ, Escarce JJ, Rabideau B, Karaca-Mandic P, Sood N. Less intense postacute care, better outcomes for enrollees in Medicare Advantage than those in fee-for-service. Health Aff (Millwood). 2017;36(1):91-100. doi: 10.1377/hlthaff.2016.1027 [DOI] [PMC free article] [PubMed] [Google Scholar]
- 18.Park S, Larson EB, Fishman P, White L, Coe NB. Differences in health care utilization, process of diabetes care, care satisfaction, and health status in patients with diabetes in Medicare Advantage vs traditional Medicare. Med Care. 2020;58(11):1004-1012. doi: 10.1097/MLR.0000000000001390 [DOI] [PMC free article] [PubMed] [Google Scholar]
- 19.Curto V, Einav L, Finkelstein A, Levin J, Bhattacharya J. Health care spending and utilization in public and private Medicare. Am Econ J Appl Econ. 2019;11(2):302-332. doi: 10.1257/app.20170295 [DOI] [PMC free article] [PubMed] [Google Scholar]
- 20.Duggan M, Gruber J, Vabson B. The consequences of health care privatization: evidence from Medicare Advantage exits. Am Econ J: Econ Policy. 2018;10(1):153-186. doi: 10.1257/pol.20160068 [DOI] [Google Scholar]
- 21.Hong AS, Ross-Degnan D, Zhang F, Wharam JF. Small decline in low-value back imaging associated with the ‘Choosing Wisely’ campaign, 2012-14. Health Aff (Millwood). 2017;36(4):671-679. doi: 10.1377/hlthaff.2016.1263 [DOI] [PubMed] [Google Scholar]
- 22.Schwartz AL, Chernew ME, Landon BE, McWilliams JM. Changes in low-value services in year 1 of the Medicare Pioneer accountable care organization program. JAMA Intern Med. 2015;175(11):1815-1825. doi: 10.1001/jamainternmed.2015.4525 [DOI] [PMC free article] [PubMed] [Google Scholar]
- 23.Kronick R, Welch WP. Measuring coding intensity in the Medicare Advantage program. Medicare Medicaid Res Rev. 2014;4(2):mmrr2014.004.02.a06. doi: 10.5600/mmrr.004.02.sa06 [DOI] [PMC free article] [PubMed] [Google Scholar]
- 24.Geruso M, Layton T. Upcoding: evidence from Medicare on squishy risk adjustment. J Polit Econ. 2020;12(3):984-1026. doi: 10.1086/704756 [DOI] [PMC free article] [PubMed] [Google Scholar]
- 25.Levine DM, Linder JA, Landon BE. The quality of outpatient care delivered to adults in the United States, 2002 to 2013. JAMA Intern Med. 2016;176(12):1778-1790. doi: 10.1001/jamainternmed.2016.6217 [DOI] [PubMed] [Google Scholar]
- 26.Levine DM, Landon BE, Linder JA. Quality and experience of outpatient care in the United States for adults with or without primary care. JAMA Intern Med. 2019;179(3):363-372. doi: 10.1001/jamainternmed.2018.6716 [DOI] [PMC free article] [PubMed] [Google Scholar]
- 27.Vesco KK, Whitlock EP, Eder M, et al. Screening for Cervical Cancer: A Systematic Evidence Review for the U.S. Preventive Services Task Force. Agency for Healthcare Research and Quality; 2011. Accessed January 8, 2021. https://www.ncbi.nlm.nih.gov/books/NBK66099/ [PubMed] [Google Scholar]
- 28.Whitlock EP, Lin J, Liles E, et al. Screening for Colorectal Cancer: An Updated Systematic Review. Agency for Healthcare Research and Quality; 2008. Accessed January 8, 2021. https://www.ncbi.nlm.nih.gov/books/NBK35179/ [PubMed] [Google Scholar]
- 29.Lin K, Croswell JM, Koenig H, Lam C, Maltz A. Prostate-Specific Antigen-Based Screening for Prostate Cancer: An Evidence Update for the U.S. Preventive Services Task Force. Agency for Healthcare Research and Quality; 2008. Accessed January 8, 2021. https://www.ncbi.nlm.nih.gov/books/NBK82303/ [PubMed] [Google Scholar]
- 30.Cooper RJ, Hoffman JR, Bartlett JG, et al. ; American Academy of Family Physicians; American College of Physicians-American Society of Internal Medicine; Centers for Disease Control . Principles of appropriate antibiotic use for acute pharyngitis in adults: background. Ann Intern Med. 2001;134(6):509-517. doi: 10.7326/0003-4819-134-6-200103200-00019 [DOI] [PubMed] [Google Scholar]
- 31.American Geriatrics Society 2012 Beers Criteria Update Expert Panel . American Geriatrics Society updated Beers Criteria for potentially inappropriate medication use in older adults. J Am Geriatr Soc. 2012;60(4):616-631. doi: 10.1111/j.1532-5415.2012.03923.x [DOI] [PMC free article] [PubMed] [Google Scholar]
- 32.Trangle M, Gursky J, Haight R, et al. Depression, adult in primary care. Institute for Clinical Systems Improvement. Updated March 2016. Accessed January 8, 2021. https://www.icsi.org/wp-content/uploads/2019/01/Depr.pdf
- 33.American Academy of Neurology . Five things physicians and patients should question. Choosing Wisely. Accessed January 8, 2021. https://www.choosingwisely.org/societies/american-academy-of-neurology/
- 34.American Society of Anesthesiologists . Pain medicine. Choosing Wisely. Accessed January 8, 2021. https://www.choosingwisely.org/societies/american-society-of-anesthesiologists-pain-medicine/
- 35.Chou R, Fu R, Carrino JA, Deyo RA. Imaging strategies for low-back pain: systematic review and meta-analysis. Lancet. 2009;373(9662):463-472. doi: 10.1016/S0140-6736(09)60172-0 [DOI] [PubMed] [Google Scholar]
- 36.American College of Radiology . Don’t do imaging for uncomplicated headache. Choosing Wisely. Updated June 29, 2017. Accessed January 8, 2021. https://www.choosingwisely.org/clinician-lists/american-college-radiology-imaging-for-uncomplicated-headache/
- 37.US Centers for Disease Control and Prevention . International Classification of Diseases, Ninth Revision, Clinical Modification (ICD-9-CM). Accessed February 8, 2021. https://www.cdc.gov/nchs/icd/icd9cm.htm
- 38.McWilliams JM, Hsu J, Newhouse JP. New risk-adjustment system was associated with reduced favorable selection in Medicare Advantage. Health Aff (Millwood). 2012;31(12):2630-2640. doi: 10.1377/hlthaff.2011.1344 [DOI] [PMC free article] [PubMed] [Google Scholar]
- 39.Newhouse JP, Price M, McWilliams JM, Hsu J, McGuire TG. How much favorable selection is left in Medicare Advantage? Am J Health Econ. 2015;1(1):1-26. doi: 10.1162/ajhe_a_00001 [DOI] [PMC free article] [PubMed] [Google Scholar]
- 40.Newhouse JP, Price M, McWilliams JM, Hsu J, Souza J, Landon BE. Adjusted mortality rates are lower for Medicare Advantage than traditional Medicare, but the rates converge over time. Health Aff (Millwood). 2019;38(4):554-560. doi: 10.1377/hlthaff.2018.05390 [DOI] [PMC free article] [PubMed] [Google Scholar]
- 41.Mafi JN, Russell K, Bortz BA, Dachary M, Hazel WA Jr, Fendrick AM. Low-cost, high-volume health services contribute the most to unnecessary health spending. Health Aff (Millwood). 2017;36(10):1701-1704. doi: 10.1377/hlthaff.2017.0385 [DOI] [PMC free article] [PubMed] [Google Scholar]
Associated Data
This section collects any data citations, data availability statements, or supplementary materials included in this article.
Supplementary Materials
eTable 1. Logistic Regression to Estimate Inverse Probability of Treatment Weighting as a Propensity for Enrolling in Medicare Advantage Based on Control Variables
eTable 2. Sample Characteristics by Period, 2006 to 2015
eTable 3. Odds Ratios From Logistic Regression of Use of Low-Value Care, 2006 to 2015
eTable 4. Subgroup Analyses of Use of Low-Value Care, 2006 to 2015
eTable 5. Descriptive Statistics of Outcomes by Period, 2006 to 2015
eTable 6. Sample Size by Year
eFigure. Propensity Scores Determination