

Abstract
Objectives:
Administrative claims data are commonly used for sepsis surveillance, research, and quality improvement. However, variations in diagnosis, documentation, and coding practices for sepsis and organ dysfunction may confound efforts to estimate sepsis rates, compare outcomes, and perform risk-adjustment. We evaluated hospital variation in the sensitivity of claims data relative to clinical data from electronic health record (EHRs) and its impact on outcome comparisons.
Design, Setting, and Patients:
Retrospective cohort study of 4.3 million adult encounters at 193 U.S. hospitals in 2013-2014.
Interventions:
None.
Measurements and Main Results:
Sepsis was defined using EHR-derived clinical indicators of presumed infection (blood culture draws and antibiotic administrations) and concurrent organ dysfunction (vasopressors, mechanical ventilation, doubling in creatinine, doubling in bilirubin to ≥2.0 mg/dL, decrease in platelets to <100 cells/μL, or lactate ≥2.0 mmol/L). We compared claims for sepsis (severe sepsis/septic shock codes) and organ dysfunction to clinical criteria and measured correlations of hospitals’ sepsis incidence and mortality rates between both methods. All estimates were reliability-adjusted to account for random variation using hierarchical logistic regression modeling. The sensitivity of hospitals’ claims data was low and variable: median 30% (range 5-54%) for sepsis, 66% (range 26-84%) for acute kidney injury, 39% (range 16-60%) for thrombocytopenia, 36% (range 29-44%) for hepatic injury, and 66% (range 29-84%) for shock. Correlation between claims and clinical data was moderate for sepsis incidence (Pearson coefficient 0.64) and mortality (0.61). Among hospitals in the lowest sepsis mortality quartile by claims, 46% shifted to higher mortality quartiles using clinical data. Using implicit sepsis criteria based on infection and organ dysfunction codes also yielded major differences versus clinical data.
Conclusions:
Variation in the accuracy of claims data for identifying sepsis and organ dysfunction limits their use for comparing hospitals’ sepsis rates and outcomes. Using objective clinical data may facilitate more meaningful hospital comparisons.
Keywords: sepsis, organ dysfunction, surveillance, hospital outcomes, administrative data
INTRODUCTION
Sepsis afflicts approximately 1.7 million adults each year in the U.S. and potentially contributes to up to 270,000 in-hospital deaths.[1] Prior studies have reported that risk-adjusted sepsis mortality rates derived from claims data vary substantially between hospitals, suggesting that there is ample room to improve sepsis care in many institutions.[2-5] Local and national initiatives consequently seek to encourage best practices and benchmark the quality of sepsis care provided by hospitals.
Comparing trends and differences in hospitals’ sepsis rates and outcomes could help drive quality improvement efforts. Administrative claims data are commonly used for sepsis surveillance and comparisons, but recent analyses suggest that temporal trends in sepsis incidence and mortality using claims are biased by rising sepsis awareness and more diligent coding of sepsis and organ dysfunction over time.[1, 6-12] It is unknown, however, whether claims data can be used to compare hospital sepsis rates and outcomes in the same time period and reliably identify low or high-performing hospitals, or if variability in diagnosis, documentation, and coding practices limits their use for this purpose as well. Variability in diagnosing organ dysfunction could also impact sepsis case-finding strategies that use combinations of infection and organ dysfunction codes as well as risk-adjustment methods that incorporate present-on-admission organ dysfunction codes.[4, 5]
The aim of this study was to evaluate variation in the sensitivity of claims data for sepsis and acute organ dysfunction in U.S. acute care hospitals relative to detailed clinical criteria derived from electronic health records (EHR). We further examined the correlation between claims versus clinical data for comparing hospital sepsis incidence and mortality rates and the degree to which hospitals’ relative mortality rankings differed using either method.
METHODS
Study Design, Data Sources, and Population
This was a retrospective cohort study utilizing EHR and administrative data from adult patients (age ≥20) admitted as inpatients in calendar years 2013 or 2014 at 193 U.S. acute care hospitals. These hospitals were drawn from six datasets: Brigham and Women’s Hospital, Cerner HealthFacts, Emory Healthcare, HCA Healthcare, the Institute of Health Metrics, and UPMC. These datasets, which have previously been described in detail, together include a diverse mix of academic and community hospitals.[1] The study was approved with a waiver of informed consent by the Institutional Review Boards at Harvard Pilgrim Health Care Institute, Partners HealthCare, University of Pittsburgh, and Emory University.
Claims versus Clinical Criteria for Sepsis and Organ Dysfunction
Our primary claims-based method for identifying sepsis was an “explicit” definition that requires International Classification of Diseases, Ninth Revision, Clinical Modification (ICD-9-CM) codes for severe sepsis (995.92) or septic shock (785.52). Secondarily, we also examined an “implicit” definition that requires at least one infection code and one organ dysfunction code (or explicit severe sepsis or septic shock codes alone) since this method is more sensitive than explicit codes and is commonly used to characterize sepsis epidemiology and compare hospitals.[2, 3, 13, 14]
Our primary EHR-based method for identifying sepsis was a validated surveillance definition that requires clinical indicators of organ dysfunction concurrent with presumed serious infection.[1] Presumed serious infection was defined as ≥1 blood culture order and initiation of a new systemic antibiotic 2 days prior to the blood culture order to 2 days after, with continuation of antibiotics for ≥4 consecutive days (or fewer if death or discharge to hospice or another acute care hospital occurred prior to 4 days). Concurrent organ dysfunction was defined as initiation of vasopressors, initiation of mechanical ventilation, doubling in baseline creatinine, doubling in total bilirubin to ≥2.0 mg/dL, or decrease in platelet count to <100 cells/L within +/−2 days relative to the blood culture order date (Supplemental Table 1). These thresholds were selected to mirror Sequential Organ Failure Assessment (SOFA) organ dysfunction scores ≥2 as well as the Risk, Injury, Failure, Loss of kidney function, and End-stage kidney disease (RIFLE) criteria for acute kidney injury, but adapted for automated implementation using routine EHR data. [1, 11, 15, 16] We also included a criterion for elevated lactate since it was part of the consensus definitions for severe sepsis in use during the study time period.[17-19] We identified mechanical ventilation using ICD-9-CM procedure codes (96.7, 96.71, 96.72) or Current Procedural Terminology codes (94002-94004, 94656-94657) since other structured clinical indicators of respiratory failure were unavailable in our datasets.
We also assessed the sensitivity of explicit and implicit claims-based sepsis definitions for bacteremic shock since this is a rare but unambiguous event that all clinicians would agree constitutes “sepsis.”[20] Bacteremic shock was defined as the presence of positive blood cultures (excluding common skin contaminants) with concurrent vasopressors within +/−2 days.[21]
Finally, we evaluated the sensitivity of claims codes for organ dysfunction relative to EHR data using similar thresholds as above (Supplemental Table 2). We focused on acute kidney injury, hepatic injury, and thrombocytopenia since these can be objectively defined using routine laboratory data. We also examined hypotension/shock codes relative to vasopressors. We did not examine the sensitivity of respiratory failure codes since our only clinical measures of respiratory dysfunction were procedure codes for mechanical ventilation. Our organ dysfunction comparisons were conducted in all patients with ≥1 blood culture obtained during hospitalization, with or without antibiotics, in order to maintain a large denominator while still focusing on encounters where there was some suspicion of infection.
Outcomes for Hospital Comparisons and Reliability Adjustment
We calculated the sensitivity of sepsis and organ dysfunction codes relative to EHR clinical criteria at the hospital level. We also calculated each hospital’s sepsis incidence rate (using all adult hospitalizations as the denominator) and sepsis in-hospital mortality rates using claims versus the primary clinical sepsis surveillance definition. We did not examine the specificity of codes since we selected high clinical thresholds for organ dysfunction to provide unambiguous reference comparisons for sensitivity; in this scenario, specificity is less meaningful (e.g., patients can have hypotension without requiring vasopressors).
In order to minimize random statistical noise from hospitals with small numbers of sepsis and organ dysfunction cases, we only included study hospitals that had ≥50 hospitalizations with explicit sepsis codes and ≥50 cases meeting clinical criteria for sepsis during the two-year study period. After excluding hospitals that did not meet these minimum case counts, we performed reliability adjustment using random effects logistic regression models to generate empirical Bayes estimates of the sensitivity of each hospitals’ claims data and for sepsis incidence and mortality rates.[22, 23] This method is used in hospital comparisons to account for variations in denominators; when denominators are small, very low or very high outcome rates are more likely to be due to chance than to true differences in hospital performance.[2] The model shrinks point estimates back towards the average rate, with the degree of shrinkage proportional to hospital sample size and the amount of true variation across hospitals. We used the normality assumption to generate 95% confidence intervals for reliability-adjusted outcomes.
Analyses
We calculated the reliability-adjusted median, minimum and maximum, and interquartile range of hospital coding sensitivity rates for sepsis and each organ dysfunction. We quantified the correlation between claims versus EHR-based clinical estimates of hospitals’ reliability-adjusted sepsis incidence and mortality rates using Pearson’s correlation coefficients (r). We ranked all hospitals by reliability-adjusted sepsis mortality rates using claims and clinical criteria and examined how hospitals’ relative rankings within quartiles differed using either method. We did not perform any risk-adjustment since our goal was to examine whether and how observed mortality varies among hospitals using claims versus clinical data rather than attempting to gauge true differences in the quality of care delivered by hospitals.
The comparisons of sepsis rates and mortality by claims versus EHR clinical data were conducted using the entire cohort of 193 hospitals drawn from all 6 datasets. Based on data availability, the analyses of the sensitivity of organ dysfunction and sepsis codes were only conducted in the 178 hospitals in the Cerner, Hospital Corporation of America, and Institute of Health Metrics datasets.
Analyses were conducted using SAS version 9.4 (SAS Institute, Cary, NC) and R version 3.3.1 (r-project.org). All tests of significance used two-sided p-values at ≤0.05.
RESULTS
Study Cohort
The study cohort included 4,323,303 adult hospitalizations in 193 hospitals during calendar years 2013 and 2014. There were 1,154,061 hospitalizations with blood culture draws, 505,738 with implicit sepsis codes, 117,293 with explicit sepsis codes, and 266,383 meeting clinical criteria for sepsis. The characteristics of study hospitals and case counts are summarized in Table 1.
Table 1.
Study Hospitals Characteristics and Case Counts of Suspected Infection, Organ Dysfunction, and Sepsis
| Hospital Characteristic | Distribution Among Study Hospitals (N=193) |
|---|---|
| Regiona | |
| Northeast (N, %) | 25 (13.1%) |
| Midwest | 14 (7.3%) |
| South | 118 (61.8%) |
| West | 34 (17.8%) |
| Teaching Status | |
| Teaching | 64 (33.2%) |
| Nonteaching | 129 (66.8%) |
| Number of Hospital Bedsb | |
| <200 (Small) | 73 (38.8%) |
| 200-499 (Medium) | 98 (52.1%) |
| 500+ (Large) | 17 (9.0%) |
| Hospital Case Counts for Adult Hospitalizations, 2013-2014 | |
| All Inpatient Encounters (Median, IQR) | 19,768 (9,933-29,893) |
| Suspected Infectionc (Median, IQR) | 5,164 (2,804-8,021) |
| Suspected Infectionc + Acute Kidney Injury codes (Median, IQR)d | 1,291 (675-2,040) |
| Suspected Infectionc + Acute Liver Injury codes (Median, IQR) d | 64.5 (32-104) |
| Suspected Infectionc + Thrombocytopenia codes (Median, IQR) d | 350.5 (156-573) |
| Suspected Infectionc + Hypotension / shock codes (Median, IQR) d | 426 (149-911) |
| Implicit Sepsis Codes (Median, IQR) | 2,284 (1,119-3,602) |
| Explicit Sepsis Codes (Median, IQR) | 518 (258-823) |
| Sepsis Clinical Surveillance Definition (Median, IQR) | 1,066 (521-1,886) |
Data on region was missing in 22 hospitals (1.0%).
Data on hospital beds was missing in 5 hospitals (2.5%).
Suspected infection refers to hospital encounters with ≥1 blood culture order.
Analyses of suspected infection + organ dysfunction codes were conducted in 178 hospitals; all other analyses were conducted in all 193 hospitals.
Sensitivity of Claims Data Relative to EHR Clinical Criteria
Among hospitalizations meeting EHR-based clinical criteria for sepsis, the sensitivity of hospitals’ claims data ranged from 5 to 54% for explicit sepsis codes (median 30%, IQR 25-35%) and from 42% to 80% for implicit codes (median 65%, IQR 61-70%) (Figure 1A). Among hospitalizations with bacteremic shock, the sensitivity of explicit sepsis codes ranged from 8% to 94% (median 80%, IQR 68-85%) and 48% to 97% for implicit codes (median 92%, IQR 88-94%).
Figure 1. Sensitivity of A) sepsis codes and B) organ dysfunction codes relative to clinical criteria.
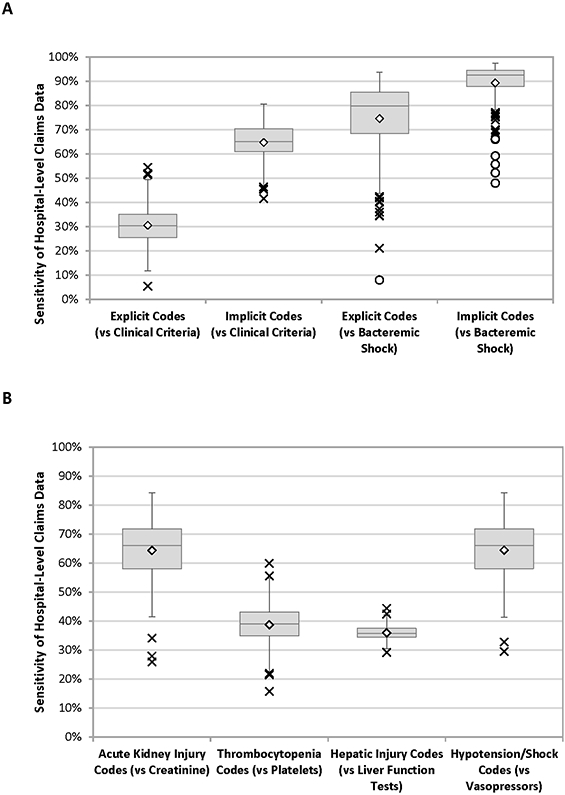
Boxes indicate the median hospital sensitivity (middle line), 25th quartile (lower box line), and 75th quartile (upper box line). Diamonds indicate the mean hospital sensitivity. Outliers are indicated by X (near outliers) and O (far outliers), as defined by values more than 1.5 times the interquartile range from the interior quartile boxes. The organ dysfunction comparisons in Figure 1B were conducted in hospitalizations with ≥1 blood culture draw.
Among hospitalizations with blood culture draws meeting EHR-based clinical criteria for organ dysfunction, the sensitivity of hospitals’ claims data ranged from 26% to 84% for acute kidney injury (median 66%, IQR 58-72%), 16% to 60% for thrombocytopenia codes (median 39%, IQR 35-43%), 29% to 44% for hepatic injury codes (median 36%, IQR 34-37%), and 29% to 84% for hypotension/shock codes (median 66%, IQR 58-72%) (Figure 1B).
Only one of the low sensitivity hospital outliers in Figure 1A was repeatedly an outlier for both explicit and implicit sepsis codes relative to clinical criteria and bacteremic shock. None of the outlier hospitals in Figure 1B were repeatedly outliers for other organ dysfunction types.
Claims vs EHR Clinical Data for Determining Hospital Sepsis Rates and Outcomes
The reliability-adjusted incidence of sepsis among hospitals ranged from 0.3% to 9.4% (median 2.6%, IQR 2.0%-3.2%) using explicit sepsis codes, from 3.2% to 29.9% (median 11.6%, IQR 9.8%-13.4%) using implicit sepsis codes, and from 1.1% to 17.1% (median 5.9%, IQR 4.7%-7.4%) using clinical criteria. There was also substantial variation in hospitals’ sepsis mortality rates using all definitions, ranging from 13.7% to 36.8% using explicit sepsis codes (median 24.8%, IQR 21.1%-27.9%), from 5.5% to 18.0% using implicit codes (median 9.8%, IQR 8.0%-11.2%), and from 6.5%-30.8% using clinical criteria (median 15.5%, IQR 13.1%-17.4%). The distribution of hospital sepsis mortality rates using explicit sepsis codes versus clinical criteria is shown in Figure 2.
Figure 2. Histogram of hospital sepsis mortality rates by explicit sepsis codes and clinical criteria.
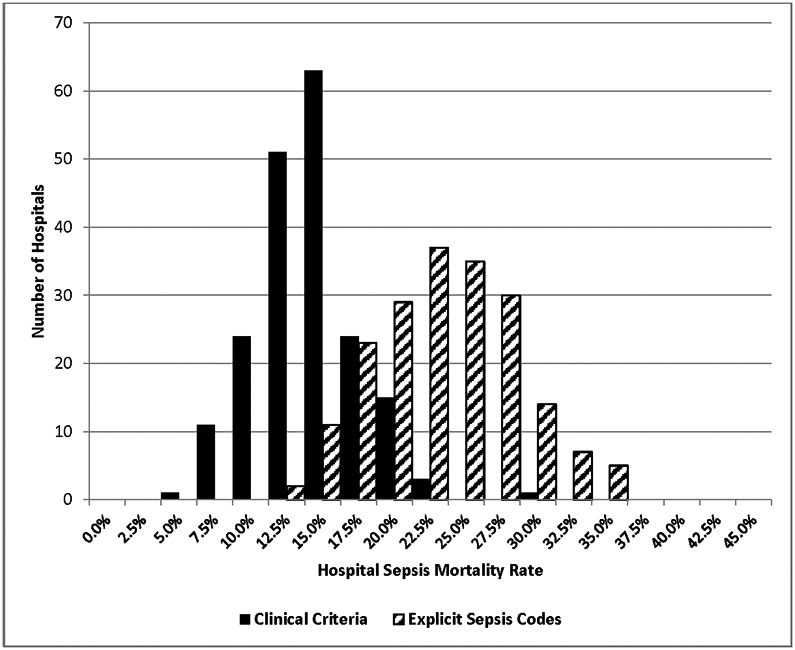
All mortality rates are reliability-adjusted.
There was moderate correlation between hospitals’ sepsis incidence rates measured using explicit sepsis codes versus clinical criteria (r=0.64, 95% CI 0.54-0.71) and using implicit codes versus clinical criteria (r=0.64, 95% CI 0.55-0.72). Similarly, there was moderate correlation between hospitals’ sepsis mortality rates using explicit sepsis codes (r=0.61, 95% CI 0.51-0.69) and implicit sepsis codes (r=0.69, 95% CI 0.61-0.76) versus clinical criteria. The relationship between hospitals’ sepsis mortality rates by clinical vs claims data when ranked according to clinical criteria is shown in Figure 3.
Figure 3. Hospital sepsis mortality rates ranked by clinical criteria and compared to claims data.
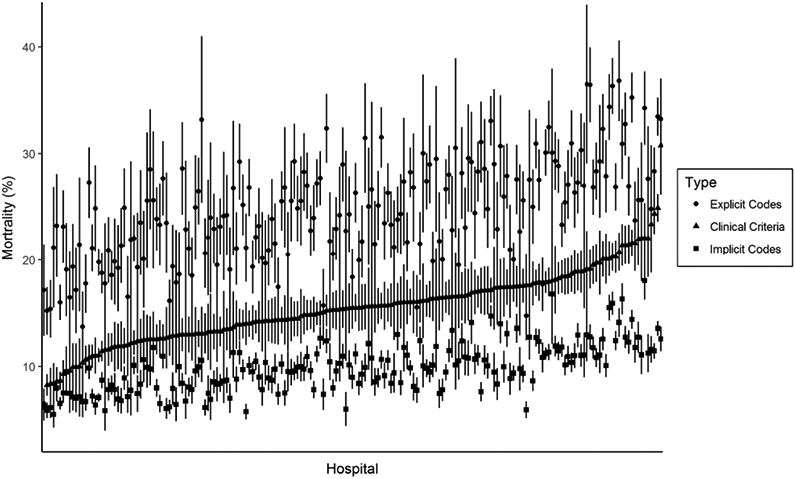
Hospitals are ranked from left to right according to mortality rates for sepsis as defined by clinical criteria (triangles). For each hospital, the corresponding sepsis mortality by explicit sepsis codes (circles) and implicit codes (squares) is displayed. All mortality rates are reliability-adjusted.
After ranking all 193 hospitals by sepsis mortality, 22 out of 48 (46%) of hospitals ranked in the lowest mortality quartile by explicit sepsis codes shifted into the second, third, or fourth quartile when using clinical criteria; 10/48 (21%) shifted by two or three quartiles (Figure 4A). Similarly, 17/48 (35%) of hospitals in the lowest mortality rate quartile by implicit sepsis codes shifted into higher mortality quartiles when using clinical criteria, including 5/48 (10%) that shifted into quartiles 3 or 4 (Figure 4B). Twenty-eight of the 193 hospitals (15%) had sepsis mortality rankings by explicit sepsis codes that differed by 2 or more quartiles relative to clinical criteria; 12 of these 28 hospitals (43%) also differed by 2 or more quartiles by implicit sepsis codes relative to clinical criteria.
Figure 4. Concordance of hospital sepsis mortality rates when ranked into quartiles by A) explicit sepsis codes and B) implicit sepsis codes versus clinical criteria.
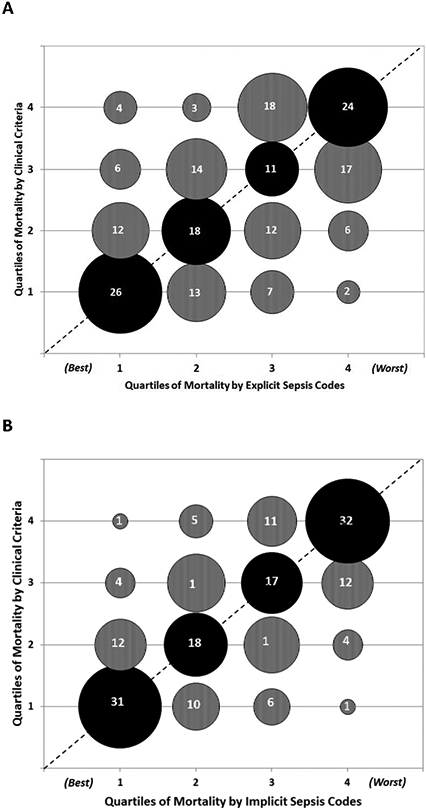
Bubble sizes are proportional to the number of hospitals in each matched quartile. The actual number of hospitals in each category is denoted within the bubbles.
The dotted line indicates where all hospitals / bubbles would lie if concordance was perfect between claims and clinical definitions.
Lower quartiles indicate better performance (i.e., quartile 1 = lowest sepsis mortality, quartile 4 = highest sepsis mortality).
Black bubbles = mortality quartiles that match between clinical criteria versus claims data.
Grey bubbles above the dotted line = quartiles that are worse by clinical criteria versus claims data. Grey bubbles below the dotted line = quartiles that are better by clinical criteria versus claims data.
DISCUSSION
Using EHR clinical data from a large cohort of U.S. hospitals, we found that the sensitivity of claims data for identifying sepsis and organ dysfunction was highly variable and the correlation between hospitals’ sepsis incidence and mortality rates using claims versus clinical criteria was only moderate. The relative rankings of hospitals for sepsis mortality rates differed substantially when using claims data versus clinical data; almost half the hospitals in the lowest mortality quartile according to claims shifted to higher mortality quartiles when using clinical data.
Substantial variations in sepsis outcomes across hospitals and regions have previously been reported using claims data, even after adjusting for severity of illness.[2-5] Our findings suggest, however, that caution should be exercised when using claims data to measure variation in hospitals’ sepsis outcomes. Our results are consistent with a recent analysis demonstrating that agreement between septic shock codes and clinical criteria based on intravenous antibiotics, blood cultures, and vasopressors for identification of outlier hospitals in septic shock mortality was only moderate [4]. Our study expands on this analysis to include the full spectrum of sepsis and demonstrates the variable sensitivity of claims data for each type of sepsis-associated organ dysfunction. Our findings also underscore the differences in sepsis cohorts identified by different surveillance methods. In particular, explicit sepsis codes have high specificity but low sensitivity and capture the most severely ill patients, while implicit codes have better sensitivity but lower specificity and identify a cohort with lower mortality rates.[1, 14, 24, 25]
Surveys of healthcare information managers have shown that general coding practices are variable[26, 27], but this is likely even worse with sepsis due to the subjectivity inherent in making the diagnosis.[20] Sepsis has no pathologic gold standard and it is often unclear whether a patient is infected and whether organ dysfunction is due to infection or some other inflammatory condition.[28] This subjectivity is compounded by variable thresholds for defining organ dysfunction. For example, there are multiple definitions for acute kidney injury [16, 29], which differ from thresholds used in the SOFA score and other ICU-based organ dysfunction scores.[15, 30, 31]
Currently, the national SEP-1 quality measure requires manual review of patients diagnosed with sepsis in order to benchmark hospital adherence to sepsis bundles.[32] Our findings suggest there may be substantial variation between hospitals in the cases selected for SEP-1 review. The EHR-based clinical surveillance definition used in this study may present a more objective option for identifying sepsis compared to claims data. Tracking sepsis incidence and outcomes using more consistent criteria could drive further innovation and improvements in care, similar to how national comparative data helped spur widespread efforts to decrease central line-associated bloodstream infection rates and objective surveillance for ventilator-associated events has improved knowledge around best practices for mechanically ventilated patients.[33-36] The U.S. Centers for Disease Control and Prevention (CDC) recently released an “Adult Sepsis Event” toolkit to help hospitals implement the surveillance definition used in this study.[21] Although its primary purpose is to help hospitals better track their sepsis rates and outcomes, it could also potentially serve as a starting point for hospital comparisons if coupled with rigorous risk-adjustment tools.
The need for risk-adjustment when comparing hospitals is underscored by the substantial variation in sepsis mortality rates observed in our cohort even when using clinical criteria. It is unclear the extent to which this represents differences in sepsis case mix across hospitals, differences in sepsis care, or both.[37] Several sepsis risk-adjustment scores have already been developed, but most rely on administrative claims data and thus may be susceptible to the variability observed in this study.[4, 5, 38, 39] In particular, the variation in sensitivity of organ dysfunction codes we observed may confound risk-adjustment methods that incorporate these codes when present-on-admission.
Our study has several limitations. First, the study cohort utilized a convenience sample of hospitals with overrepresentation of hospitals in the South and may not be generalizable to the rest of the country. However, the hospital cohort was diverse with respect to teaching status and bed size. Second, we did not review medical records to confirm the accuracy of our EHR-based organ dysfunction criteria. Indeed, multiple definitions for organ dysfunction exist with no single consensus standard. However, we used high clinical thresholds that most clinicians likely would agree indicate organ dysfunction, and our primary goal was to examine the relative variability that exists across hospitals when using a consistent definition rather than to describe the absolute sensitivity of these codes relative to a single reference standard. Third, we cannot separate out the degree to which variability in claims data was due to differences in coding practices versus physician diagnosis and documentation practices (which govern hospital coding). Fourth, for our EHR-based sepsis criteria, we used procedure codes for mechanical ventilation since EHRs do not consistently contain reliable clinical indicators of respiratory dysfunction (blood gases are not always obtained in all patients with respiratory failure and when obtained FiO2 and venous versus arterial source are variably documented). However, prior work has demonstrated that administrative definitions for mechanical ventilation are reasonably accurate in identifying patients with respiratory failure.[40] Fifth, our data source utilized ICD-9-CM codes and future studies will need to determine to what extent our findings still hold true in the current ICD-10 era.
Lastly, there is no true gold standard for sepsis [28]; our clinical criteria for sepsis relied on physician judgements to draw blood cultures, initiate and continue antibiotics, and to diagnose and manage organ dysfunction and are thus an imperfect reference standard for comparison. However, these clinical actions are the cornerstones of sepsis management and our approach has the merit of using consistent criteria based on EHR data that are measured and reported in a relatively uniform manner across hospitals.[7] The validity of our findings is also strengthened by the substantial variability we observed in the sensitivity of sepsis codes for bacteremic shock, a rare but unambiguous form of sepsis.
In conclusion, hospitals varied significantly in the sensitivity of their claims data for organ dysfunction and sepsis, with only moderate correlation between sepsis incidence and mortality rates measured by claims versus clinical data and substantial differences in hospitals’ sepsis mortality rankings. Variations in diagnosis, documentation, and coding practices may confound efforts to risk-adjust and benchmark hospital performance. Objective sepsis surveillance using clinical data from EHRs, with rigorous adjustments for severity-of-illness, may facilitate more meaningful comparisons among hospitals in the future.
Supplementary Material
Acknowledgements:
We thank Richard Platt, MD, MS, Harvard Medical School / Harvard Pilgrim Health Care Institute, and Jonathan B. Perlin, MD, HCA Healthcare, for their support and review of the manuscript.
Financial Support: This work was supported by the Centers for Disease Control and Prevention (3U54CK000172-05S2) and in part by the Agency for Healthcare Research and Quality (K08HS025008 to C.R.), departmental funds from Harvard Pilgrim Health Care Institute, intramural funds from the National Institutes of Health Clinical Center and National Institute of Allergy and Infectious Diseases, and the National Institutes of Health (R35GM119519 to C.W.S. and D.C.A.). The findings and conclusions in this report are those of the authors and do not necessarily represent the official position of the Centers for Disease Control and Prevention, the Agency for Healthcare Research and Quality, or the National Institutes of Health.
Footnotes
Potential conflicts of interest: None of the authors have any conflicts to disclose.
REFERENCES
- 1.Rhee C, Dantes R, Epstein L et al. : Incidence and Trends of Sepsis in US Hospitals Using Clinical vs Claims Data, 2009-2014. JAMA 2017, 318(13):1241–1249. [DOI] [PMC free article] [PubMed] [Google Scholar]
- 2.Prescott HC, Kepreos KM, Wiitala WL et al. : Temporal Changes in the Influence of Hospitals and Regional Healthcare Networks on Severe Sepsis Mortality. Crit Care Med 2015, 43(7):1368–1374. [DOI] [PMC free article] [PubMed] [Google Scholar]
- 3.Wang HE, Donnelly JP, Shapiro NI et al. : Hospital variations in severe sepsis mortality. Am J Med Qual 2015, 30(4):328–336. [DOI] [PubMed] [Google Scholar]
- 4.Walkey AJ, Shieh MS, Liu VX et al. : Mortality Measures to Profile Hospital Performance for Patients With Septic Shock. Crit Care Med 2018. [DOI] [PMC free article] [PubMed] [Google Scholar]
- 5.Hatfield KM, Dantes RB, Baggs J et al. : Assessing Variability in Hospital-Level Mortality Among U.S. Medicare Beneficiaries With Hospitalizations for Severe Sepsis and Septic Shock. Crit Care Med 2018. [DOI] [PMC free article] [PubMed] [Google Scholar]
- 6.Rhee C, Gohil S, Klompas M: Regulatory mandates for sepsis care--reasons for caution. N Engl J Med 2014, 370(18):1673–1676. [DOI] [PMC free article] [PubMed] [Google Scholar]
- 7.Klompas M, Rhee C: We Need Better Tools for Sepsis Surveillance. Crit Care Med 2016, 44(7):1441–1442. [DOI] [PubMed] [Google Scholar]
- 8.Rudd KE, Delaney A, Finfer S: Counting Sepsis, an Imprecise but Improving Science. JAMA 2017, 318(13):1228–1229. [DOI] [PubMed] [Google Scholar]
- 9.Rhee C, Kadri S, Huang SS et al. : Objective Sepsis Surveillance Using Electronic Clinical Data. Infect Control Hosp Epidemiol 2016, 37(2):163–171. [DOI] [PMC free article] [PubMed] [Google Scholar]
- 10.Kadri SS, Rhee C, Strich JR et al. : Estimating Ten-Year Trends in Septic Shock Incidence and Mortality in United States Academic Medical Centers Using Clinical Data. Chest 2017, 151(2):278–285. [DOI] [PMC free article] [PubMed] [Google Scholar]
- 11.Rhee C, Murphy MV, Li L et al. : Improving documentation and coding for acute organ dysfunction biases estimates of changing sepsis severity and burden: a retrospective study. Crit Care 2015, 19:338. [DOI] [PMC free article] [PubMed] [Google Scholar]
- 12.Jafarzadeh SR, Thomas BS, Marschall J et al. : Quantifying the improvement in sepsis diagnosis, documentation, and coding: the marginal causal effect of year of hospitalization on sepsis diagnosis. Ann Epidemiol 2016, 26(1):66–70. [DOI] [PMC free article] [PubMed] [Google Scholar]
- 13.Angus DC, Linde-Zwirble WT, Lidicker J et al. : Epidemiology of severe sepsis in the United States: analysis of incidence, outcome, and associated costs of care. Crit Care Med 2001, 29(7):1303–1310. [DOI] [PubMed] [Google Scholar]
- 14.Iwashyna TJ, Odden A, Rohde J et al. : Identifying patients with severe sepsis using administrative claims: patient-level validation of the angus implementation of the international consensus conference definition of severe sepsis. Med Care 2014, 52(6):e39–43. [DOI] [PMC free article] [PubMed] [Google Scholar]
- 15.Vincent JL, Moreno R, Takala J et al. : The SOFA (Sepsis-related Organ Failure Assessment) score to describe organ dysfunction/failure. On behalf of the Working Group on Sepsis-Related Problems of the European Society of Intensive Care Medicine. Intensive Care Med 1996, 22(7):707–710. [DOI] [PubMed] [Google Scholar]
- 16.Bellomo R, Ronco C, Kellum JA et al. : Acute renal failure - definition, outcome measures, animal models, fluid therapy and information technology needs: the Second International Consensus Conference of the Acute Dialysis Quality Initiative (ADQI) Group. Crit Care 2004, 8(4):R204–212. [DOI] [PMC free article] [PubMed] [Google Scholar]
- 17.Bone RC, Balk RA, Cerra FB et al. : Definitions for sepsis and organ failure and guidelines for the use of innovative therapies in sepsis. The ACCP/SCCM Consensus Conference Committee. American College of Chest Physicians/Society of Critical Care Medicine. Chest 1992, 101(6):1644–1655. [DOI] [PubMed] [Google Scholar]
- 18.Levy MM, Fink MP, Marshall JC et al. : 2001 SCCM/ESICM/ACCP/ATS/SIS International Sepsis Definitions Conference. Intensive Care Med 2003, 29(4):530–538. [DOI] [PubMed] [Google Scholar]
- 19.Dellinger RP, Levy MM, Rhodes A et al. : Surviving sepsis campaign: international guidelines for management of severe sepsis and septic shock: 2012. Crit Care Med 2013, 41(2):580–637. [DOI] [PubMed] [Google Scholar]
- 20.Rhee C, Kadri SS, Danner RL et al. : Diagnosing sepsis is subjective and highly variable: a survey of intensivists using case vignettes. Crit Care 2016, 20:89. [DOI] [PMC free article] [PubMed] [Google Scholar]
- 21.Centers for Disease Control and Prevention: Hospital Toolkit for Adult Sepsis Surveillance [https://www.cdc.gov/sepsis/pdfs/Sepsis-Surveillance-Toolkit-Mar-2018_508.pdf]
- 22.Dimick JB, Staiger DO, Birkmeyer JD: Ranking hospitals on surgical mortality: the importance of reliability adjustment. Health Serv Res 2010, 45(6 Pt 1):1614–1629. [DOI] [PMC free article] [PubMed] [Google Scholar]
- 23.MacKenzie TA, Grunkemeier GL, Grunwald GK et al. : A primer on using shrinkage to compare in-hospital mortality between centers. Ann Thorac Surg 2015, 99(3):757–761. [DOI] [PubMed] [Google Scholar]
- 24.Whittaker SA, Mikkelsen ME, Gaieski DF et al. : Severe sepsis cohorts derived from claims-based strategies appear to be biased toward a more severely ill patient population. Crit Care Med 2013, 41(4):945–953. [DOI] [PMC free article] [PubMed] [Google Scholar]
- 25.Gaieski DF, Edwards JM, Kallan MJ et al. : Benchmarking the incidence and mortality of severe sepsis in the United States. Crit Care Med 2013, 41(5):1167–1174. [DOI] [PubMed] [Google Scholar]
- 26.Lorence D: Regional variation in medical classification agreement: benchmarking the coding gap. J Med Syst 2003, 27(5):435–443. [DOI] [PubMed] [Google Scholar]
- 27.Lorence DP, Ibrahim IA: Benchmarking variation in coding accuracy across the United States. J Health Care Finance 2003, 29(4):29–42. [PubMed] [Google Scholar]
- 28.Angus DC, Seymour CW, Coopersmith CM et al. : A Framework for the Development and Interpretation of Different Sepsis Definitions and Clinical Criteria. Crit Care Med 2016, 44(3):e113–121. [DOI] [PMC free article] [PubMed] [Google Scholar]
- 29.Mehta RL, Kellum JA, Shah SV et al. : Acute Kidney Injury Network: report of an initiative to improve outcomes in acute kidney injury. Crit Care 2007, 11(2):R31. [DOI] [PMC free article] [PubMed] [Google Scholar]
- 30.Marshall JC, Cook DJ, Christou NV et al. : Multiple organ dysfunction score: a reliable descriptor of a complex clinical outcome. Crit Care Med 1995, 23(10):1638–1652. [DOI] [PubMed] [Google Scholar]
- 31.Le Gall JR, Klar J, Lemeshow S et al. : The Logistic Organ Dysfunction system. A new way to assess organ dysfunction in the intensive care unit. ICU Scoring Group. JAMA 1996, 276(10):802–810. [DOI] [PubMed] [Google Scholar]
- 32.Centers for Medicare and Medicaid Services: QualityNet - Inpatient Hospitals Specifications Manual [https://www.qualitynet.org]
- 33.Klompas M, Rhee C: The CMS Sepsis Mandate: Right Disease, Wrong Measure. Ann Intern Med 2016, 165(7):517–518. [DOI] [PubMed] [Google Scholar]
- 34.Wise ME, Scott RD 2nd, Baggs JM et al. : National estimates of central line-associated bloodstream infections in critical care patients. Infect Control Hosp Epidemiol 2013, 34(6):547–554. [DOI] [PMC free article] [PubMed] [Google Scholar]
- 35.Klompas M, Anderson D, Trick W et al. : The preventability of ventilator-associated events. The CDC Prevention Epicenters Wake Up and Breathe Collaborative. Am J Respir Crit Care Med 2015, 191(3):292–301. [DOI] [PMC free article] [PubMed] [Google Scholar]
- 36.Klompas M, Li L, Kleinman K et al. : Associations Between Ventilator Bundle Components and Outcomes. JAMA Intern Med 2016, 176(9):1277–1283. [DOI] [PubMed] [Google Scholar]
- 37.Kempker JA, Martin GS: Does Sepsis Case Mix Heterogeneity Prevent Outcome Comparisons? Crit Care Med 2016, 44(12):2288–2289. [DOI] [PMC free article] [PubMed] [Google Scholar]
- 38.Phillips GS, Osborn TM, Terry KM et al. : The New York Sepsis Severity Score: Development of a Risk-Adjusted Severity Model for Sepsis. Crit Care Med 2017. [DOI] [PubMed] [Google Scholar]
- 39.Ford DW, Goodwin AJ, Simpson AN et al. : A Severe Sepsis Mortality Prediction Model and Score for Use With Administrative Data. Crit Care Med 2016, 44(2):319–327. [DOI] [PMC free article] [PubMed] [Google Scholar]
- 40.Kerlin MP, Weissman GE, Wonneberger KA et al. : Validation of Administrative Definitions of Invasive Mechanical Ventilation across 30 Intensive Care Units. Am J Respir Crit Care Med 2016, 194(12):1548–1552. [DOI] [PMC free article] [PubMed] [Google Scholar]
Associated Data
This section collects any data citations, data availability statements, or supplementary materials included in this article.