Abstract
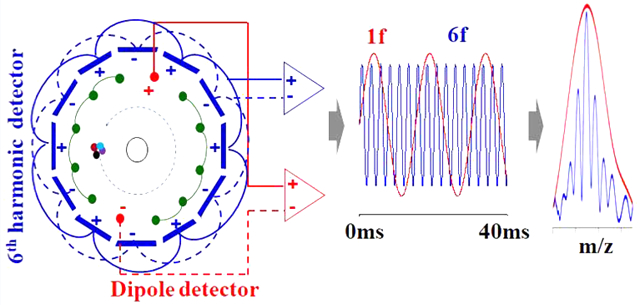
Fourier transform ion cyclotron resonance mass spectrometry (FTICR–MS) is a powerful instrument for high-resolution analysis of biomolecules. However, relatively long signal acquisition periods are needed to achieve mass spectra with high resolution. The use of multiple detector electrodes for detection of harmonic frequencies has been introduced as one approach to increase scan rate for a given resolving power or to obtain increased resolving power for a given detection period. The achieved resolving power and scan rate increase linearly with the order of detected harmonic signals. In recent years, ICR cell geometries have been investigated to increase the order of the harmonic frequencies and enhance harmonic signal intensities. In this study, we demonstrated PCB-based ICR cell designs with dipole and sixth harmonic detectors for parallel detection of fundamental and harmonic (6f) signals. The sixth harmonic signals from the sixth harmonic detector showed an expected 6 times higher resolving power with (M + 3H)3+ charge state insulin ions as compared with that from fundamental signals from the dipole detector. Moreover, the insulin isotopic peaks with sixth harmonic frequency signals acquired with the sixth harmonic detector were resolved for a 40 ms data acquisition period but unresolved with the same duration dipole detector signals, corresponding to a 6-fold improvement in achievable spectral acquisition rates for a given resolving power.
Graphical Abstract
INTRODUCTION
FTICR–MS is a powerful mass analyzer employed for analysis of complex biological samples in many research fields such as proteomics,1–3 metabolomics,4–7 and others,8–10 due to excellent mass accuracy and high mass resolving power. Recently, mass resolving power of 300 000 for a m/z 400 ion with mass accuracy less than 150 ppb was achieved for a 0.76 s data acquisition period with a 21 T FTICR–MS.11 The high mass resolving power with excellent mass accuracy enables the increased confidence in peptide sequencing identification. However, a limitation for effective use of FTICR–MS is the relatively long data acquisition periods needed to obtain high mass resolving power and excellent mass accuracy. This results in a limited number of FTICR–MS spectra that can be acquired with modern fast separation systems including liquid chromatography (LC) and gas chromatography (GC).
The resolving power with FTICR–MS can be approximated by where R is resolving power, ω+ is measured cyclotron frequency, and T is the required signal acquisition period.12,13 Therefore, required resolving power with reduced data acquisition periods can be obtained with increased magnetic field strengths, shifting detected frequencies (ω+) higher. Recently, a 21 T magnet FTICR–MS instrument has been developed, and its utility has been demonstrated in several fields.11,14–18 For equivalent resolving power, the data acquisition periods with 21 T FTICR–MS are 3-fold less than that with 7 T FTICR–MS. At high resolving power with the same data acquisition periods, increased FT signal acquisition was demonstrated with multiple high-resolution mass analyzers in a single FTICR instrument. Multiple mass analyzers were demonstrated both along the central magnetic field axis19 and orthogonal to the central magnetic field axis.20 This approach enables parallel mass spectral acquisition requiring only a single acquisition event. The scan rate with the approach is directly proportional to the number of mass analyzers in the single FTICR–MS. Increased high-mass-resolution scan rates were also demonstrated using an external data acquisition system and advanced data processing approaches that can provide parallel ion accumulation and signal acquisition.21 With this approach, up to 4-fold higher scan rates were demonstrated with desorption electrospray ionization-mass spectrometry imaging (DESI-MSI).
The use of multiple harmonic detection electrodes has long been realized as a promising technique to reduce data acquisition periods without the loss of resolving power or to increase resolving power during a given data acquisition period.22–32 With multiple harmonic detection electrodes, frequencies 2 or more times higher than the fundamental cyclotron frequencies can be measured during a single period of ion cyclotron motion. In general, theoretical resolving power increases linearly with the order of the detected harmonic signals. Over the past several decades, ICR cells with multiple detection electrodes for harmonic signal detection have been demonstrated in many research fields. For example, Vorobyev et al.28 and Cho et al.33 demonstrated ICR cells for analysis of proteins and crude oil, respectively, using second harmonic signals. Misharin et al. demonstrated a coaxial multielectrode cell (O-trap) for detection of third harmonic signals.25 Nagornov et al.,27 Park et al.,31 and Shaw et al.,32 demonstrated detection of fourth harmonic signals using ICR cells with eight detection electrodes. Those ICR cells showed 4× higher resolving power for the same acquisition time as compared with traditional dipole detection. Advantages of multiple detection electrodes have also recently been demonstrated with the combination of online separation techniques including LC34 and GC.35 The multiple detection electrodes showed an increase in the number of detected peaks in comparison to conventional LC– and GC–FTICR–MS. The application of harmonic signal detection has also been demonstrated with other FT-based mass analyzers to improve resolving power and signal-to-noise.36–38 However, to the best of our knowledge, ICR cells that allow the detection of harmonic signals greater than the fourth order have not previously been reported. Here, we demonstrate an ICR cell with dipole and sixth harmonic detectors for parallel detection of dipole and sixth harmonic signals from the same ions and directly compare both signals and optimization of experimental conditions for either signal. The ICR cell used 12 copper wires as dipole detection electrodes and excitation electrodes.39 A total of 12 printed circuit board (PCB) plates were used for multiple detection electrodes.19,20,31,40 These results illustrate that sixth harmonic signals can be exploited to offer scan rate improvements up to 6 times higher than conventional fundamental signal detection and offer potential advancement for accurate mass analysis during online chromatographic separations.
EXPERIMENTAL SECTION
LTQ–FTICR–MS.
An ICR cell with dipole and sixth harmonic detectors was implemented in a hybrid linear ion trap Fourier transform ion cyclotron resonance mass spectrometer (LTQ–FTICR–MS; Thermo Scientific, Bremen, Germany) to acquire parallel signals in all experimental data. The system was equipped with a 7 T actively shielded superconducting magnet (Jastec Japan Superconductor Technology, Tokyo, Japan). To mount the ICR cell, the LTQ–FTICR–MS was modified to support parallel dipole and sixth harmonic detectors, an in-vacuum preamplifier array, and a custom multipin feedthrough flange on the source side of the vacuum system. After the removal of a cylindrical Ultra ICR cell originally equipped with the LTQ–FTICR–MS, the ICR cell was connected to a multichannel programmable DC power supply (Modular Intelligent Power Source (MIPS), GAA Custom Engineering, Benton City, WA, USA)19,20,40 and with a Saleae digitizer (Logic 8, Saleae, South San Francisco, CA, USA).20,40 After installation, the system was pumped and baked out overnight. Electrospray ionization (ESI) was used to generate ions with a syringe pump and directly infuse samples at a rate of 3.0 μL/min. An ESI spray voltage of 3.8 kV was applied to a sample solution through a metal union for ionization. The ions were accumulated in the LTQ and were then transferred to the ICR cell through the original equipment octapole ion guide. Ion populations inside the LTQ were accumulated with automatic gain control (AGC) on and set to 1.0 × 10⁵. The pressure in the cell region during all experiments was approximately 0.3 × 10⁻¹⁰ Torr as indicated by the ion gauge on this chamber.
Design of an ICR Cell with Parallel Dipole and Multipole Harmonic Detectors.
ICR cells with parallel dipole and multipole harmonic detectors were constructed with PCB plates with FR4 substrate and copper wires. On the PCB plates, all electrodes including trapping, detection, and front/back lens electrodes were constructed using gold-coated copper. Figure 1 shows images and a schematic diagram of the components of an ICR cell with dipole and sixth harmonic detectors used here for dipole and sixth harmonic signal acquisition. The ICR cell developed for these studies consisted of 12 harmonic signal detection and entrance/exit lens plates, 2 dipole detection, and 10 excitation electrodes made out of copper wires. The harmonic signal detection plates were 0.28″ in width and were segmented into five sections as shown in Figure 1a. The middle sections (2.6″ in width) were used for sixth harmonic detection electrodes designated as a “6th harmonic detector”. The segments with a width of 0.1″ next to detection electrodes were used as trapping electrodes. Electrode segments next to the trapping electrodes (0.3″ in width) were held at ground potential in all experiments. The total length (along the magnetic field axis) of each of the 12 PCB boards containing these electrodes was 3.44″. Figure 1b shows the back side of the detection plates with pads, which were used for connections of trapping electrodes or sixth harmonic detection electrodes. Figure 1c shows entrance and exit lens plates, which contain a 0.2″ diameter hole at the center of the electrode, through which ions were transferred from the LTQ ion trap. The detection plates were soldered to the entrance and exit lens plates to assemble the ICR cell with dipole and sixth harmonic detectors. The average gap between harmonic detector plates was 0.025″. Dipole detection and excitation electrodes were constructed with 22 AWG copper wires positioned at the junction of harmonic detector plates at radius of 0.65″ to minimize shielding of harmonic detectors as shown in Figure S1a. After that, the trapping electrode segments were electrically coupled together by soldering 24 AWG copper wires on the pads (Figure 1b) on the detection plate outer surface to connect all trapping electrodes. For harmonic signal detection, the sixth harmonic detection electrodes with the same polarity were connected together through other pads (Figure 1b) on the detection plate outer surface. After that, 22 AWG copper wires inserted into the holes for the dipole, and excitation electrodes indicated in Figure 1c were soldered to the entrance/exit lens plates. The distances of the sixth harmonic detector and the copper wires used for the dipole detector and the excitation electrodes from the cell center were 0.7 and 0.65″. The detailed information about the connection and position of the dipole as well as the sixth harmonic and excitation electrodes are shown in Figure S1d. In this figure, the blue and green rectangles are positive and negative sixth harmonic detection electrodes, respectively, made by detection plates. The sixth harmonic detection electrodes with the same color were connected together for 6f harmonic signal acquisition through the pads (Figure 1b) on the detection plate outer surface. The red and pink dots are positive and negative dipole electrodes, respectively, made by copper wires. The blue and green dots are positive and negative excitation electrodes, respectively, made by copper wires. The yellow lines indicate copper traces made on the entrance/exit lens plates. The yellow dots are through-hole pads that were used to connect the dipole detector, excitation electrodes, and entrance/exit lens electrodes to the preamplifier, RF supplier, and MIPS, respectively. The copper trances and through-hole pads on the entrance lens plates were used for the entrance lens electrode to MISP and the dipole detector to the preamplifier array. The copper trances and through-hole pads on the exit lens plates were used for the excitation and exit lens electrodes. The write dots (drill holes) were used to install the assembly ICR cell, which was installed at the end of the octapole ion guide in the place of the ThermoFisher Ultra ICR cell. Each detection electrode pair was connected to a custom vacuum-compatible preamplifier array (GAA Custom Engineering) using Kapton-coated wires (22 AWG, Accu-Glass Products, Inc., Valencia, CA) to allow parallel ICR signal amplification.19,20 The preamplifier was mounted 0.6″ away from the entrance lens plate of the ICR cell to reduce detection capacitance and noise and increase sensitivity. Figure 1d shows the assembled ICR cell.
Figure 1.
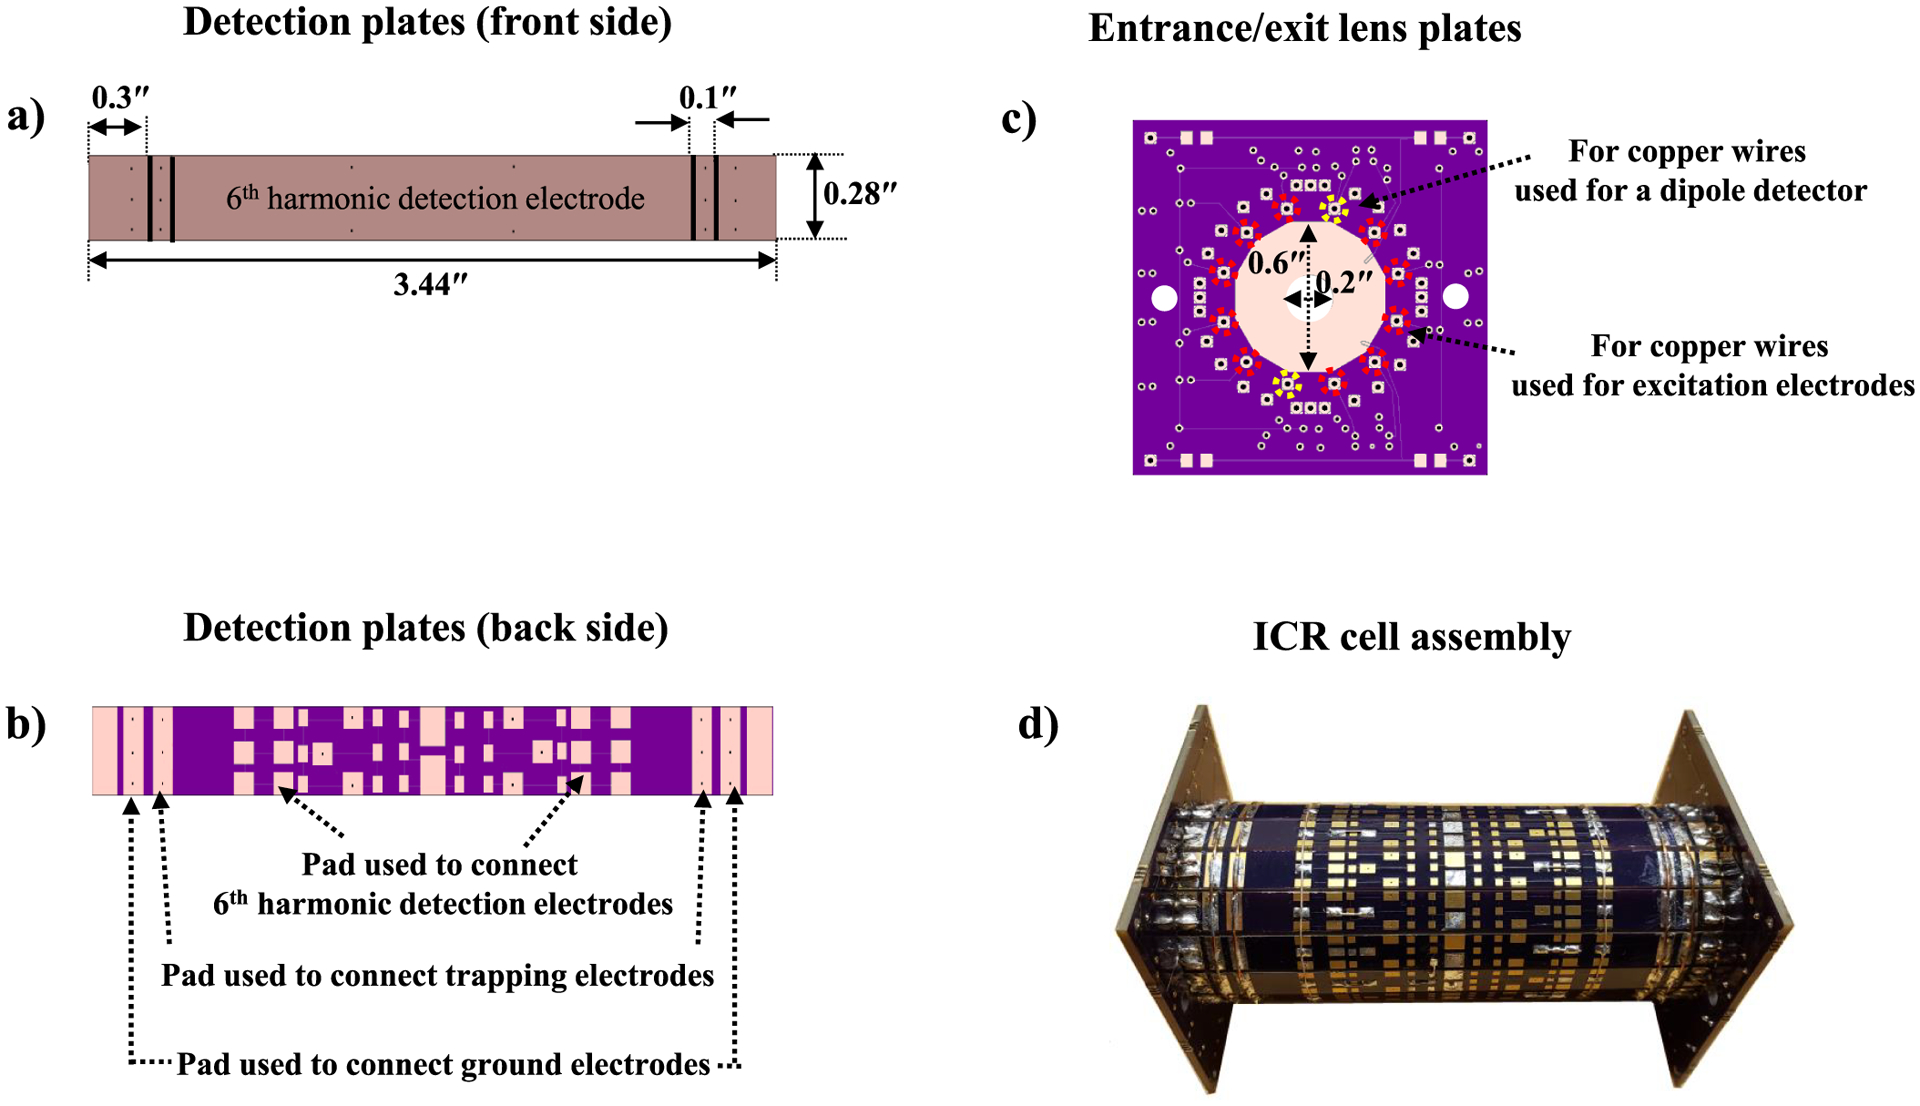
Individual PCB components for an ICR cell with dipole and sixth harmonic detectors. Sixth harmonic detection plates (a), entrance/exit lens plates (b), ICR cell assembly (c), and the transverse cross section (magnetic field axis projects into the plane of this figure) with a wiring diagram (d) for the ICR cell used for parallel fundamental and sixth harmonic frequency detection.
The circuit board layout program EAGLE ver. 7.3.0 (CadSoft Computer, Pembroke Pines, FL), manufactured by OSH Park (Advanced Circuits, Aurora, CO), was used to prepare all individual PCB components for the ICR cell with dipole and sixth harmonic detectors. The solder used to prepare the ICR cells was 99.3/0.7 Sn–Cu lead-free solder alloy.20,40 The total cost for preparing the ICR cell was about $80.
The applied voltages to each electrode for trapping ions were independently controlled with MIPS. To achieve ion cyclotron motion from the trapped ions, the ions were excited with ThermoFisher excitation waveforms as normally used for ICR excitation with the Ultra Cell. The mass range of m/z 200–2000 that covered the frequency range of approximately 500–50 kHz was used for ion excitation. The excitation duration was 10 ms. After ion excitation, parallel dipole and harmonic signals from each detector were amplified with independent preamplifiers and then digitized with a Saleae digitizer.19,20,40 The number of samples and sample rate for the Saleae digitizer were set to 2 621 440 and 6 250 000, respectively. An external power supply was used to supply DC power (±2.5 V) for the in-vacuum preamplifier. The digitized data were transferred to a computer through a USB interface and converted to frequency-domain and mass spectra with ICR-2LS (http://omics.pnl.gov/software/icr-2ls) with Welch apodization and without zero-filling.
Sample Preparation.
Insulin and Ultramark 1621 (a mixture of fluorinated phosphazenes) were purchased from Sigma (St. Louis, MO, USA). HPLC grade methanol, acetic acid, and dimethyl sulfoxide were obtained from Fisher Scientific (Pittsburgh, PA, USA). A 10 μM insulin standard solution was prepared by dissolving insulin in a 1:1 (v/v) water/methanol solvent mixture containing 0.1% (v/v) of acetic acid. An Ultramark 1621 stock solution was prepared by dissolving 10 μL of Ultramark 1621 in 10 mL of acetonitrile. A 10 μM solution of Ultramark 1621 was prepared by dissolving 100 μL of the stock solution of Ultramark 1621 in a solution of 1% acetic acid in 50:50 methanol/water.
RESULTS AND DISCUSSION
Characterization of Fundamental and Harmonic Signals.
To characterize fundamental and harmonic signals, parallel time domain signals from dipole and sixth harmonic detectors were obtained at various excitation voltages using a 10 μM solution of Ultramark 1621. For this experiment, optimized voltages of −9 and +4 V were applied to front and back trapping electrodes, respectively, to inject transferred ions into an ICR cell. After injection of ions, −9 V applied to the front trapping electrode was switched to +4 V to trap ions. At 8 ms after trapping ions, various excitation voltages from 12–32 Vpp (peak to peak) were applied to excitation electrodes for 10 ms to identify optimal excitation voltages for fundamental and harmonic signals. At 6 ms after the RF voltage was applied, the trapping voltages (+4 V) applied to front and back trapping electrodes were gradually decreased to +3 V, and then, parallel time domain signals from dipole and sixth harmonic detectors were obtained using a Saleae digitizer. The obtained signals were converted to mass spectra to calculate S/N and standard deviation of the S/N as a function of applied excitation voltages. Figure 2 shows the result of characterization of S/N for the base peaks corresponded to the m/z 1422 Ultramark ion as a function of various excitation voltages. In this figure, the red square is a fundamental signal from the dipole detector. The black square, green triangle, purple circle, and blue star are the fundamental, second, third, and sixth harmonic signals from sixth harmonic detector, respectively. The maximal S/N for the fundamental signal with dipole and sixth harmonic detectors was obtained at 24 Vpp, which corresponds to approximately 75% of the cell radius.31 The optimal excitation voltage to obtain the maximal S/N for the sixth harmonic peaks from the sixth harmonic detector was 28Vpp, which corresponds to approximately 88% of the cell radius.31 At this excitation voltage, reduced fundamental, second, and third harmonic peaks from the sixth harmonic detector were observed to less than 12, 22, and 8% of that from the sixth harmonic peaks, respectively.
Figure 2.
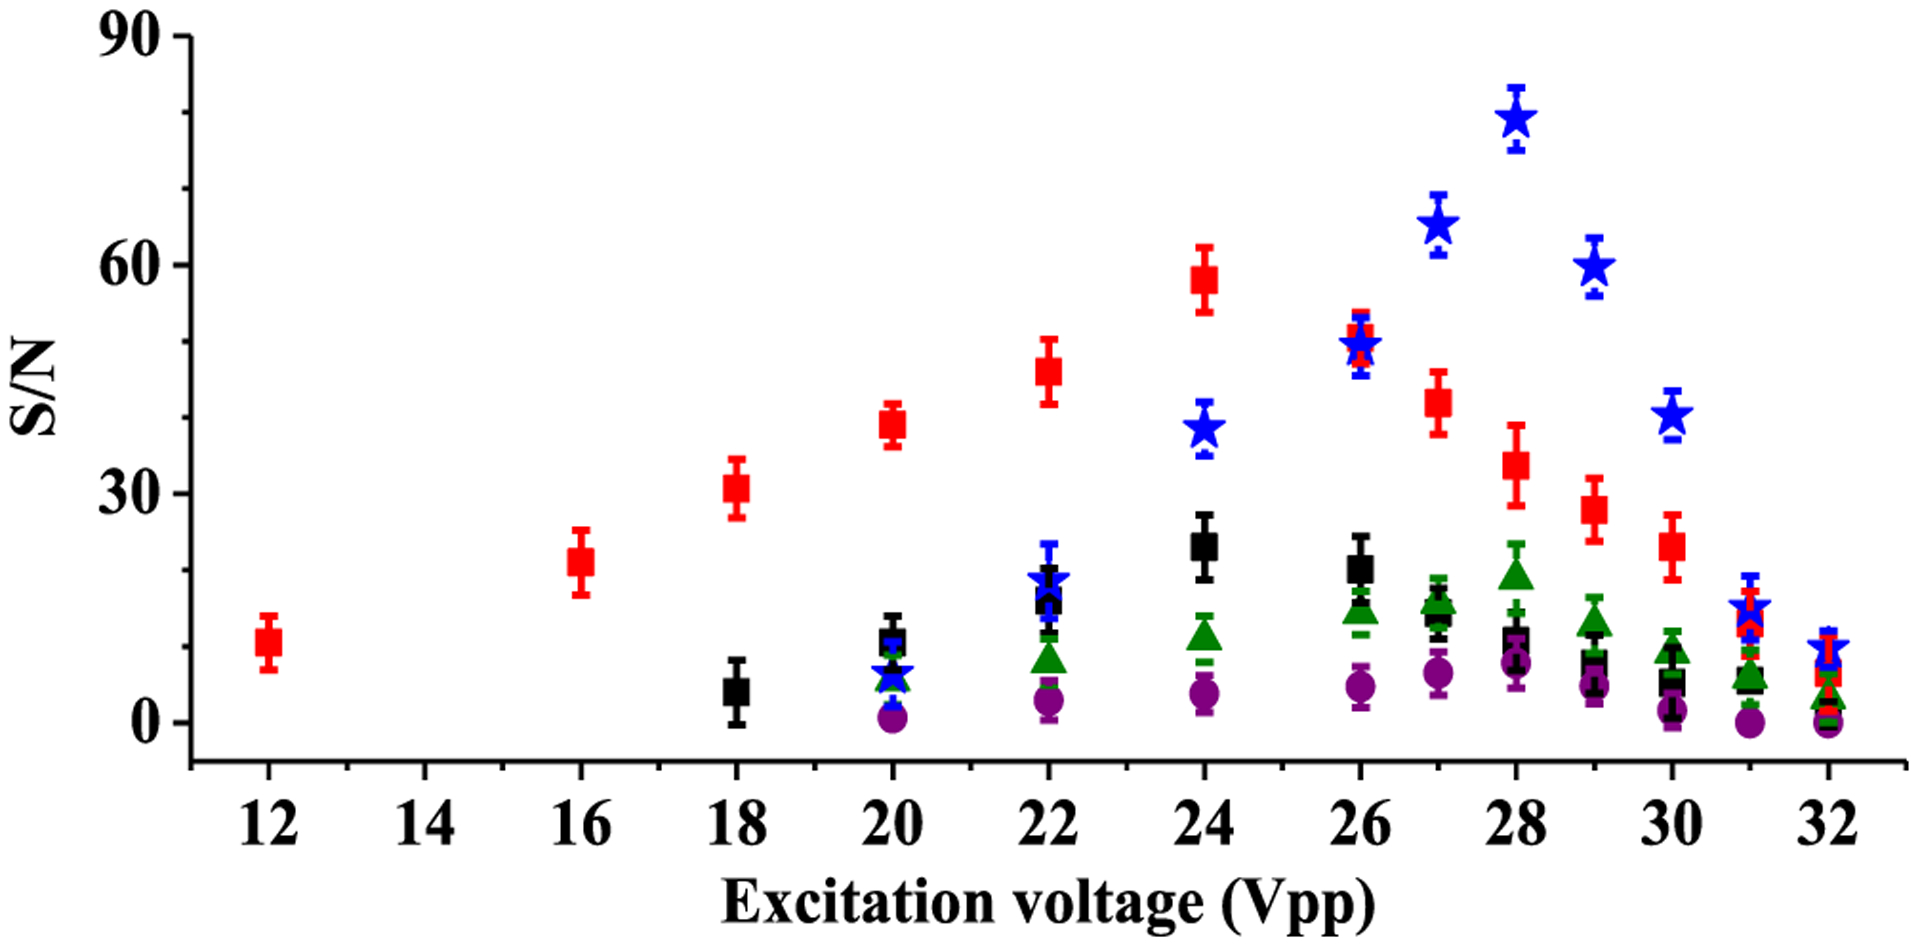
Characterization of S/N for most intense ions (m/z 1422 (fundamental), m/z 711 (2f), m/z 474 (3f), and m/z 237 (6f)) observed in the parallel mass spectra from the dipole and sixth harmonic detectors. Red square is a fundamental signal from the dipole detector. Black square, green triangle, purple circle, and blue star are fundamental, second, third, and sixth harmonic signals from the sixth harmonic detector, respectively.
Figure 3 shows parallel mass spectra from dipole and sixth harmonic detectors in a single ICR cell with excitation at 28 Vpp as an example. Figure 3a shows fundamental signal from the dipole detector. Figure 3b,c shows harmonic signals from the sixth harmonic detector without and with recalibration, respectively, for the sixth harmonic signal. Calibration for sixth harmonic signal was accomplished with a two-parameter calibration equation, m/z = A/f + B/f2.12,20,41 In this equation, the A (648108811.228) term is related to magnetic field strength, and the B (−1767155067.018) term is related to magnetron motion and the electric field generated primarily from trapping potentials, and f is the measured frequency. Figure S2 shows parallel time domain signals of fundamental and sixth harmonic signals for selected ions with excitation at 28 Vpp. Figure S2a,b were obtained from the selected ion at m/z 1422 from a dipole detector and the ion at m/z 237 from a sixth harmonic detector, respectively. The time domain signal for the sixth harmonic frequencies (Figure S2b) showed faster decay than that from the fundamental signal (Figure S2a), which suggests a limitation ultimately exists in the benefits of high harmonic signal detection for ultrahigh-resolution spectra and extended time-domain signal acquisition.
Figure 3.
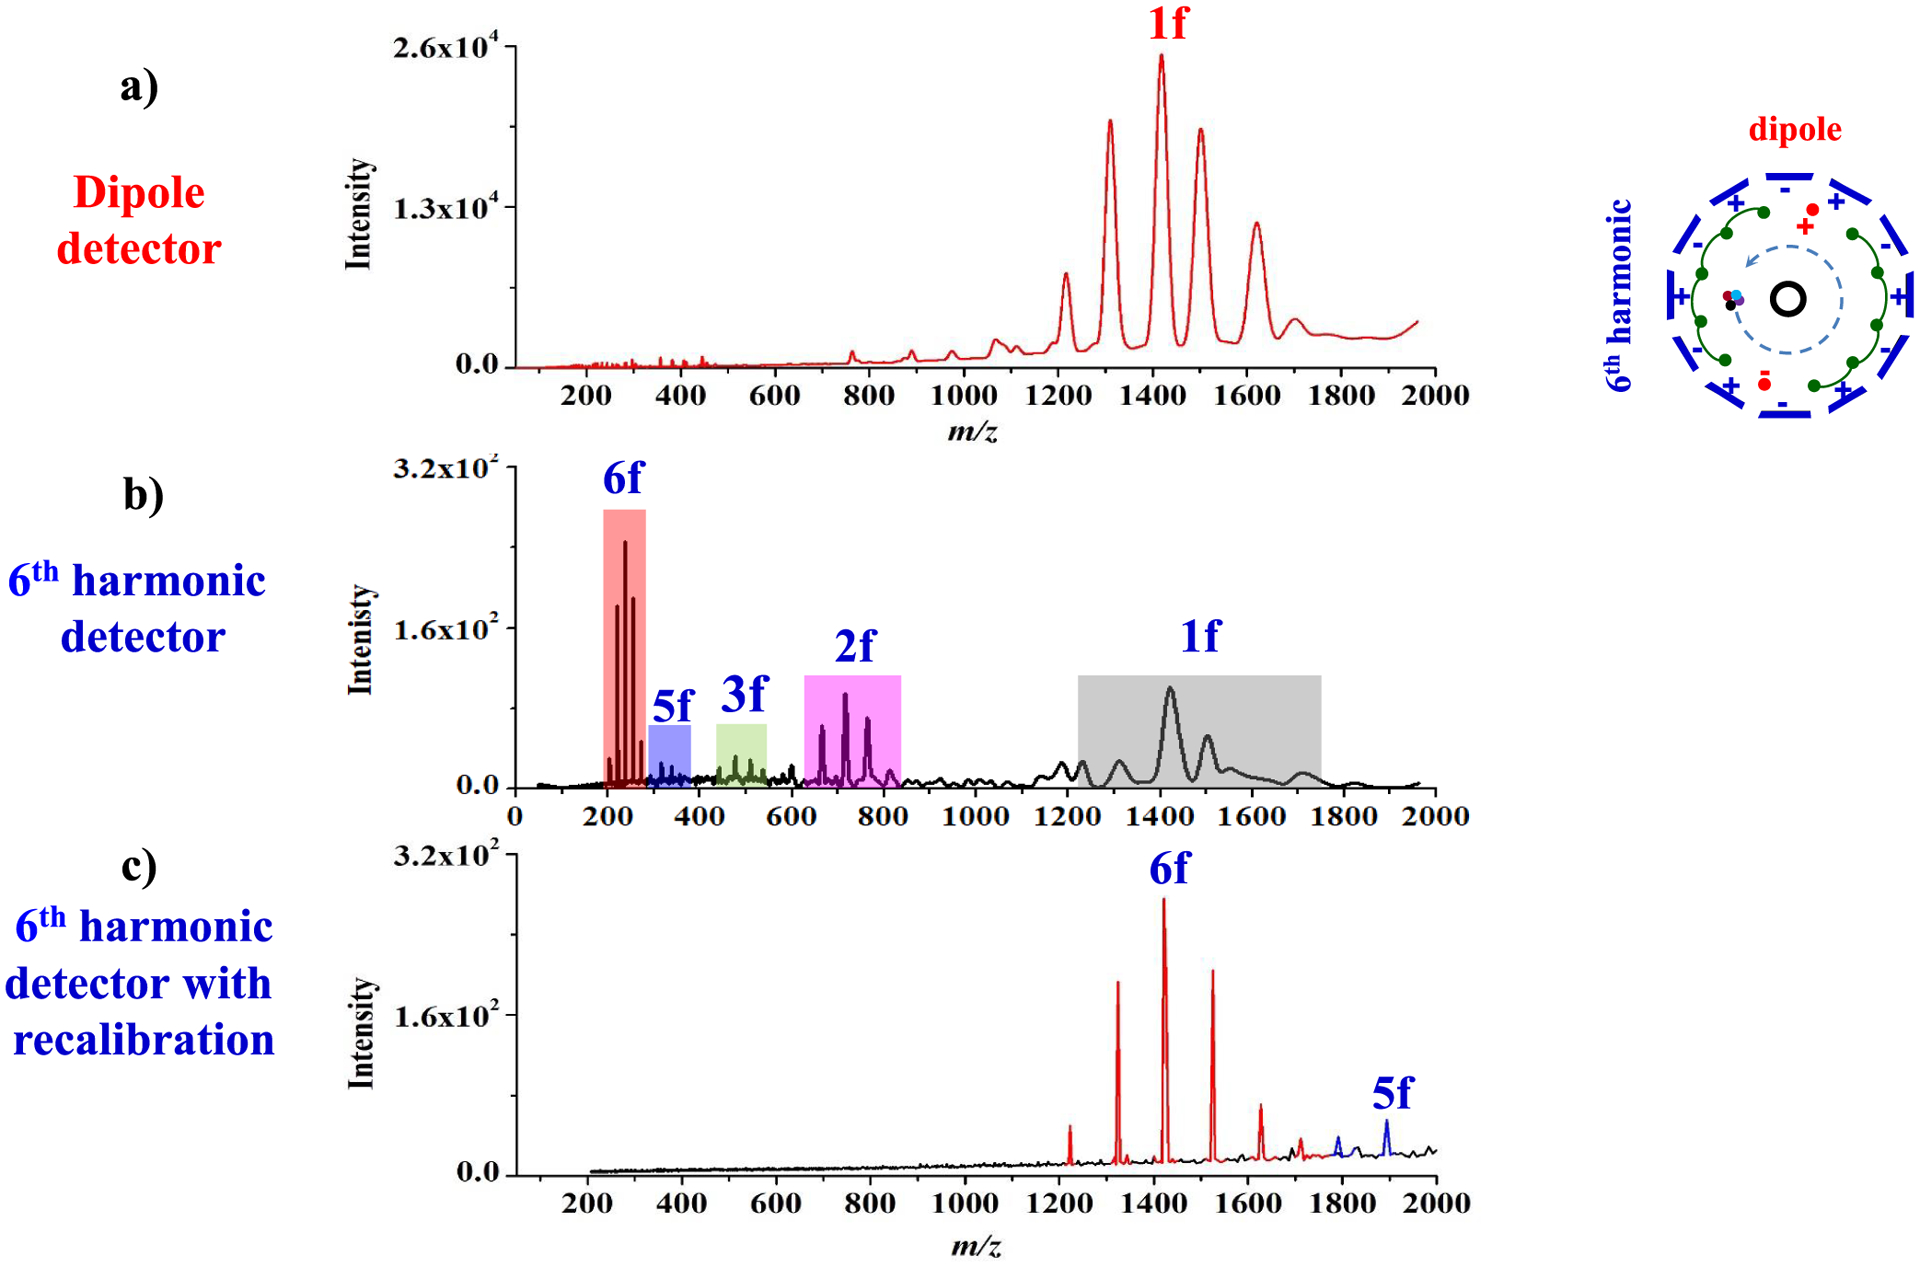
Mass spectra obtained from parallel dipole and sixth harmonic detectors in a single ICR cell with excitation at 28 Vpp using Ultramark 1621. Fundamental signals (a) from a dipole detector. Harmonic signals from a sixth harmonic detector before (b) and after (c) recalibration.
Resolving Power.
To compare performance from dipole and multipole detectors in a single ICR cell, the achieved resolving power from each spectrum was evaluated with insulin. Figure S3 shows parallel mass spectra from the dipole (Figure S3a) and sixth harmonic (Figure S3b,c) detectors with excitation at 28 Vpp. Figure S3b shows the harmonic signal mass spectrum before recalibration, and Figure S3c shows the recalibrated harmonic signal. The mass spectra with resolving power from the dipole and sixth harmonic detectors with a 300 ms acquisition period are compared in Figure 4. Figure 4a,b shows fundamental and sixth harmonic signals from the dipole and sixth harmonic detector, respectively. The sixth harmonic signals showed 6 times higher resolving power with the [M + 3H]3+ charge state insulin ions as compared with that from the fundamental signal from the dipole detector as expected. As the detection period was shortened to 200 ms (Figure 5a,b) to decrease data acquisition time and enable higher acquisition rates, ions within the insulin isotopic distribution of the +3 charged state were resolved in 6f harmonic signals acquired with the sixth harmonic detector but unresolved with the conventional dipole detector. Although there might be no improvement for increased charge capacity or reduction of peak coalescence that can be prevented by increasing the magnetic field,42,43 the resolving power obtained with the sixth harmonic detector for sixth harmonic signals for a data acquisition time of 200 ms is comparable to a 21T FTICR–MS operating with a dipole detector for data acquisition times of 400 ms. More importantly, the insulin isotopic distribution of the +3 charged state in 6f harmonic signals (Figure 5d) was still resolved with acquisition periods as short as 40 ms but unresolved with the conventional dipole detector (Figure 5c). This sixth harmonic frequency detection result demonstrates the ability to acquire isotopically resolved spectra within an acquisition period comparable to the time required for ion accumulation and will greatly benefit chromatographic applications. Figure S4 shows the resolving power of +3 charge state insulin ions from dipole and sixth harmonic detectors as a function of the data acquisition period with the excitation voltages of 24 and 28 Vpp for dipole and sixth harmonic detectors, respectively. With the sixth harmonic detector, the resolving power was observed to linearly increase with detection period until 800 ms, beyond which no further increase was observed. This observation was due to the fact that the sixth harmonic signals decayed to near noise levels after 800 ms at high excitation voltages (28 Vpp), and therefore, no improvement in resolving power was observed beyond this signal acquisition length. With the dipole detector signals, however, the achieved resolving power linearly increased over the entire 1500 ms data acquisition period. As compared with resolving power for the fourth harmonic signal of +3 charge state insulin ions (R = 14 000 for the 90 ms data acquisition period) obtained from an ICR cell with dipole and eight-plate detectors,31 the ICR cell with a sixth harmonic detector showed similar resolving power (R = 11000) for 60 ms data acquisition periods that was approximately 1.5 times faster than the ICR cell with dipole and eight-plate detectors in the data acquisition time. Figure S5 illustrates equivalent resolving power spectra acquired with Ultramark 1621 ions obtained with 300 and 40 ms dipole (red) and sixth harmonic (blue) detectors, respectively. These results suggest that with optimization of all other steps in the mass spectrometry experiment (e.g., ion accumulation, injection, excitation, etc.), sixth harmonic signal acquisition can improve the effective spectral acquisition duty cycle by nearly 6-fold. Thus, even though sixth harmonic signals decay faster than dipole signals, sixth harmonic signal detection enables higher acquisition rates of high-resolution spectra that could significantly benefit chromatographic applications.
Figure 4.
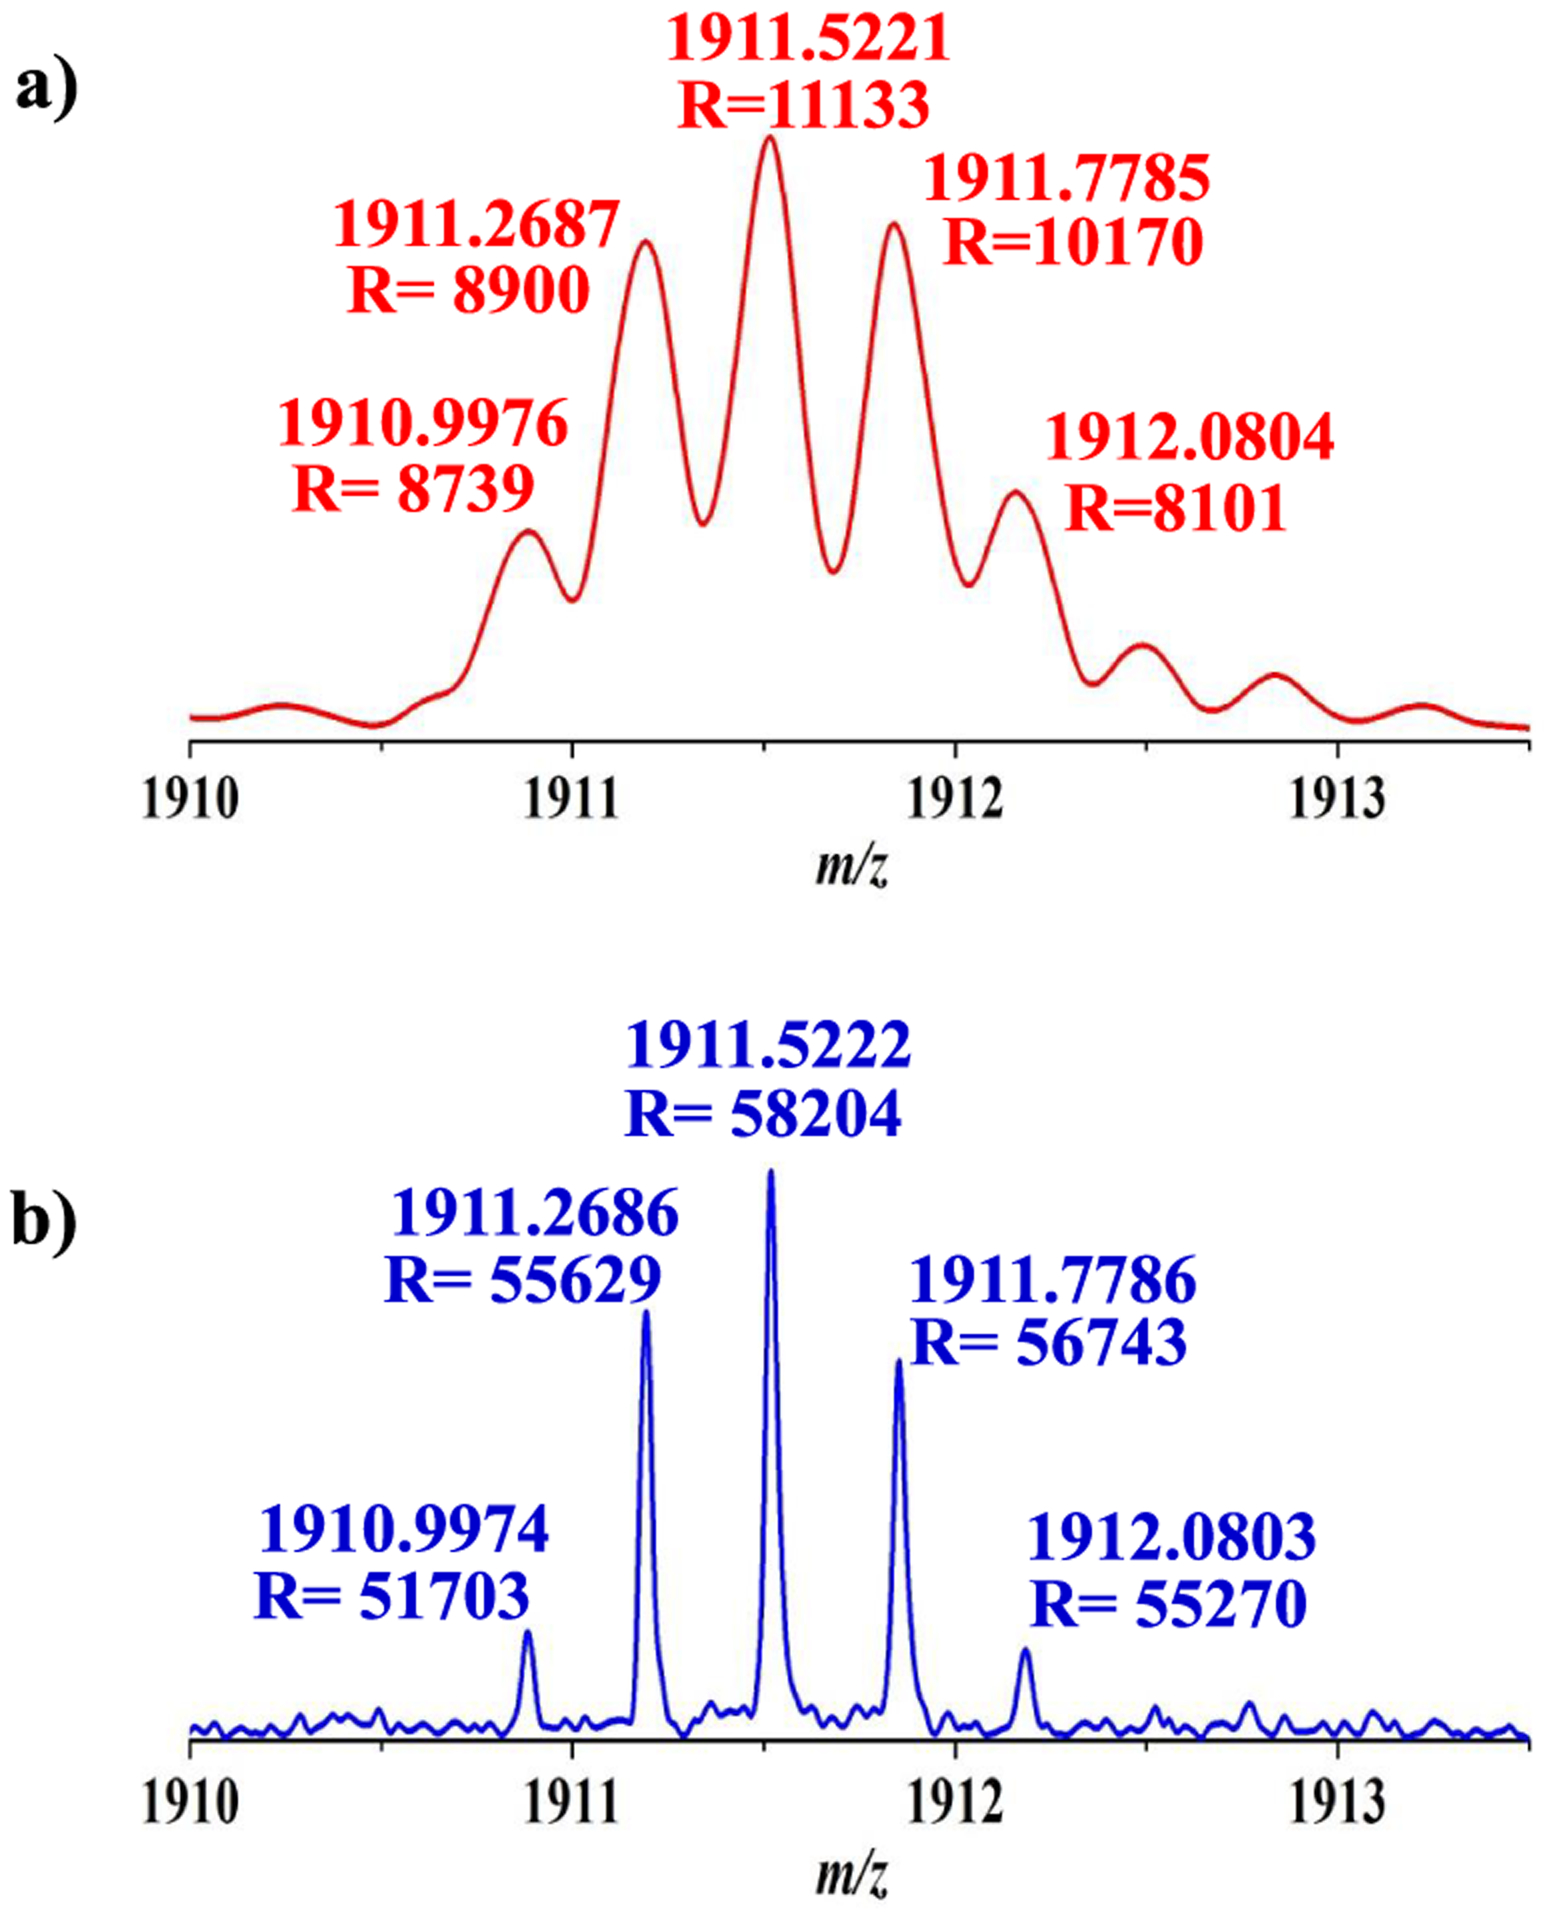
Mass spectra of bovine insulin [M + 3H]3+ charge state ions. Parallel mass spectra from dipole and sixth harmonic detectors for 300 ms data acquisition period. Fundamental signal (a) from the dipole detector and sixth harmonic signal (b) from the sixth harmonic detector after recalibration.
Figure 5.
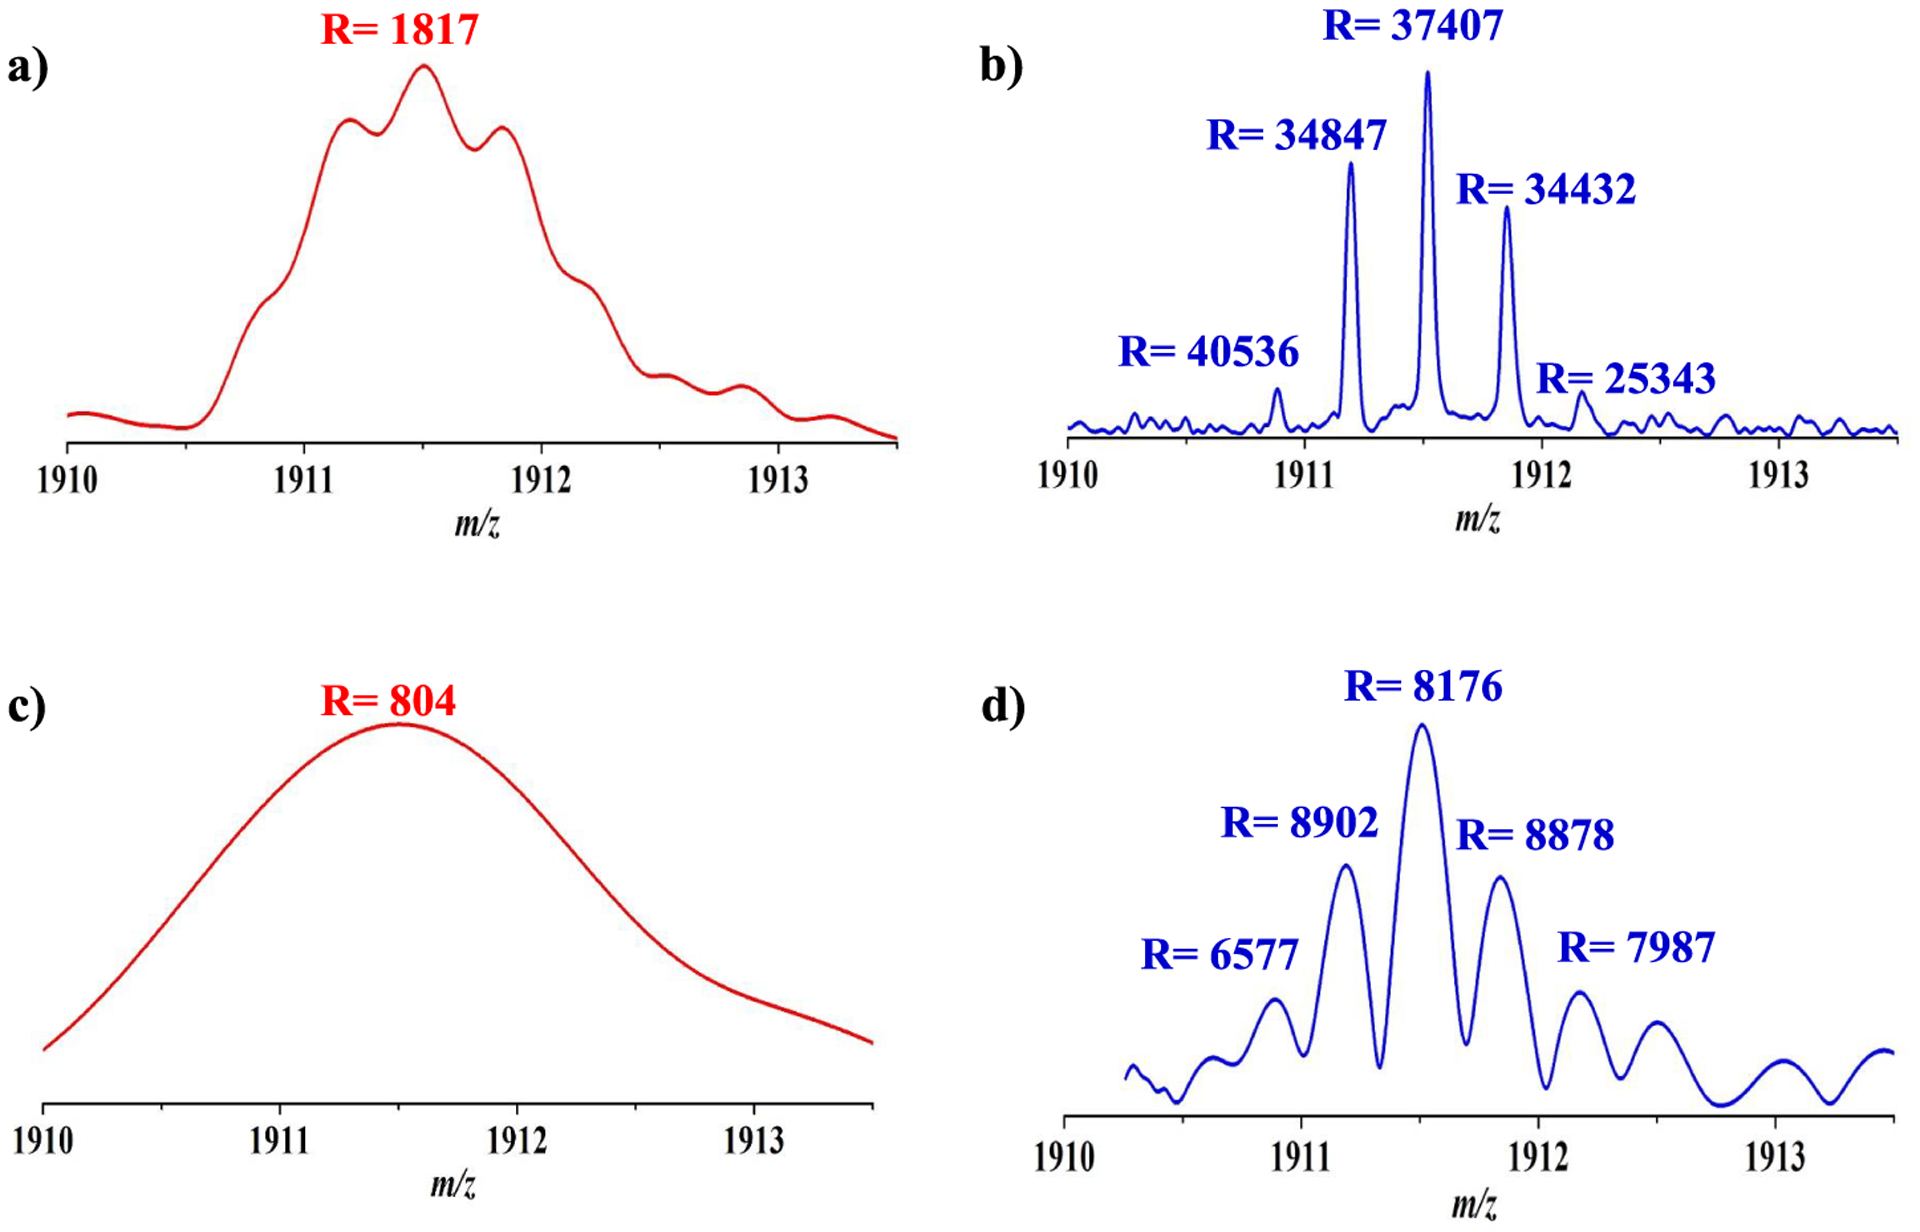
Mass spectra of +3 charged insulin ion with different data acquisition periods. Fundamental (a) and 6f harmonic signals (b) from dipole and sixth harmonic detectors, respectively, with a 200 ms data acquisition period. Fundamental (c) and 6f harmonic signals (d) from dipole and sixth harmonic detectors, respectively, with a 40 ms data acquisition period.
CONCLUSIONS
In this study, we demonstrated sixth harmonic signals using an ICR cell with dipole and sixth harmonic detectors. The dipole and sixth harmonic detectors were used for parallel detection of fundamental and sixth harmonic signals, respectively, from the same ion population. The fundamental signal was used for deconvolution of overlapping harmonic signals and calculation of all possible harmonic frequencies.31 The sixth harmonic peaks from the sixth harmonic detector showed higher resolving power as well as better mass resolution and S/N as compared with fundamental peaks from the dipole detector. With 200 ms data acquisition periods, ions within the insulin isotopic distribution of the +3 charged state were resolved in sixth harmonic peaks acquired with the sixth harmonic detector but unresolved with the conventional dipole detector. Moreover, the sixth harmonic signals from the sixth harmonic detector provided isotopic resolving power even with 40 ms data acquisition periods, which are approximately 6 times faster shorter than those with dipole detectors that yield the same resolving power. As compared with the ICR cell with dipole and eight-plate detectors used for parallel detection of first and fourth harmonic signals,31 the ICR cell with a sixth harmonic detector for sixth harmonic signal detection shows 1.5 times higher resolving power than the ICR cell with dipole and eight-plate detectors for the same data acquisition period or allows a 30% reduction in acquisition time for equivalent resolving power. These advancements could significantly improve chromatographic applications where resolving power of 25 000 to 50 000 is beneficial during MS and MSn analysis.44–47 However, the time domain signals for sixth harmonic frequencies also showed faster decay rates than those from the fundamental and fourth harmonic signals.31 This indicates that still higher resolving power applications of sixth or higher harmonic frequency signals require further developments to reduce high harmonic frequency signal decay rates.
Supplementary Material
ACKNOWLEDGMENTS
This work was supported by the National Institutes of Health through grant 5R01GM097112.
Footnotes
Supporting Information
The Supporting Information is available free of charge at https://pubs.acs.org/doi/10.1021/jasms.9b00144.
Figure S1. Schematic diagram for entrance and exit lens plates with parallel dipole, sixth harmonic detector, and excitation electrodes; Figure S2. Parallel time domain signals of the selected Ultramark 1621 ion (a) at m/z 1422 and ion at m/z 237 with excitation at 28 Vpp; Figure S3. Mass spectra obtained from parallel dipole and sixth harmonic detectors in a single ICR cell with excitation at 28 Vpp using insulin; Figure S4. Resolving powers of +3 charged insulin ion as a function of data acquisition periods; Figure S5. Mass spectra of Ultramark 1621 ions obtained with dipole and sixth harmonic detectors during 300 and 40 ms of data acquisition periods, respectively (PDF)
Complete contact information is available at: https://pubs.acs.org/10.1021/jasms.9b00144
The authors declare no competing financial interest.
Contributor Information
Sung-Gun Park, Department of Genome Sciences, University of Washington, Seattle, Washington 98109, United States.
Gordon A. Anderson, GAA Custom Engineering, LLC, , Benton City, Washington 99320, United States
James E. Bruce, Department of Genome Sciences, University of Washington, Seattle, Washington 98109, United States.
REFERENCES
- (1).Bantscheff M; Lemeer S; Savitski M; Kuster B Quantitative mass spectrometry in proteomics: critical review update from 2007 to the present. Anal. Bioanal. Chem 2012, 404, 939–965. [DOI] [PubMed] [Google Scholar]
- (2).Yates JR; Ruse CI; Nakorchevsky A Proteomics by Mass Spectrometry: Approaches, Advances, and Applications. Annu. Rev. Biomed. Eng 2009, 11, 49–79. [DOI] [PubMed] [Google Scholar]
- (3).Griffiths WJ; Wang Y Mass spectrometry: from proteomics to metabolomics and lipidomics. Chem. Soc. Rev 2009, 38, 1882–1896. [DOI] [PubMed] [Google Scholar]
- (4).Courant F; Antignac J-P; Dervilly-Pinel G; Le Bizec B Basics of mass spectrometry based metabolomics. Proteomics 2014, 14, 2369–2388. [DOI] [PubMed] [Google Scholar]
- (5).Ghaste M; Mistrik R; Shulaev V Applications of Fourier Transform Ion Cyclotron Resonance (FT-ICR) and Orbitrap Based High Resolution Mass Spectrometry in Metabolomics and Lipidomics. Int. J. Mol. Sci 2016, 17, 816. [DOI] [PMC free article] [PubMed] [Google Scholar]
- (6).Junot C; Fenaille F; Colsch B; Bécher F High resolution mass spectrometry based techniques at the crossroads of metabolic pathways. Mass Spectrom. Rev 2014, 33, 471–500. [DOI] [PubMed] [Google Scholar]
- (7).Brown SC; Kruppa G; Dasseux J-L Metabolomics applications of FT-ICR mass spectrometry. Mass Spectrom. Rev 2005, 24, 223–231. [DOI] [PubMed] [Google Scholar]
- (8).Headley JV; Peru KM; Barrow MP Advances in mass spectrometric characterization of naphthenic acids fraction compounds in oil sands environmental samples and crude oil—A review. Mass Spectrom. Rev 2016, 35, 311–328. [DOI] [PubMed] [Google Scholar]
- (9).Zuber J; Rathsack P; Otto M Structural Characterization of Acidic Compounds in Pyrolysis Liquids Using Collision-Induced Dissociation and Fourier Transform Ion Cyclotron Resonance Mass Spectrometry. Anal. Chem 2018, 90, 12655–12662. [DOI] [PubMed] [Google Scholar]
- (10).Holguin FO; Schaub T Characterization of microalgal lipid feedstock by direct-infusion FT-ICR mass spectrometry. Algal Res. 2013, 2, 43–50. [Google Scholar]
- (11).Hendrickson CL; Quinn JP; Kaiser NK; Smith DF; Blakney GT; Chen T; Marshall AG; Weisbrod CR; Beu SC 21 T Fourier Transform Ion Cyclotron Resonance Mass Spectrometer: A National Resource for Ultrahigh Resolution Mass Analysis. J. Am. Soc. Mass Spectrom 2015, 26, 1626–1632. [DOI] [PubMed] [Google Scholar]
- (12).Marshall AG; Hendrickson CL; Jackson GS Fourier transform ion cyclotron resonance mass spectrometry: A primer. Mass Spectrom. Rev 1998, 17, 1–35. [DOI] [PubMed] [Google Scholar]
- (13).Amster IJ Fourier Transform Mass Spectrometry. J. Mass Spectrom 1996, 31, 1325–1337. [Google Scholar]
- (14).Shaw JB; Lin T-Y; Leach FE; Tolmachev AV; Tolić N; Robinson EW; Koppenaal DW; Paša-Tolić L 21 T Fourier Transform Ion Cyclotron Resonance Mass Spectrometer Greatly Expands Mass Spectrometry Toolbox. J. Am. Soc. Mass Spectrom 2016, 27, 1929–1936. [DOI] [PubMed] [Google Scholar]
- (15).He L; Weisbrod CR; Marshall AG Protein de novo sequencing by top-down and middle-down MS/MS: Limitations imposed by mass measurement accuracy and gaps in sequence coverage. Int. J. Mass Spectrom 2018, 427, 107. [Google Scholar]
- (16).He L; Anderson LC; Barnidge DR; Murray DL; Hendrickson CL; Marshall AG Analysis of Monoclonal Antibodies in Human Serum as a Model for Clinical Monoclonal Gammopathy by Use of 21 T FT-ICR Top-Down and Middle-Down MS/MS. J. Am. Soc. Mass Spectrom 2017, 28, 827–838. [DOI] [PubMed] [Google Scholar]
- (17).Smith DF; Podgorski DC; Rodgers RP; Blakney GT; Hendrickson CL 21 T FT-ICR Mass Spectrometer for Ultrahigh-Resolution Analysis of Complex Organic Mixtures. Anal. Chem 2018, 90, 2041–2047. [DOI] [PubMed] [Google Scholar]
- (18).He L; Rockwood AL; Agarwal AM; Anderson LC; Weisbrod CR; Hendrickson CL; Marshall AG Diagnosis of Hemoglobinopathy and β-Thalassemia by 21-T Fourier Transform Ion Cyclotron Resonance Mass Spectrometry and Tandem Mass Spectrometry of Hemoglobin from Blood. Clin. Chem 2019, 65, 986. [DOI] [PubMed] [Google Scholar]
- (19).Park S-G; Anderson GA; Navare AT; Bruce JE Parallel Spectral Acquisition with an Ion Cyclotron Resonance Cell Array. Anal. Chem 2016, 88, 1162–1168. [DOI] [PMC free article] [PubMed] [Google Scholar]
- (20).Park S-G; Anderson GA; Bruce JE Parallel Spectral Acquisition with Orthogonal ICR Cells. J. Am. Soc. Mass Spectrom 2017, 28, 515–524. [DOI] [PMC free article] [PubMed] [Google Scholar]
- (21).Kooijman PC; Nagornov KO; Kozhinov AN; Kilgour DPA; Tsybin YO; Heeren RMA; Ellis SR Increased throughput and ultra-high mass resolution in DESI FT-ICR MS imaging through new-generation external data acquisition system and advanced data processing approaches. Sci. Rep 2019, 9, 8. [DOI] [PMC free article] [PubMed] [Google Scholar]
- (22).Nikolaev EN; Rakov VS; Futrell JH Analysis of harmonics for an elongated FTMS cell with multiple electrode detection. Int. J. Mass Spectrom. Ion Processes 1996, 157–158, 215–232. [Google Scholar]
- (23).Grosshans PB; Marshall AG Can Fourier transform mass spectral resolution be improved by detection at harmonic multiples of the fundamental ion cyclotron orbital frequency? Int. J. Mass Spectrom. Ion Processes 1991, 107, 49–81. [Google Scholar]
- (24).Misharin AS; Zubarev RA Coaxial multi-electrode cell (‘O-trap’) for high-sensitivity detection at a multiple frequency in Fourier transform ion cyclotron resonance mass spectrometry: main design and modeling results. Rapid Commun. Mass Spectrom 2006, 20, 3223–3228. [DOI] [PubMed] [Google Scholar]
- (25).Misharin AS; Zubarev RA; Doroshenko VM Fourier transform ion cyclotron resonance mass spectrometer with coaxial multi-electrode cell (‘O-trap’): first experimental demonstration. Rapid Commun. Mass Spectrom 2010, 24, 1931–1940. [DOI] [PubMed] [Google Scholar]
- (26).Pan Y; Ridge DP; Rockwood AL Harmonic signal enhancement in ion cyclotron resonance mass spectrometry using multiple electrode detection. Int. J. Mass Spectrom. Ion Processes 1988, 84, 293–304. [Google Scholar]
- (27).Nagornov KO; Gorshkov MV; Kozhinov AN; Tsybin YO High-Resolution Fourier Transform Ion Cyclotron Resonance Mass Spectrometry with Increased Throughput for Biomolecular Analysis. Anal. Chem 2014, 86, 9020–9028. [DOI] [PubMed] [Google Scholar]
- (28).Vorobyev A; Gorshkov MV; Tsybin YO Towards data acquisition throughput increase in Fourier transform mass spectrometry of proteins using double frequency measurements. Int. J. Mass Spectrom 2011, 306, 227–231. [Google Scholar]
- (29).Marshall AG; Hendrickson CL Fourier transform ion cyclotron resonance detection: principles and experimental configurations. Int. J. Mass Spectrom 2002, 215, 59–75. [Google Scholar]
- (30).Nikolaev EN; Gorshkov MV; Mordehai AV; Talrose VL Ion cyclotron resonance signal-detection at multiples of the cyclotron frequency. Rapid Commun. Mass Spectrom 1990, 4, 144–146. [Google Scholar]
- (31).Park S-G; Anderson GA; Bruce JE Characterization of Harmonic Signal Acquisition with Parallel Dipole and Multipole Detectors. J. Am. Soc. Mass Spectrom 2018, 29, 1394–1402. [DOI] [PMC free article] [PubMed] [Google Scholar]
- (32).Shaw JB; Gorshkov MV; Wu Q; Paša-Tolić L High Speed Intact Protein Characterization Using 4X Frequency Multiplication, Ion Trap Harmonization, and 21 T FTICR-MS. Anal. Chem 2018, 90, 5557–5562. [DOI] [PubMed] [Google Scholar]
- (33).Cho E; Witt M; Hur M; Jung M-J; Kim S Application of FT-ICR MS Equipped with Quadrupole Detection for Analysis of Crude Oil. Anal. Chem 2017, 89, 12101–12107. [DOI] [PubMed] [Google Scholar]
- (34).Kim D; Kim S; Son S; Jung M-J; Kim S Application of Online Liquid Chromatography 7 T FT-ICR Mass Spectrometer Equipped with Quadrupolar Detection for Analysis of Natural Organic Matter. Anal. Chem 2019, 91, 7690–7697. [DOI] [PubMed] [Google Scholar]
- (35).Thomas MJ; Collinge E; Witt M; Palacio Lozano DC; Vane CH; Moss-Hayes V; Barrow MP Petroleomic depth profiling of Staten Island salt marsh soil: 2ω detection FTICR–MS offers a new solution for the analysis of environmental contaminants. Sci. Total Environ 2019, 662, 852–862. [DOI] [PubMed] [Google Scholar]
- (36).Dziekonski ET; Johnson JT; McLuckey SA Utility of Higher Harmonics in Electrospray Ionization Fourier Transform Electrostatic Linear Ion Trap Mass Spectrometry. Anal. Chem 2017, 89, 4392–4397. [DOI] [PubMed] [Google Scholar]
- (37).Keifer DZ; Shinholt DL; Jarrold MF Charge Detection Mass Spectrometry with Almost Perfect Charge Accuracy. Anal. Chem 2015, 87, 10330–10337. [DOI] [PubMed] [Google Scholar]
- (38).Harper CC; Elliott AG; Lin H-W; Williams ER Determining Energies and Cross Sections of Individual Ions Using Higher-Order Harmonics in Fourier Transform Charge Detection Mass Spectrometry (FT-CDMS). J. Am. Soc. Mass Spectrom 2018, 29, 1861–1869. [DOI] [PubMed] [Google Scholar]
- (39).Bruce JE; Anderson GA; Lin C-Y; Gorshkov M; Rockwood AL; Smith RD A novel high-performance Fourier transform ion cyclotron resonance cell for improved biopolymer characterization. J. Mass Spectrom 2000, 35, 85–94. [DOI] [PubMed] [Google Scholar]
- (40).Park S-G; Anderson GA; Bruce JE Parallel detection in a single ICR cell: Spectral averaging and improved S/N without increased acquisition time. J. Am. Soc. Mass Spectrom 2017, 28, 515. [DOI] [PMC free article] [PubMed] [Google Scholar]
- (41).Ledford EB; Rempel DL; Gross ML Space charge effects in Fourier transform mass spectrometry. II. Mass calibration. Anal. Chem 1984, 56, 2744–2748. [DOI] [PubMed] [Google Scholar]
- (42).Marshall AG; Guan S Advantages of High Magnetic Field for Fourier Transform Ion Cyclotron Resonance Mass Spectrometry. Rapid Commun. Mass Spectrom 1996, 10, 1819–1823. [DOI] [PubMed] [Google Scholar]
- (43).Nikolaev EN; Vladimirov GN; Jertz R; Baykut G From Supercomputer Modeling to Highest Mass Resolution in FT-ICR. Mass Spectrom. 2013, 2, S0010–S0010. [DOI] [PMC free article] [PubMed] [Google Scholar]
- (44).Mohr JP; Perumalla P; Chavez JD; Eng JK; Bruce JE Mango: A General Tool for Collision Induced Dissociation-Cleavable Cross-Linked Peptide Identification. Anal. Chem 2018, 90, 6028–6034. [DOI] [PMC free article] [PubMed] [Google Scholar]
- (45).Keller A; Chavez JD; Felt KC; Bruce JE Prediction of an Upper Limit for the Fraction of Interprotein Cross-Links in Large-Scale In Vivo Cross-Linking Studies. Journal of Proteome Research. 2019, 18, 3077–3085. [DOI] [PMC free article] [PubMed] [Google Scholar]
- (46).Wu X; Siehnel RJ; Garudathri J; Staudinger BJ; Hisert KB; Ozer EA; Hauser AR; Eng JK; Manoil C; Singh PK; Bruce JE In Vivo Proteome of Pseudomonas aeruginosa in Airways of Cystic Fibrosis Patients. Journal of Proteome Research. 2019, 18, 2601–2612. [DOI] [PMC free article] [PubMed] [Google Scholar]
- (47).Weisbrod CR; Chavez JD; Eng JK; Yang L; Zheng C; Bruce JE In Vivo Protein Interaction Network Identified with a Novel Real-Time Cross-Linked Peptide Identification Strategy. Journal of Proteome Research. 2013, 12, 1569–1579. [DOI] [PMC free article] [PubMed] [Google Scholar]
Associated Data
This section collects any data citations, data availability statements, or supplementary materials included in this article.


