

Abstract
Brain acid signaling plays important roles in both physiological and disease conditions. One key neuronal metabotropic proton receptor in the brain is GPR68, which contributes to hippocampal long-term potentiation (LTP) and mediates neuroprotection in acidotic and ischemic conditions. Here, to gain greater understanding of GPR68 function in the brain, we performed mRNA-Seq analysis in mice. First, we studied sham-operated animals to determine baseline expression. Compared to wild-type (WT), GPR68−/− (KO) brain downregulated genes which are enriched in Gene Ontology (GO) terms of misfolding protein binding, response to organic cyclic compounds, and endoplasmic reticulum chaperone complex. Next, we examined the expression profile following transient middle cerebral artery occlusion (tMCAO). tMCAO-upregulated genes cluster to cytokine/chemokine-related functions and immune responses while tMCAO-downregulated genes cluster to channel activities and synaptic signaling. For proton-sensitive receptors, tMCAO downregulated ASIC1a, upregulated GPR4 and GPR65, but had no effect on ASIC2, PAC, or GPR68. GPR68 deletion did not alter the expression of these proton receptors, either at baseline or after ischemia. Lastly, we performed GeneVenn analysis of differential genes at baseline and post-tMCAO. Ischemia upregulated the expression of three hemoglobin genes, along with H2-Aa, Ppbp, Siglece, and Tagln, in WT but not in KO. Immunostaining showed that tMCAO-induced hemoglobin localized to neurons. Western blot analysis further showed that hemoglobin induction is GPR68-dependent. Together, these data suggest that GPR68 deletion at baseline disrupts chaperone functions and cellular signaling responses and imply a contribution of hemoglobin-mediated antioxidant mechanism to GPR68-dependent neuroprotection in ischemia.
Keywords: ischemia, neuroprotection, GPR68, OGR1, proton receptor, transcriptome
INTRODUCTION
Proton is one important signal in the brain. Increase in proton concentration, or pH reduction, occurs with increased neural activities (1–3). Under physiological conditions, proton signaling regulates a wide range of functions, which include modulating intracellular signaling and metabolism, regulating ion homeostasis, sensing CO2, and modulating synaptic function (4–9). Dysregulation of proton sensing mechanisms alters calcium homeostasis and neuron excitability, impairs synaptic plasticity and learning, compromises cerebral vascular functions (8, 10–12). Besides the physiological pH fluctuations, acidosis- a persistent brain pH reduction- occurs with aging, neuroinflammation, ischemic injury, traumatic brain injury, and in multiple types of neurodegenerative disorders (13, 14). Chronic acidosis is one important contributor to neuronal injury in multiple diseases (15, 16). Together, these data show that defining the molecular mechanism by which protons signal in the brain is important for a better understanding of brain physiology and the etiology of multiple diseases.
In recent studies, we and others have investigated whether protons signal through metabotropic proton receptors in the brain. GPR68 (also termed OGR1, which stands for Ovarian cancer G protein coupled receptor 1), a proton-sensitive GPCR, was present in neurons in multiple brain regions, including hippocampus, cortex, striatum, and cerebellum (12, 17, 18). GPR68 deletion impairs hippocampal long-term potentiation (LTP) and passive avoidance fear memory (12). In cerebellar granule cells, GPR68 mediates acid-induced calcium response (18). In organotypic cortical and hippocampal slices, GPR68 mediates acid-induced PKC activation (17). Deleting GPR68 worsens acidosis- and oxygen-glucose deprivation (OGD)-induced neuronal injury in slices. Following 45 min tMCAO in vivo, GPR68−/− (KO) mice exhibits larger brain infarct (17). Moreover, the effect of GPR68 deletion correlates with post-ischemia hemorrhagic transformation, with maximal effect observed when hemorrhagic transformation was moderate (19). Conversely, AAV-mediated overexpression of GPR68 in mouse brain reduces 60 min tMCAO-induced brain infarct size (17). Together, these data indicate that GPR68 functions as a ubiquitously expressed neuronal proton receptor in the brain. The results in synaptic plasticity and neuronal injury further underline the functional importance of GPR68 in the brain. However, the detailed molecular mechanism underlying these phenomena remains largely undefined.
Here, to generate more insights into how GPR68 alters neuron function and impacts neuronal injury, we performed RNA-Seq analysis in wild-type (WT) and KO mice. First, to determine how GPR68 deletion alters baseline gene expression and ontology, we compared the transcriptomes of sham-operated WT and KO animals. Next, to provide insights into ischemia-induced injury, we compared the sham and post-MCAO animals. Lastly, to identify potential GPR68-dependent protective mechanism in ischemia, we analyzed differentially expressed genes in post-ischemia brain tissue of WT and KO animals, and then validated the candidate protective genes with qPCR, immunostaining, and Western blot analysis.
MATERIALS AND METHODS
Mice
GPR68−/− mice have been described previously and were on a congenic C57BL/6 background (20). Wild-type C57BL/6 and knockout mice were maintained as breeding colonies at the University of South Alabama. The knockout mice were refreshed (backcrossed to C57BL/6 wild-type) every 5–10 generations, according to the Jackson Laboratory’s recommendations. For experiments in the current study, 8–11 week old age-matched male mice were used. Animal care met National Institutes of Health standards. All procedures were approved by the University of South Alabama Animal Care and Use Committee.
Antibodies and Reagents
Primary antibodies used: Hemoglobin (rabbit, Invitrogen PA5–97559) 1:2000; GAPDH (mouse IgG, Invitrogen PIMA531457 1:10K); NeuN (mouse IgG, Rockland Immunochemicals 200–301-X09 1:2000; chicken IgY, Abcam ab134014 1:2000). Secondary antibodies used: Alexa 488-, 568-, 680-, and 800-conjugated secondary antibodies, and Dylight 488-, 680- and 800- conjugated secondary antibodies (ThermoFisher Invitrogen, Rockland Immunologicals, & Jackson ImmunoResearch Lab). Molecular biology reagents were purchased from ThermoFisher, Bio-Rad, and Qiagen.
Transient Focal ischemia
The induction of transient focal ischemia in mice was performed as described earlier (17, 21). Briefly, 8–11 week old, body weight 25 ± 3 g, WT and GPR68−/− male mice (on congenic C57BL6 background) were used. Mice were randomly assigned to the sham-operated or tMCAO group. Anesthesia was maintained with 1.5% isoflurane, 70% N2O, and 28.5% O2. Rectal and temporalis muscle temperatures were kept at 37°C ± 0.5°C with a thermostatically controlled heating pad. To induce MCAO, a 7–0 silicon coated monofilament nylon surgical suture (Doccol 702023) was introduced through ECA into ICA and advanced ~7–8 mm past the CCA bifurcation. Occlusion was maintained for 45 min. To ensure consistency, cerebral blood flow (CBF) for all surgery animals was monitored for the entire duration by transcranial laser Doppler (MoorVMS-LDF2). Mice that failed to maintain a stable blood flow reduction between 5–20% of the original value, or failed to have at least 50% reperfusion of the original value following suture removal, or had a reperfusion rate exceeds 120% were excluded. Twenty four hours after tMCAO, mice were sacrificed and brains were isolated for further analysis.
Number of animals included and excluded for this study are detailed below. 1) For RNA-Seq, a total of 8 WT and 8 KO animals were used, including 3 sham-operated and 5 tMCAO animals for each genotype. All surgery animals met the CBF criteria. However, 1 WT and 1 KO in the MCAO group were not included for sequencing due to low RNA quality. 2) For RT-qPCR, besides the above samples used for RNA-Seq, we included additional 4 WT and 4 KO animals for the tMCAO group. All surgery animals in this cohort met the CBF criteria for inclusion. To generate internal calibration curves for expression (see qPCR section for detail), we also added one sham operated WT animal. 3) For immunolocalization of hemoglobin in ischemic brain, we performed MCAO on 3 WT mice and 1 was excluded based on CBF. 4) For Western blot, we used two groups of samples. The first cohort is the same set used for RNA-Seq, and we extracted proteins from the TRiZol precipitated fraction as described below. For the second cohort, we included additional 8 WT and 7 KO mice, which include 2 sham animals for each genotype. For this cohort, 1 WT died during the surgery while 2 WT and 1 KO were excluded for not meeting the CBF criteria. These two cohorts of samples generated similar changes in hemoglobin, and were combined for statistical analysis.
Brain RNA isolation, Reverse Transcription (RT), and quantitative Polymerase Chain Reaction (qPCR)
Total RNA from mouse brain (perfused with saline or PBS prior to isolation) was isolated similar to what was described previously (19). Briefly, RAN was extracted using TRIzol and a RNeasy Kit (Qiagen), following manufacturer’s instruction. RNA was treated with DNA free (ThermoFisher) to remove genomic DNA. For RT-qPCR, RT was performed using random hexamer. qPCR was performed in 96 well plates using the iTaq Universal SYBR Green SMX and CFX connected optical module (Bio-Rad, Hercules, CA). PCR primers were listed in the table below. All PCR reactions were performed with the following steps: 95°C for 3 min; 40 cycles of denaturation, 95°C for 15 sec and annealing/extension, 60°C for 30 sec. All RT-qPCR was repeated three times. To calibrate for the relative level of expression, we used a standard curve method similar to what was described in previous studies (22, 23). Briefly, serial dilution of 1:1, 1:3, 1:9, 1:27, 1:81 of the RT product of a control (sham-operated) brain was used for qPCR to generate a set of standard curves for all genes. With these curves, the raw CT number of each gene in ischemic samples was back calculated to the loading amount (relative to the standard). To determine the relative change in expression, the calibrated value of each gene was then normalized to that of the internal control (Hprt or GAPDH). The ratio was used for comparing the expression level between groups. Both normalizing to Hprt (Fig. 6) or GAPDH (not shown) yielded similar results. Primers used are listed in Table 1.
Figure 6. GPR68 mediates ischemia-induced upregulation of hemoglobin.
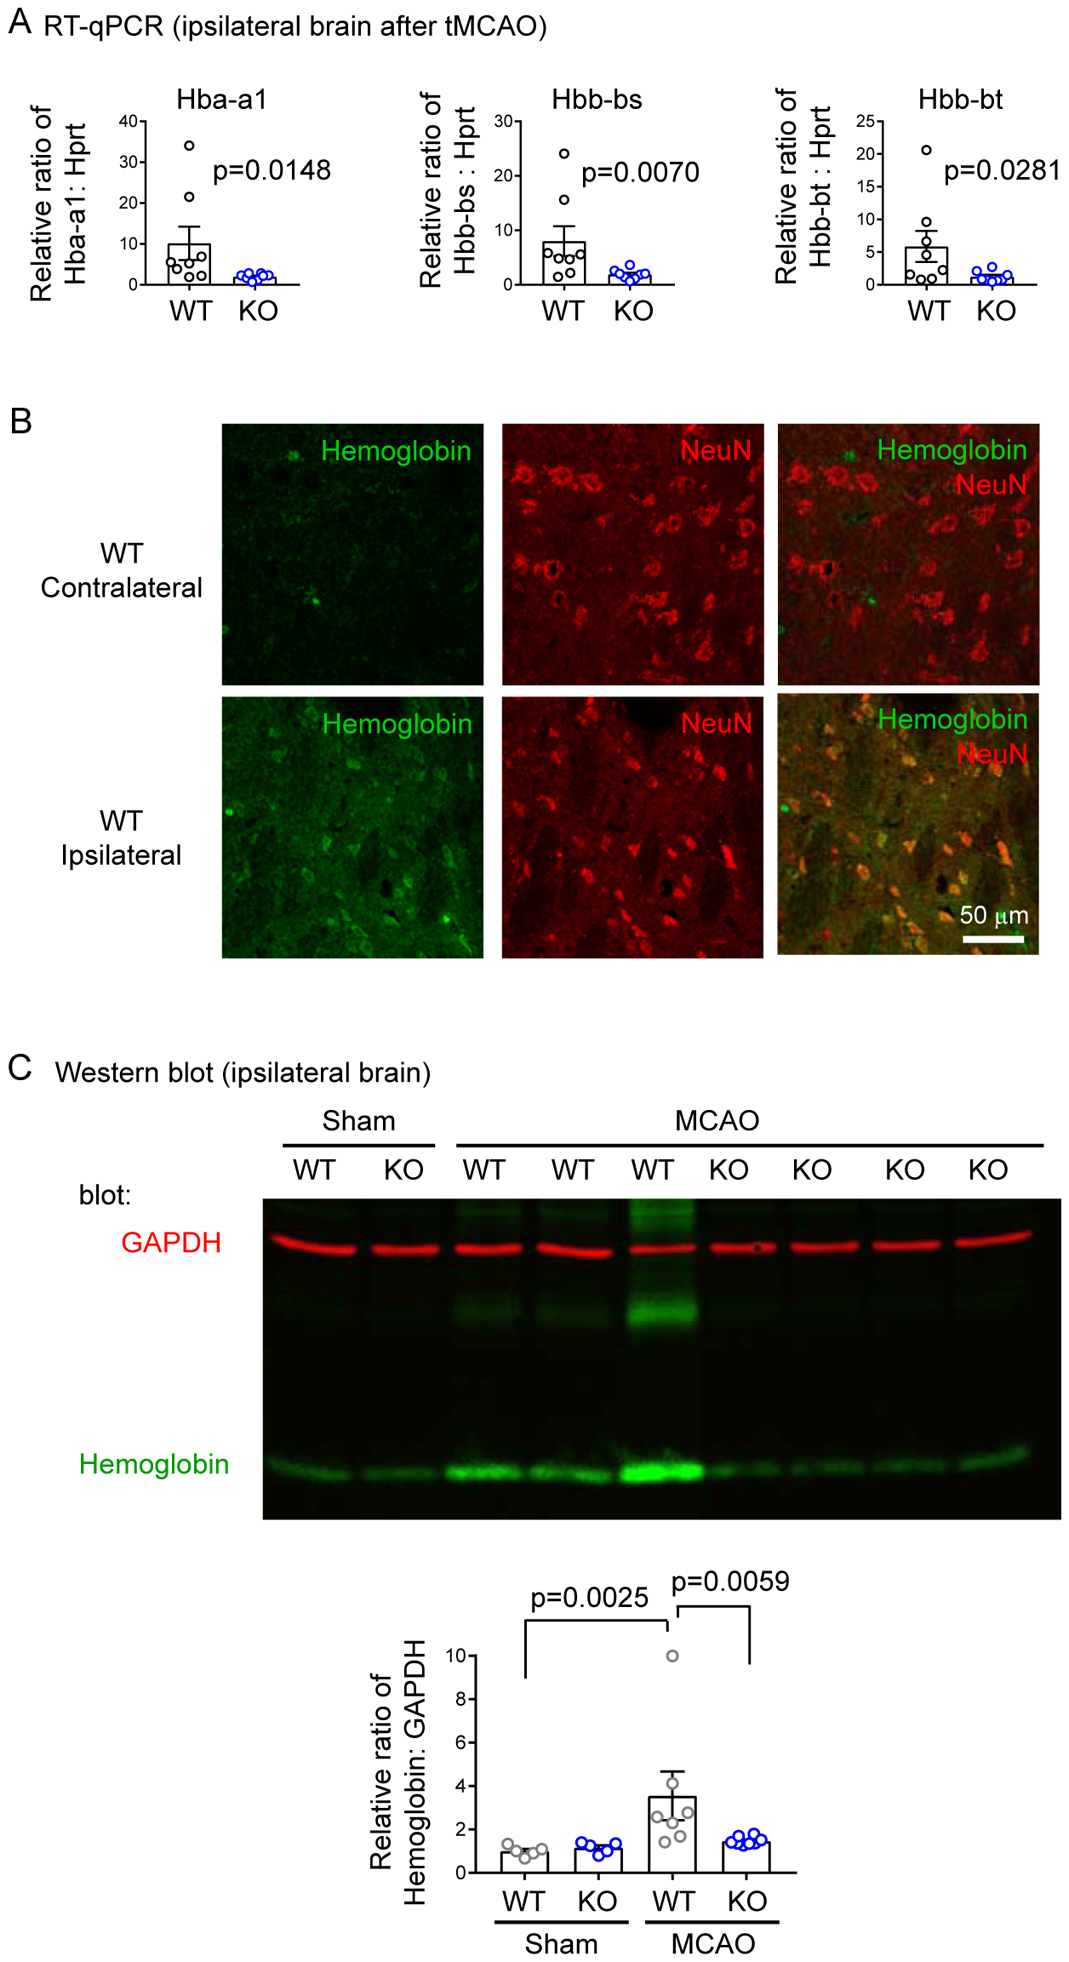
(A) RT-qPCR verification of the three hemoglobin genes which were enriched in most Molecular Functions in Figure 5. The expression level was first normalized to a standard curve, as described in Method. Then the relative ratio of Hba or Hbb genes were normalized to that of Hprt. Each dot represents one animal. P values were from Mann-Whitney U test. (B) Immunolocalization of hemoglobin. Cryosections of WT tMCAO brain was stained with anti-hemoglobin (green) and anti-NeuN (red). Images were from contralateral (left panel) and ipsilateral (right panel) striatum. Note that most of increased hemoglobin signals in the ipsilateral side colocalize with NeuN staining. (C) Western blot verification of hemoglobin levels after tMCAO. Ipsilateral brain tissues were collected from sham operated or tMCAO (45’) animals at 24 hr after surgery. Lysates were blotted for hemoglobin and GAPDH (loading control). The summary was from 3 experiments with each dot represent one mouse. To allow comparison between the 3 cohorts of animals, average raw pixel ratio of Hemoglobin to GAPDH of WT sham in each experiment was set arbitrarily to 1.
Table 1.
Primers used for PCR.
| Gene | Forward primer 5’-3’ | Reverse primer 5’-3’ |
|---|---|---|
| Mouse Hbb-bs | TGTGTTGACTCACAACCCCA | ACTTCATCGGCGTTCACCTT |
| Mouse Hbb-bt | AGGCTCCTGGGCAATATGAT | AGCAGAAAAGGGGCTTAGTGG |
| Mouse Hba-a1 | TGCATGCCTCTCTGGACAAAT | GCAGAAGGCAGCTTAACGGT |
| Mouse GAPDH | GGTGCTGAGTATGTCGTGGAGTCTA | AAAGTTGTCATGGATGACCTTGG |
| Mouse Hprt | AGCCTAAGATGAGCGCAAGT | GGCCACAGGACTAGAACACC |
mRNA-Seq and analysis
Gene expression changes were examined acutely (24 hr after tMCAO or sham operation). Library construction, RNA sequencing (Illumina platforms), and generation of FPKM and initial set of differential genes were performed by Novogene, Inc. Bioinformatics was performed similar to the procedures described in previous studies (24–26). Reference genome and gene model annotation files were downloaded from genome website browser (NCBI/UCSC/Ensembl) directly. Indexes of the reference genome were built using STAR and paired-end clean reads were aligned to the reference genome using STAR (v2.5). STAR used the method of Maximal Mappable Prefix (MMP) which can generate a precise mapping result for junction reads. Alignments were parsed using Tophat program and differential expressions were determined through DESeq2/edgeR. GO and KEGG enrichment were implemented by the ClusterProfiler. For quantification of gene expression level, HTSeq v0.6.1 was used to count the read numbers mapped of each gene. FPKM of each gene was calculated based on the length of the gene and reads count mapped to this gene (27).
Initial analysis of differential expression between two conditions/groups (two biological replicates per condition) was performed by Novogene using the DESeq2 R package (2_1.6.3). DESeq2 provides statistical routines for determining differential expression in digital gene expression data using a model based on the negative binomial distribution. The resulting P-values were adjusted using the Benjamini and Hochberg’s approach for controlling the False Discovery Rate (FDR). Genes with an adjusted P (Padj) value <0.05 found by DESeq2 were assigned as differentially expressed. Gene Ontology (GO) enrichment analysis of differentially expressed genes was implemented by the clusterProfiler R package, in which gene length bias was corrected. For subsequent analysis of groups of selected genes (e.g., top 500 changes, or grouped genes identified by GeneVenn analysis), an online g:Profiler program (https://biit.cs.ut.ee/gprofiler/gost) was used for enrichment analysis (28). Ontology terms with corrected Padj value < 0.05 were considered significantly enriched by differential expressed genes. For test of the enrichment differentially expressed genes in KEGG pathways, clusterProfiler R package was used. For comparing differential genes to generate Venn diagrams, we used a Gene Venn Program (http://genevenn.sourceforge.net/) (29).
Brain isolation, Cryosection, and Immunostaining
The mice were perfused with phosphate buffered saline (PBS) or saline and brain was rapidly isolated, snap-froze on dry ice, and stored at −80°C till use. For histology, saline perfusion was followed by 30–50 ml of 4% paraformaldehyde in PBS. The brains were then isolated and post-fixation in 4% paraformaldehyde (for one night) or 2% paraformaldehyde (for two nights). The brains were protected overnight in 15% and then 25 or 30% sucrose, and sectioned coronally at 12 or 16 μm thickness. The slices were adhered to SuperFrost plus glass slides, air-dried overnight, and stored at -20°C until use. For immunostaining, we used a protocol similar as previously described (21). Briefly, the slices were rehydrated and permeabilized with PBS 1% Triton for 1–2 hrs. The sections were blocked sequentially (20–30 min each at room temperature) with 50 mM NH4Cl and blocking buffer (PBS, 10% Horse serum, 5 mg/ml BSA, 0.2% Triton X-100). For antibody dilution and washing, the buffer was a 1:4 dilution of the blocking buffer with PBS. We added primary antibodies to the slides and incubated the slides overnight at 4°C in a moisturized dark box, washed three times (5 min per wash with gentle rocking at room temperature) with washing buffer, and added Alexa- or DyLight-conjugated secondary antibodies (1:600–1000 dilutions) and incubated at room temperature for 2 hr. We mounted the slides with either a homemade 50% glycerol based mounting media or with fluorescence mounting media (Agilent Dako) and imaged with a Nikon A1R confocal microscope.
Western blot.
For Western blot analysis, freshly isolated brain tissue was stored at −80 °C until use. To lyse fresh tissue, lysis buffer was PBS with 1% Triton X-100, 0.5% SDS, with freshly added protease inhibitors and phosphatase inhibitors. Lysates were sonicated briefly and cleared by centrifugation. To extract protein following TRIzol isolation of RNA, we used a protocol similar to what was described by the manufacturer’s instructions and used in previous studies (30, 31). Briefly, following RNA extraction, 0.3 ml of ethanol per ml TRIzol was added to the leftover organic phase to precipitate DNA. The resulting phenol-ethanol phase, which contains proteins, was transferred to a new tube. 2–3 volume of isopropanol was added to the phenol-ethanol solution to precipitate proteins. Samples were vortexed and incubated for 10 min at room temperature and pelleted by centrifugation at 15000 rpm for 10 min. Pellet was washed rigorously 2–3 times with 0.3 M guanidine hydrochloride in 95% ethanol, followed by 4–6 times in 95% ethanol until the pellet no longer carrying the pink color from TRIzol. All trace ethanol was removed from the pellet. To dissolve proteins, 2% SDS was added to the pellet and incubated on heating block. Pellet was pipetted every 10–15 mins until all pellet was dissolved.
Protein concentration was determined using a Bio-Rad Rc-Dc protein assay kit. Equal amount of protein was loaded per lane. Before loading, 1/2 volume of 3x SDS sample buffer was added to the lysates, and incubated at ~50 °C for 15–20 min. The samples were separated by 10% SDS-PAGE and transferred to nitrocellulose membranes. Blotting was performed according to instructions of the Odyssey Imaging System (Li-cor). Briefly, membranes were blocked in blocking buffer (0.1% casein in 0.2×PBS pH 7.4) for 1 h. Primary antibodies were diluted with blocking buffer containing 0.1% Tween-20 and incubated at 4 °C overnight or at room temperature for 2 h. Secondary antibodies were diluted in blocking buffer containing 0.1% Tween-20 and 0.01% SDS and incubated at room temperature for 1 h. Blots were imaged using an Odyssey Infrared Imaging System according to manufacturer’s instructions. Densitometry of imaged bands was performed as described earlier (32).
Confocal Microscopy
For confocal imaging, images were captured using a laser scanning microscope (Nikon A1R), similar to procedures described earlier (21). Briefly, illumination was provided by an argon (Ar, 458, 488, 514 nm lines) and a 563 diode laser, and a 642 laser. Green, red, and far red channels were imaged sequentially to eliminate bleed-through, using 488 nm excitation and a 525/50 emission filter, 563 nm excitation and a 595/50 emission filter, and 642 nm excitation and 710/75 emission filter, respectively. Images were captured with a 4×, 20×, or 60×/1.2 PL APO water lens. Each captured image was an average of 4 scans in a single plane.
Statistical analysis
Statistics for differential gene analysis was detailed above in the RNA-Seq section. For other analysis, we used GraphPad Prism and Microsoft Excel. For comparisons between two groups, we used 2-tailed Student’s t-test or Mann-Whitney U test. For multiple comparisons, we used ANOVA followed by Tukey HSD post hoc correction. Differences were considered significant if p < 0.05.
Data availability
All data supporting the findings of this study are available within the paper and its supplementary information files. Additional inquires can be directed to the corresponding author.
RESULTS
GPR68 deletion on gene expression at baseline
To gain insight into the mechanism by which GPR68 regulates brain function, we compared transcriptome changes between sham-operated groups. Figure 1A shows the overall experimental design. At 24 hr after operation, we isolated ipsilateral and contralateral brain tissue as illustrated, extracted total RNA, and performed RNA-Seq of the transcriptome. The top two upregulated genes in the knockout (KO) were serpina3n and a pseudogene RP23–8J15.5, while the top two downregulated genes were Gm15446 and mt-Nd3 (Figure 1B). GPR68 deletion preferentially downregulated genes enriched in Gene Ontology (GO) terms of misfolded protein binding and ER chaperone complex (Figure 1B–D). The genes clustered in these functions include HSPA1B, HSPA5 and SDF2L1. In addition, 8 of the 25 downregulated genes clustered to GO- response to organic cyclic compound. For the genes upregulated in GPR68−/−, significantly different GO functions include detoxification function of copper ion and inorganic compounds and the stress response to copper. The two genes clustered in these functions are metallothionein 1 (MT1) and 2 (MT2).
Figure 1. Transcriptome changes in GPR68−/− brain.
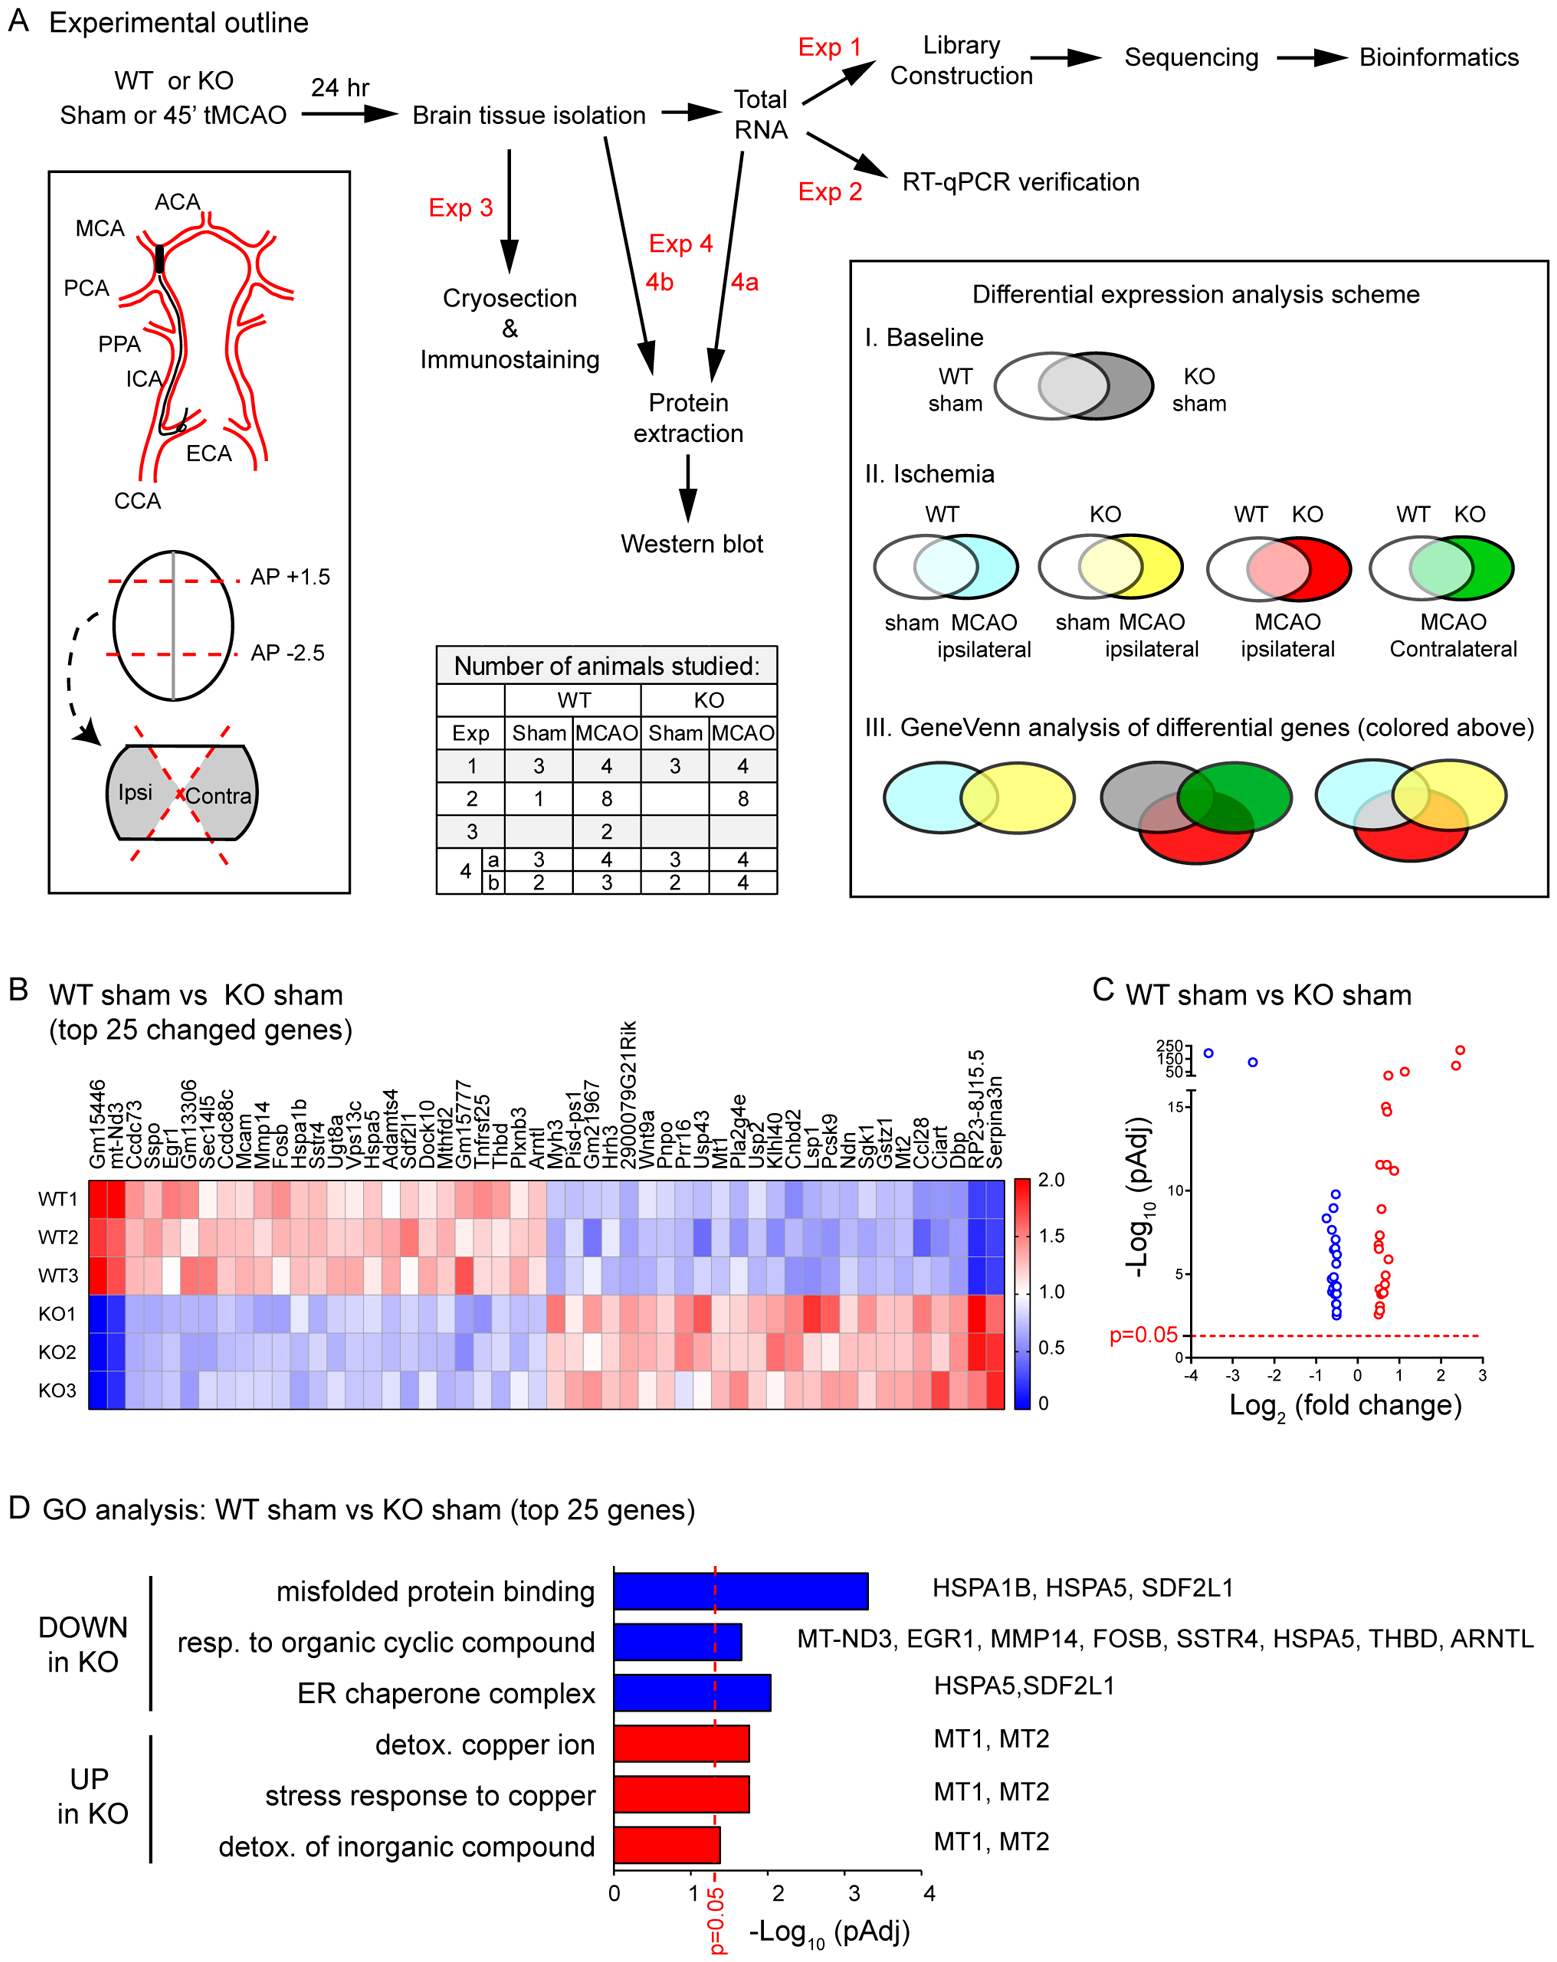
(A) Experimental outline and analysis scheme. Top row shows the experimental flow chart for the 4 sets of experiments (exp 1–4) performed in this study. The table below shows the number of animals studied for each experiment (see Methods for more details on inclusion/exclusion criteria and number of animals excluded). Lower left box shows the scheme of the MCAO surgery. At 24 hr after the reperfusion, ipsilateral and contralateral brain tissue, approximately between AP 1.5 and −2.5, was isolated as illustrated. The boxed region on the right shows the scheme of three main groups of gene expression analysis: I. Baseline difference between WT and KO; II. Ischemia-induced changes; III. GPR68-dependent differential expression after ischemia. (B) Heat map and (C) Volcano plot showing the top 25 up- and down-regulated genes in GPR68−/− (vs. WT) brain. Sham operated brain tissues (3 WT and 3 KO) were used for RNA isolation and RNA-Seq analysis. In B, each row represents the profile of one animal. For all genes listed here, the differences between the two genotypes had the adjusted p value (PAdj) < 0.00001. In C, the X axis shows the fold change (log2 value) of the genes in KO as compared to WT, while the Y axis shows the PAdj value (in −log10 format). (D) Summary graph showing significantly changed GO functions of the top 25 downregulated (in blue bar) and upregulated (in red bar) genes. To the left of the Y axis shows the GO terms. The specific genes clustered to the corresponding GO function are shown on the right side of the bars. In C and D, red dashed lines on graphs indicate the line of Padj = 0.05.
Ischemia-induced expression change at 24 hr after reperfusion
Next, we examined acute transcriptome change following tMCAO. Figure 2A presented the heatmap comparing all conditions. The largest profile change was observed between treatment groups, with the ipsilateral (injury) side exhibited largest difference compared to the sham group. In contrast, the contralateral side of both genotypes exhibited profiles closer to the sham group as compared to the ipsilateral post-tMCAO brain. To determine key ontology functions altered by ischemia, we performed GO analysis based on top 500 up- and down-regulated genes in WT ipsilateral brain tissue (as compared to sham group). For upregulated genes, the main GO clusters include cytokine signaling, chemokine signaling, immune responses, and response to stress (Figure 2B). For downregulated genes, the key clusters involve channel activities, transporter activities, and synaptic signaling.
Figure 2. Ischemia-induced gene profile changes.
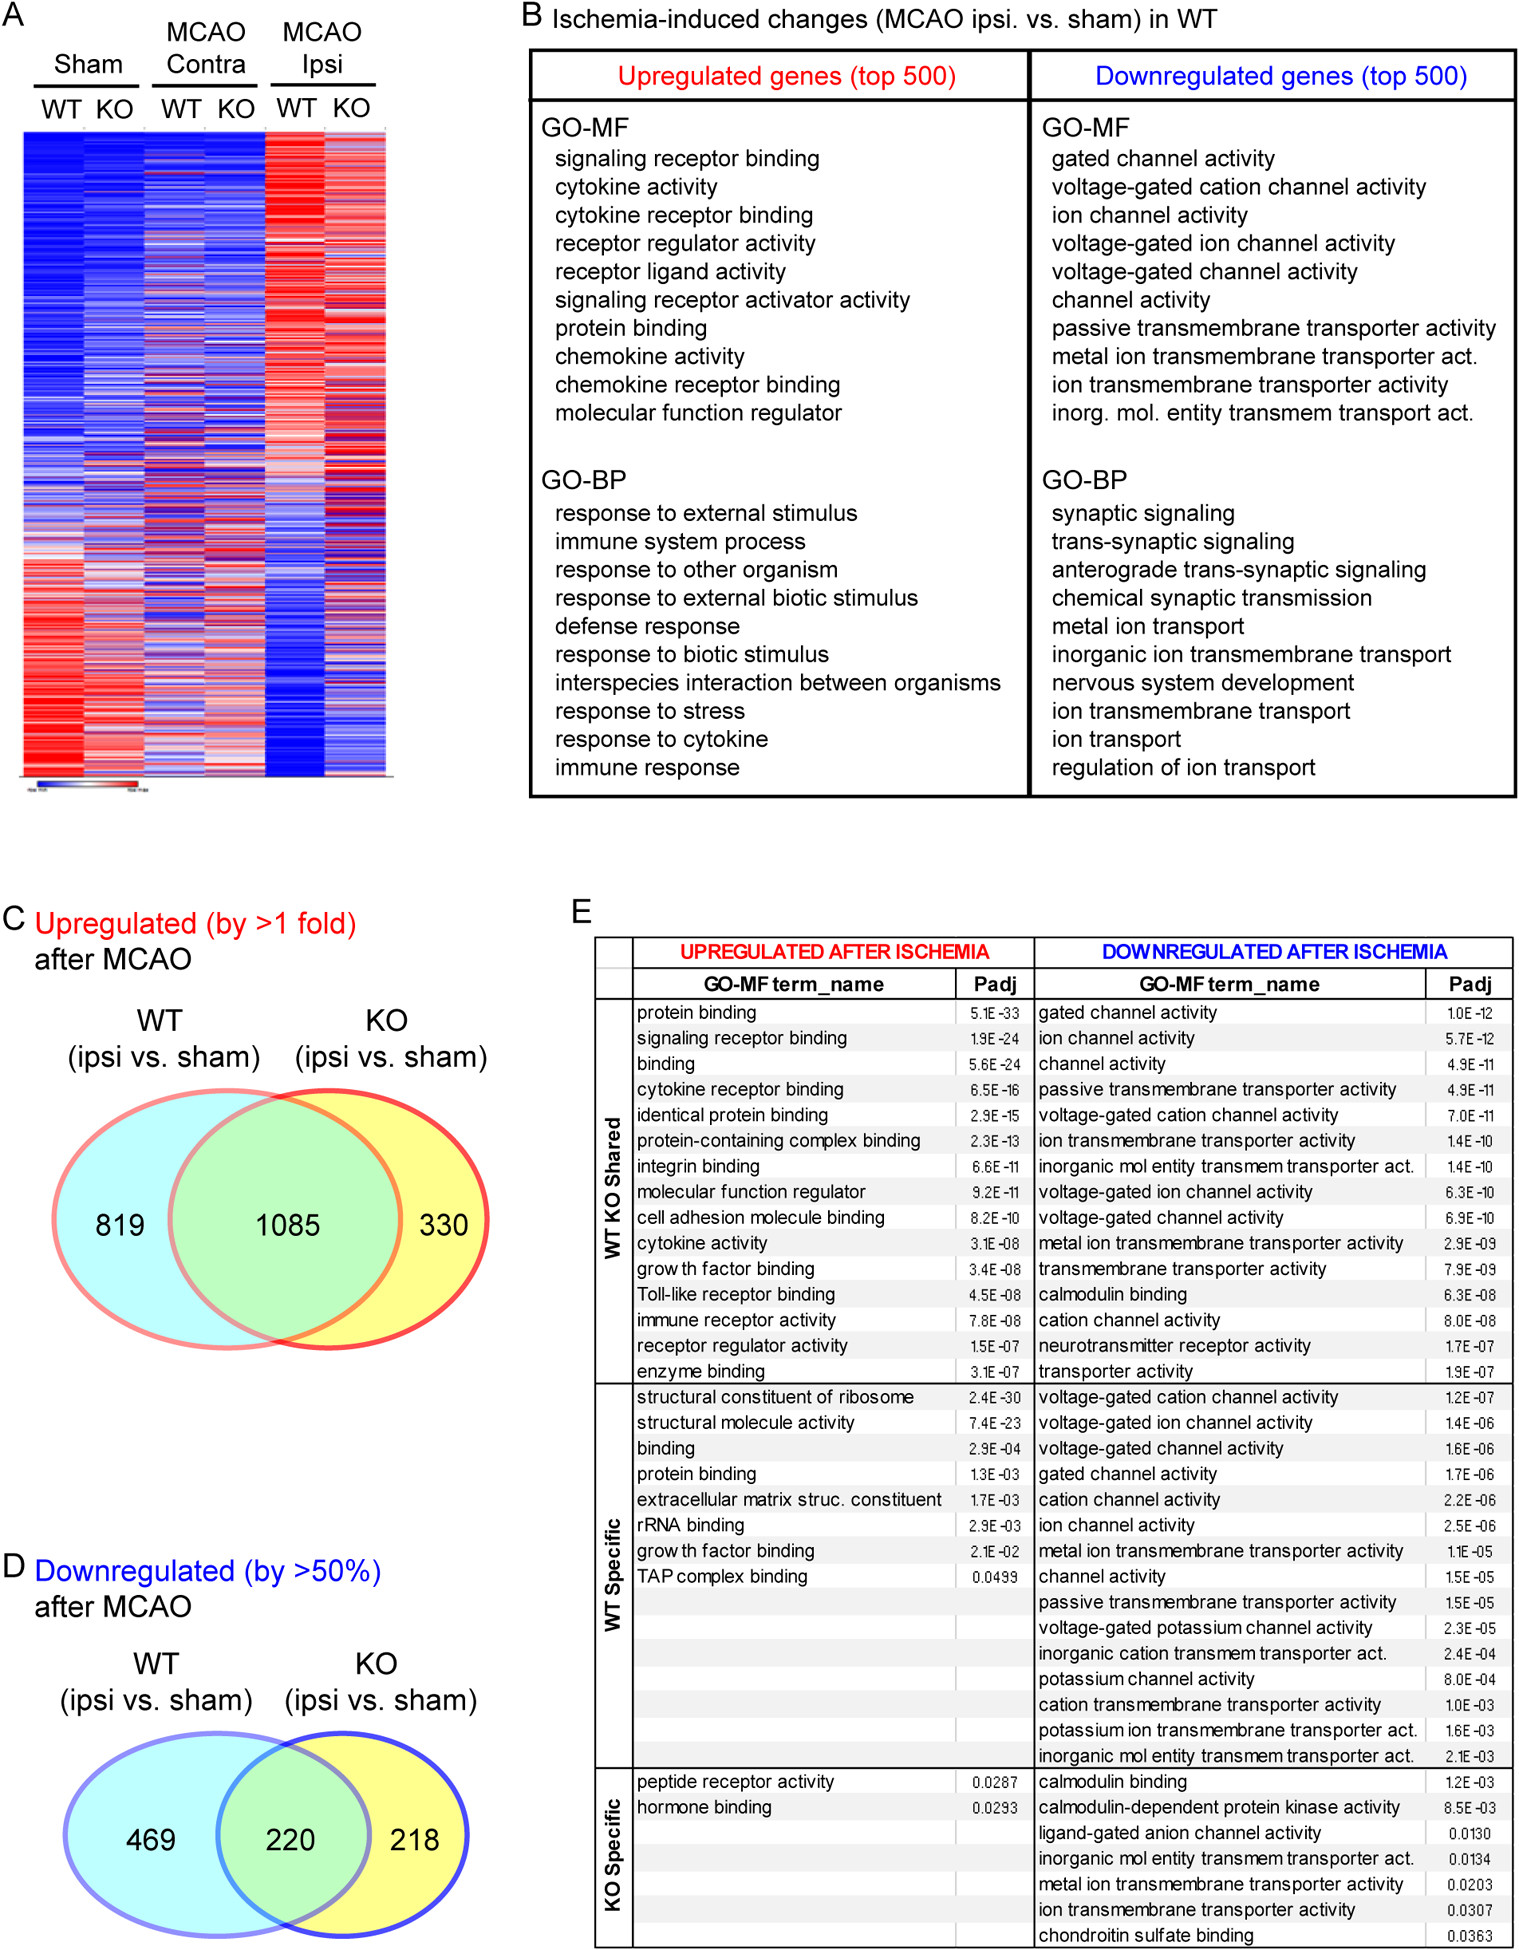
(A) Heatmap showing transcriptome profile in sham operated, MCAO-contralateral brain, MCAO-ipsilateral brain of WT and GPR68−/− animals. (B) GO analysis of top 500 ischemia-altered genes in WT. The list shows the top 10 functions in MF (Molecular Function) and BP (Biological Pathway). (C & D) GeneVenn summary of ischemia-induced differential genes in WT and KO. For each genotype, ischemia-induced changes were analyzed by comparing ipsilateral brain to the sham control. The genes upregulated for >1 fold or downregulated for >50% in each genotype were used for GeneVenn analysis as described in Methods. (E) GO Molecular Function summary of ipsilateral side upregulated and downregulated genes (see Supplemental Table 1 for the gene list in each category). Genes upregulated or downregulated were separated into three categories: 1) WT KO shared refers to those which exhibited changes in both genotypes; 2) WT only for those changed solely in WT; c) KO only for those changed solely in the knockout. For detailed lists of all functional enrichment, see Supplemental Workbook 1.
To compare ischemia-induced changes between WT and KO, we performed Venn analysis on genes which exhibited changes in the ipsilateral vs. sham comparison of the two genotypes. For genes which exhibited an increase of >1 fold in the ipsilateral side, WT had 1904 genes while knockout had 1415 genes. Of these upregulated genes, the two genotypes shared 1085 of them (Figure 2C, see Supplemental Table 1 for detailed list of differentially expressed genes). For genes which exhibited >50% downregulation, WT and GPR68−/− had 689 and 438 genes, respectively. Among these, the two genotypes shared 220 genes (Figure 2D, Supplemental Table 1).
In Gene Ontology analysis, most of the upregulated genes shared between the two genotypes were clustered in GO-MF related to receptor signaling, cytokine and immune function, or protein/ligand binding (Figure 2E, supplemental workbook 1). In contrast, most of the downregulated genes shared between WT and knockout were clustered in Molecular Functions related to channel activities. For GO-BP or KEGG terms, most of the genes upregulated were related to immune/stress responses and related signaling pathways. The downregulated genes were clustered to synaptic related functions, including trans-synaptic signaling, calcium and cAMP signaling, addiction, and LTP (Supplemental workbook 1). For genes exhibited unique expression changes in WT, those upregulated were clustered in structural function and protein binding while the downregulated genes were mostly related to channel/transporter activity or function. In contrast, the 330 genes uniquely upregulated in the ipsilateral side of GPR68−/− exhibited diminished clustering, as evidenced by limited numbers of MF with a significant Padj value (Figure 2E).
GPR68 deletion abolished tMCAO-induced upregulation of hemoglobin
To generate more insight into how GPR68 effects ischemic injury, we compared differential expression profiles of contralateral and ipsilateral sides between the two genotypes. For contralateral side, KO had 14 genes downregulated and 5 genes upregulated as compared to the WT (Figure 3A). For ipsilateral side, KO had 19 genes downregulated and 7 genes upregulated (Figure 3B). Among these genes, 9 downregulated and 3 upregulated genes occurred in both contralateral and ipsilateral sides.
Figure 3. GPR68-dependent changes after stroke in contralateral and ipsilateral brain.
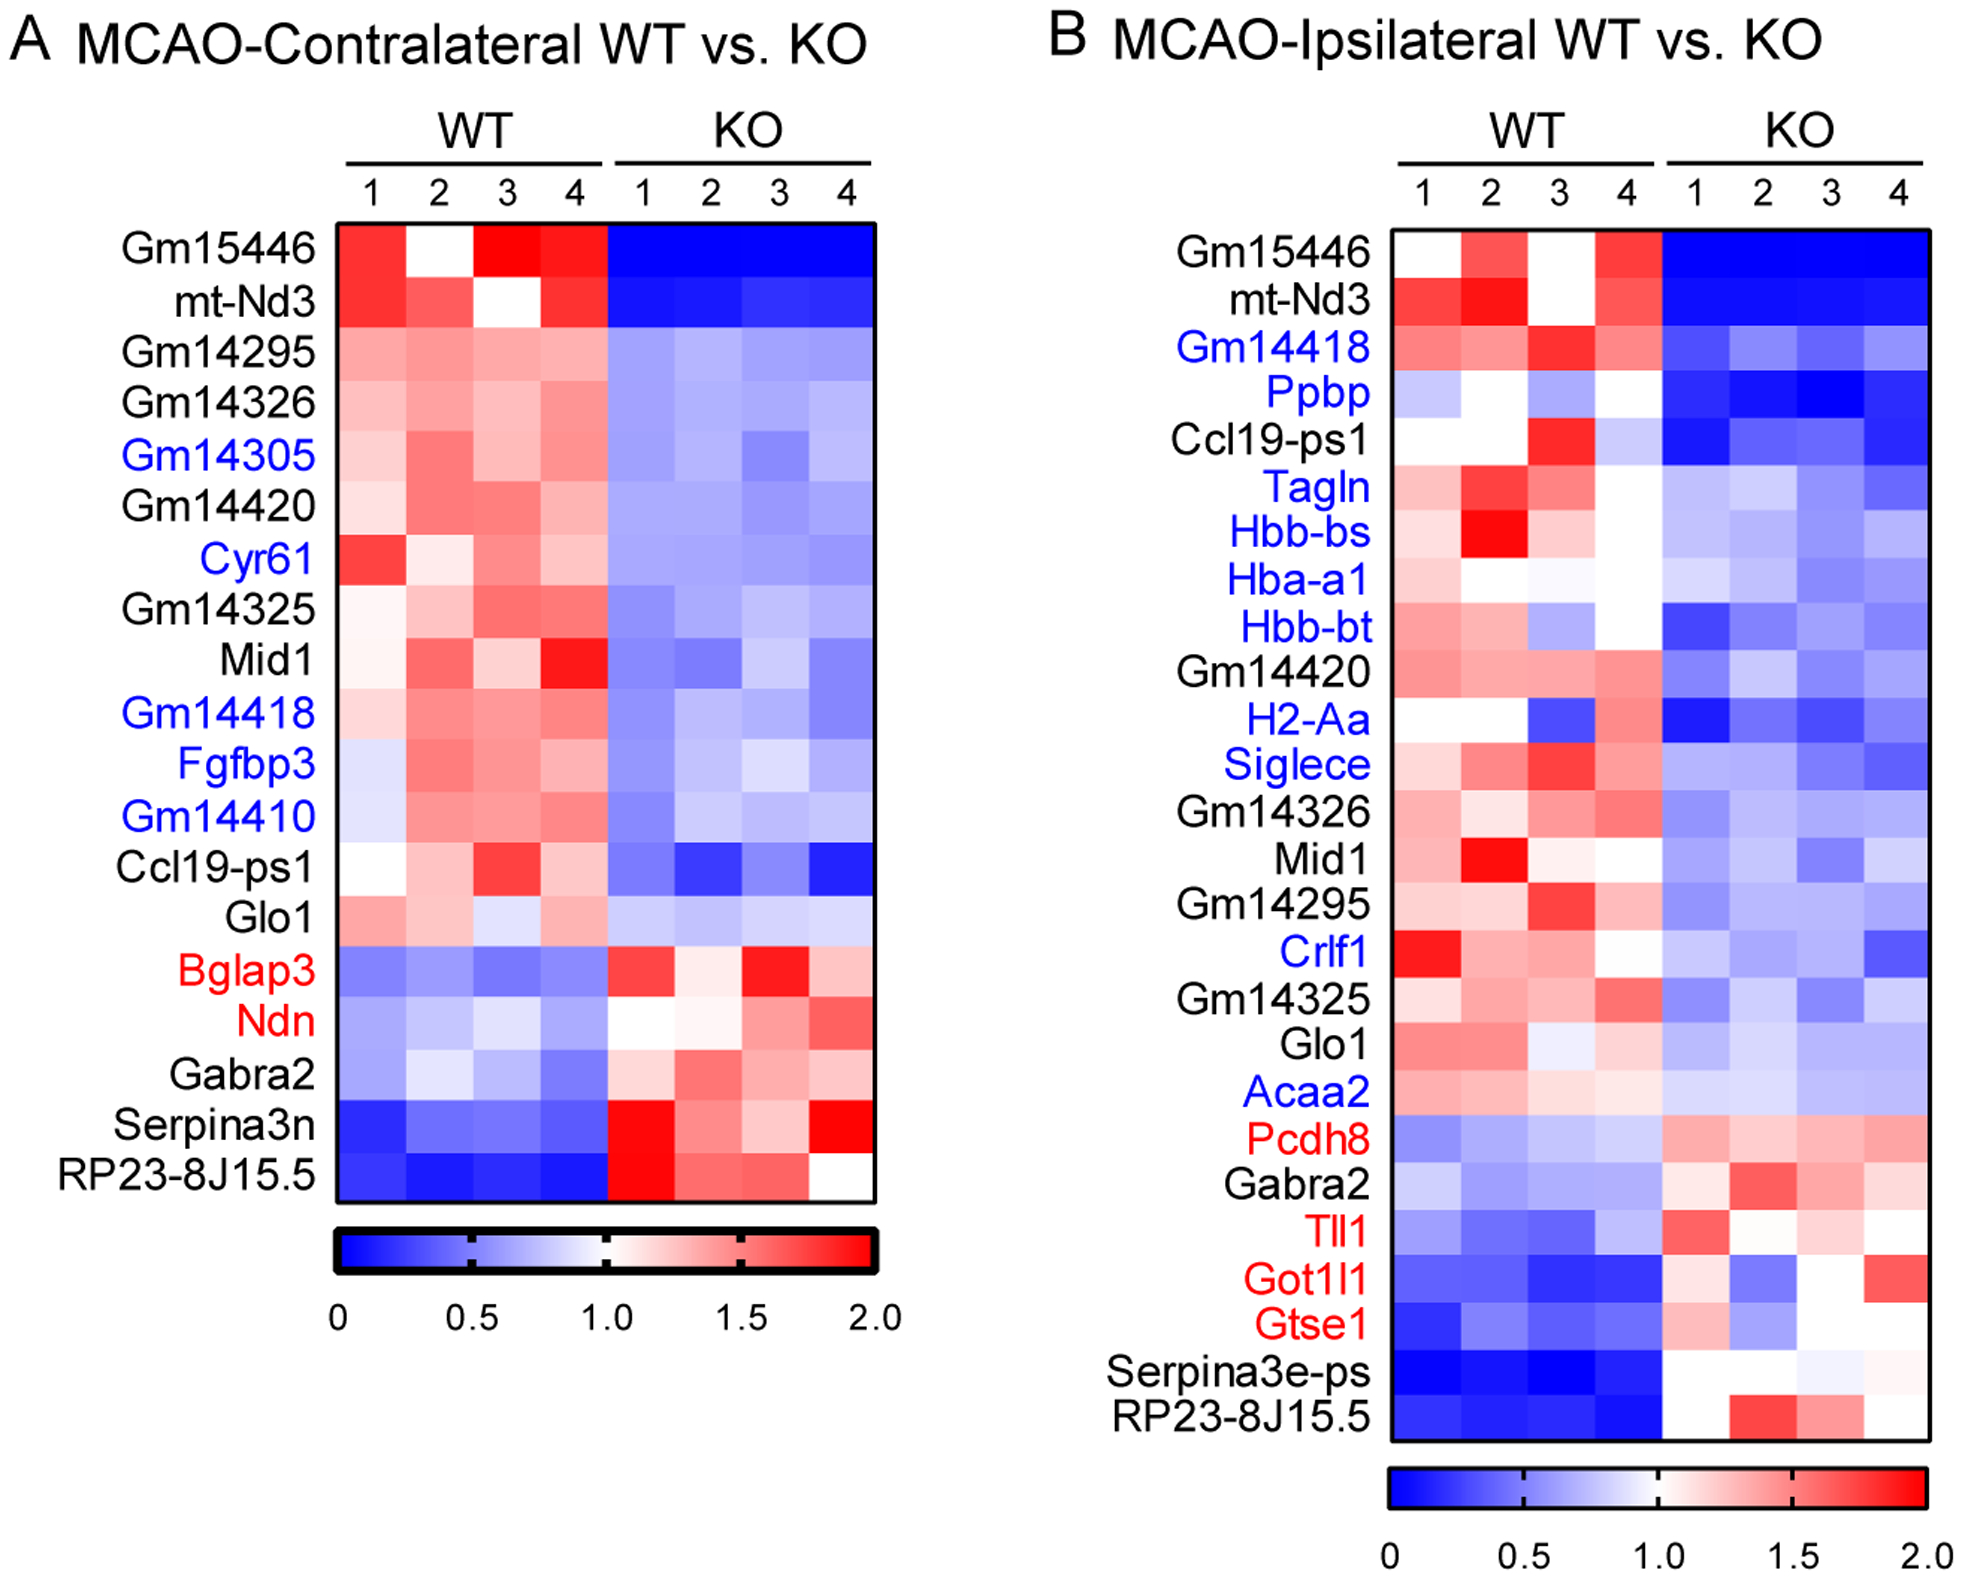
(A & B) Heatmap showing differential genes in the GPR68−/− vs WT comparison of post-tMCAO contralateral (A) and ipsilateral (B) brain tissues.
In our recent studies, we showed that GPR68 mediated a protective function against ischemia-induced brain injury (17, 19). We reasoned that the candidate genes contributing to this protective function would a) exhibit differentially alterations only in the ipsilateral brain of GPR68−/− animals, and b) exhibit either no change or changes in opposite direction as compared to the WT. Therefore, to narrow down potential candidate genes to explain GPR68-dependent mechanism, we performed additional analysis as described below.
First, we compared genes which exhibited upregulation in KO (as compared to the WT) in the sham, tMCAO contralateral, and tMCAO ipsilateral groups. Among the 7 genes upregulated in tMCAO-ipsilateral brain in the GPR68−/− vs. WT comparison, 5 of them were unique to this group and not upregulated in either sham KO vs. WT or tMCAO-contralateral KO vs. Wt comparisons (Figure 4A). However, none of these 5 genes exhibited downregulation in the WT ipsilateral vs. sham comparison (Figure 4B). When we compared against the genes which exhibited upregulation following tMCAO in WT and GPR68−/−, the only gene shared among the three groups was Gtse1 (Figure 4C). Thus, these genes do not fit candidates for protective mechanism. Instead, their upregulation likely contributed to, or was a consequence of, worsened injury in the knockout.
Figure 4. GeneVenn analysis of upregulated genes in GPR68−/−.
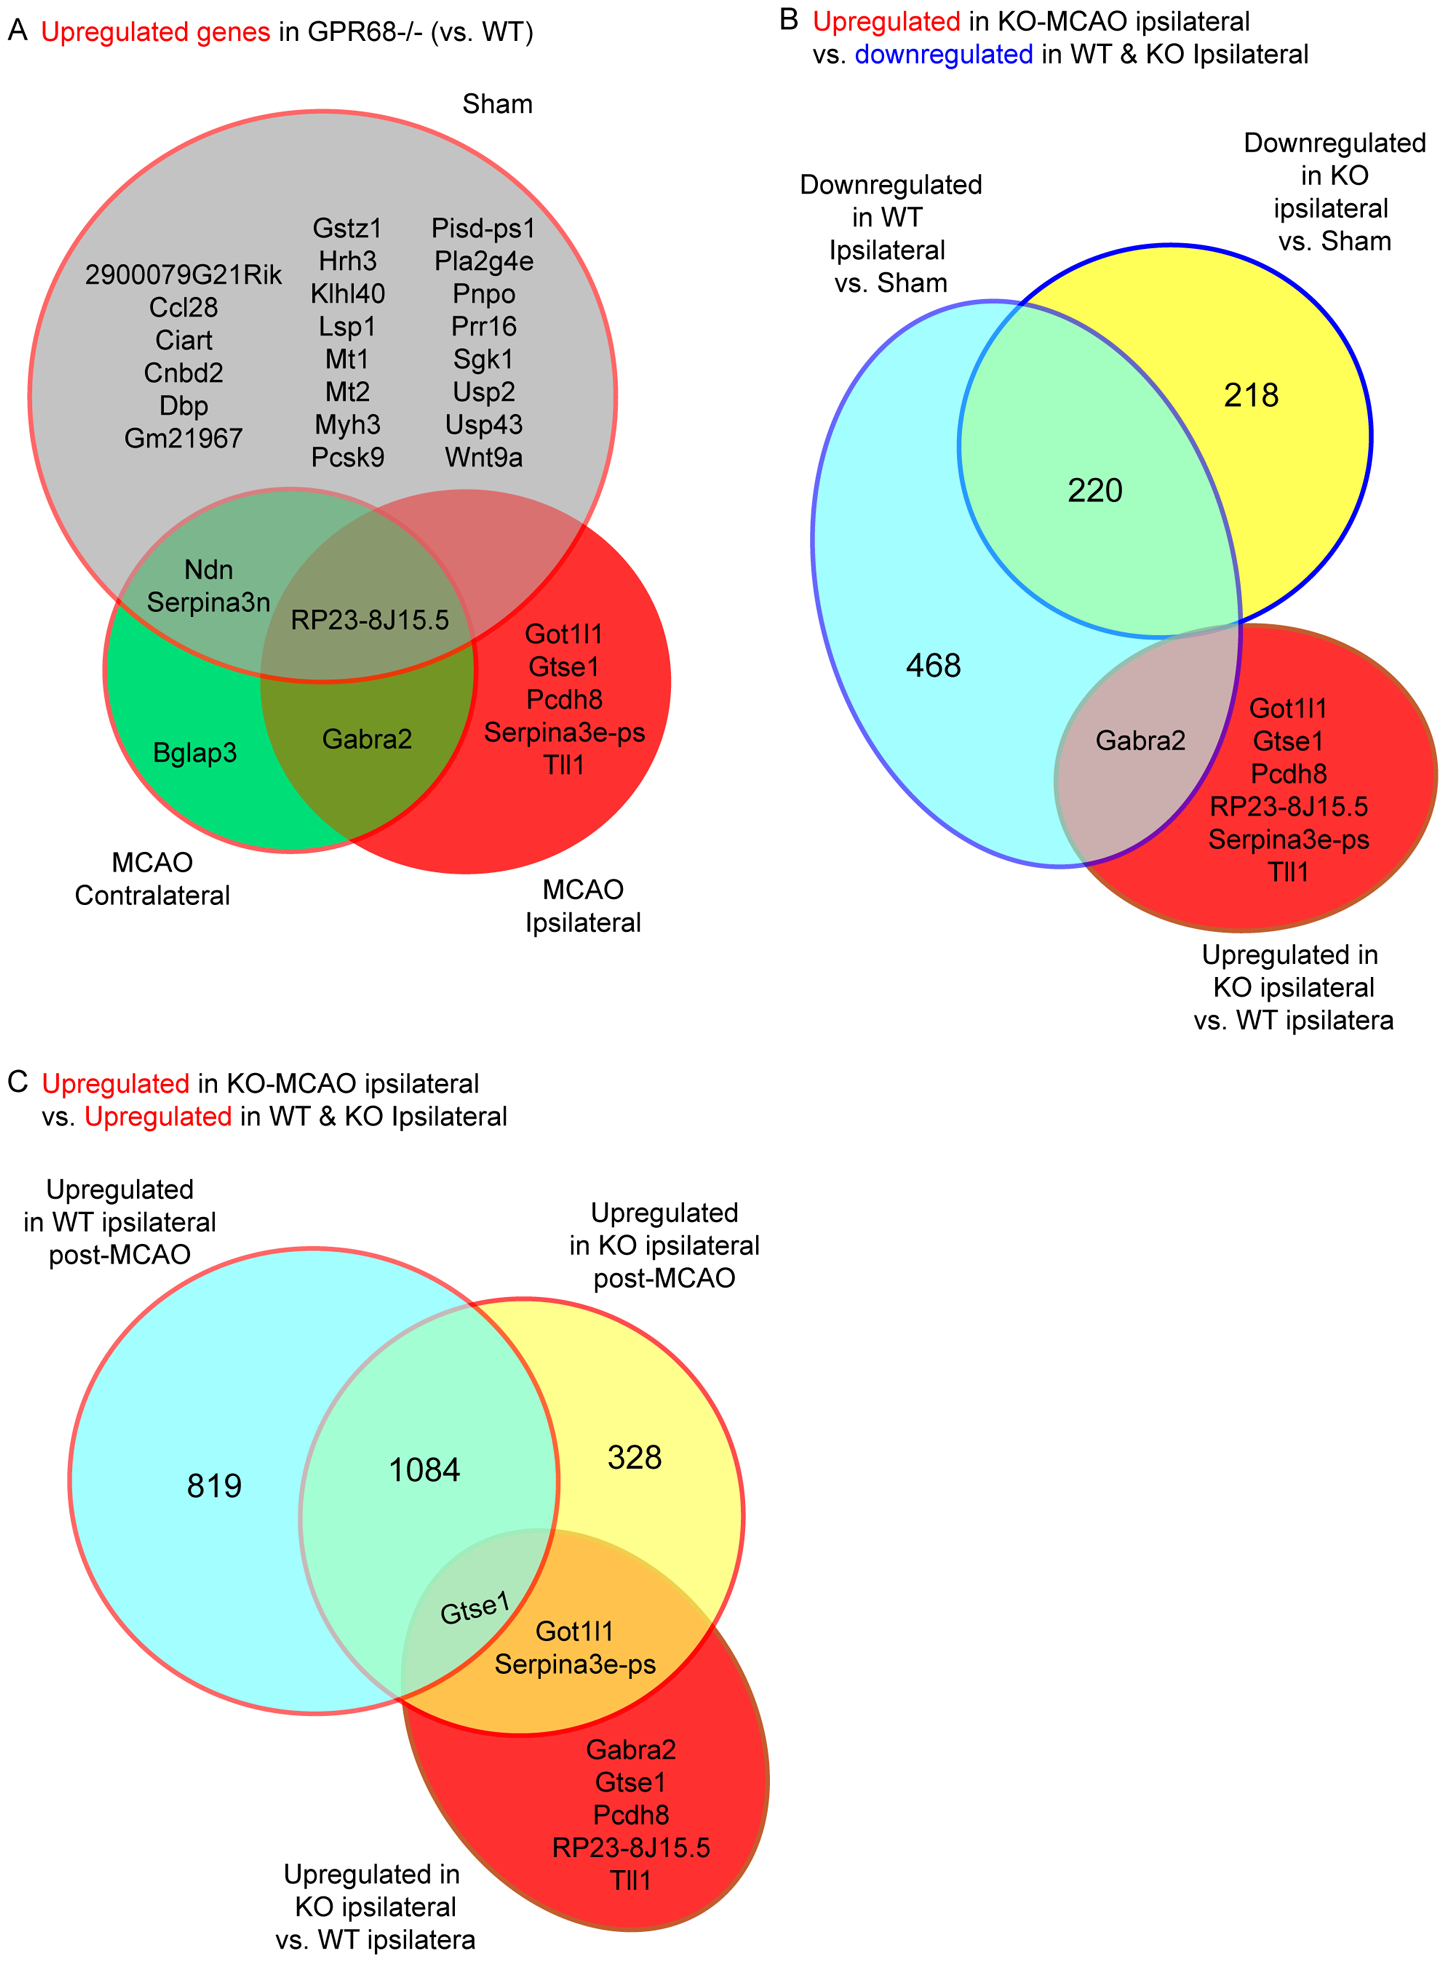
(A) GeneVenn analysis of genes upregulated in the GPR68−/− vs WT comparisons. The two genotypes were first compared within Sham, MCAO ipsilateral, and MCAO contralateral groups. The genes upregulated in KO in each of the three comparisons were further analyzed by a GeneVenn program to identify shared and distinct expression among the groups. (B & C) GeneVenn analysis of 1) genes upregulated in KO from MCAO ipsilateral comparison (i.e., vs. WT MCAO ipsilateral tissue) with 2) those downregulated in (B) or upregulated (C) from the ipsilateral vs sham comparison of the same genotype. Note that the majority of the genes upregulated in the KO ipsilateral vs WT ipsilateral comparison were not present in all other differential comparisons.
Next, we examined genes downregulated in the knockout. When compared against GPR68-dependent downregulated genes in the sham and tMCAO-contralateral group, 9 of the 19 genes downregulated in the KO vs. WT ipsilateral comparison were unique to this group (Figure 5A). If these genes have protective function, we expect that post-MCAO WT brain will exhibit upregulation at the ipsilateral side. Indeed, when we compared with the genes upregulated in WT ipsilateral brain (vs. sham control), 7 of these 9 genes exhibited upregulation in ipsilateral brain of WT but not GPR68−/− animals (Figure 5B). Clustering analysis with these genes showed significant changes in GO-MF in haptoglobin binding, hemoglobin complex, oxygen binding, and antioxidant activities; all involve three genes encoding hemoglobin- hba-a1, hbb-bs, and hbb-bt. (Figure 5C). We examined specifically the RNA-Seq result for the hba and hbb genes. None of the genes exhibited difference between sham controls while all exhibited preferential upregulation in WT MCAO tissue (Figure 5D).
Figure 5. GeneVenn analysis of downregulated genes in GPR68−/−.
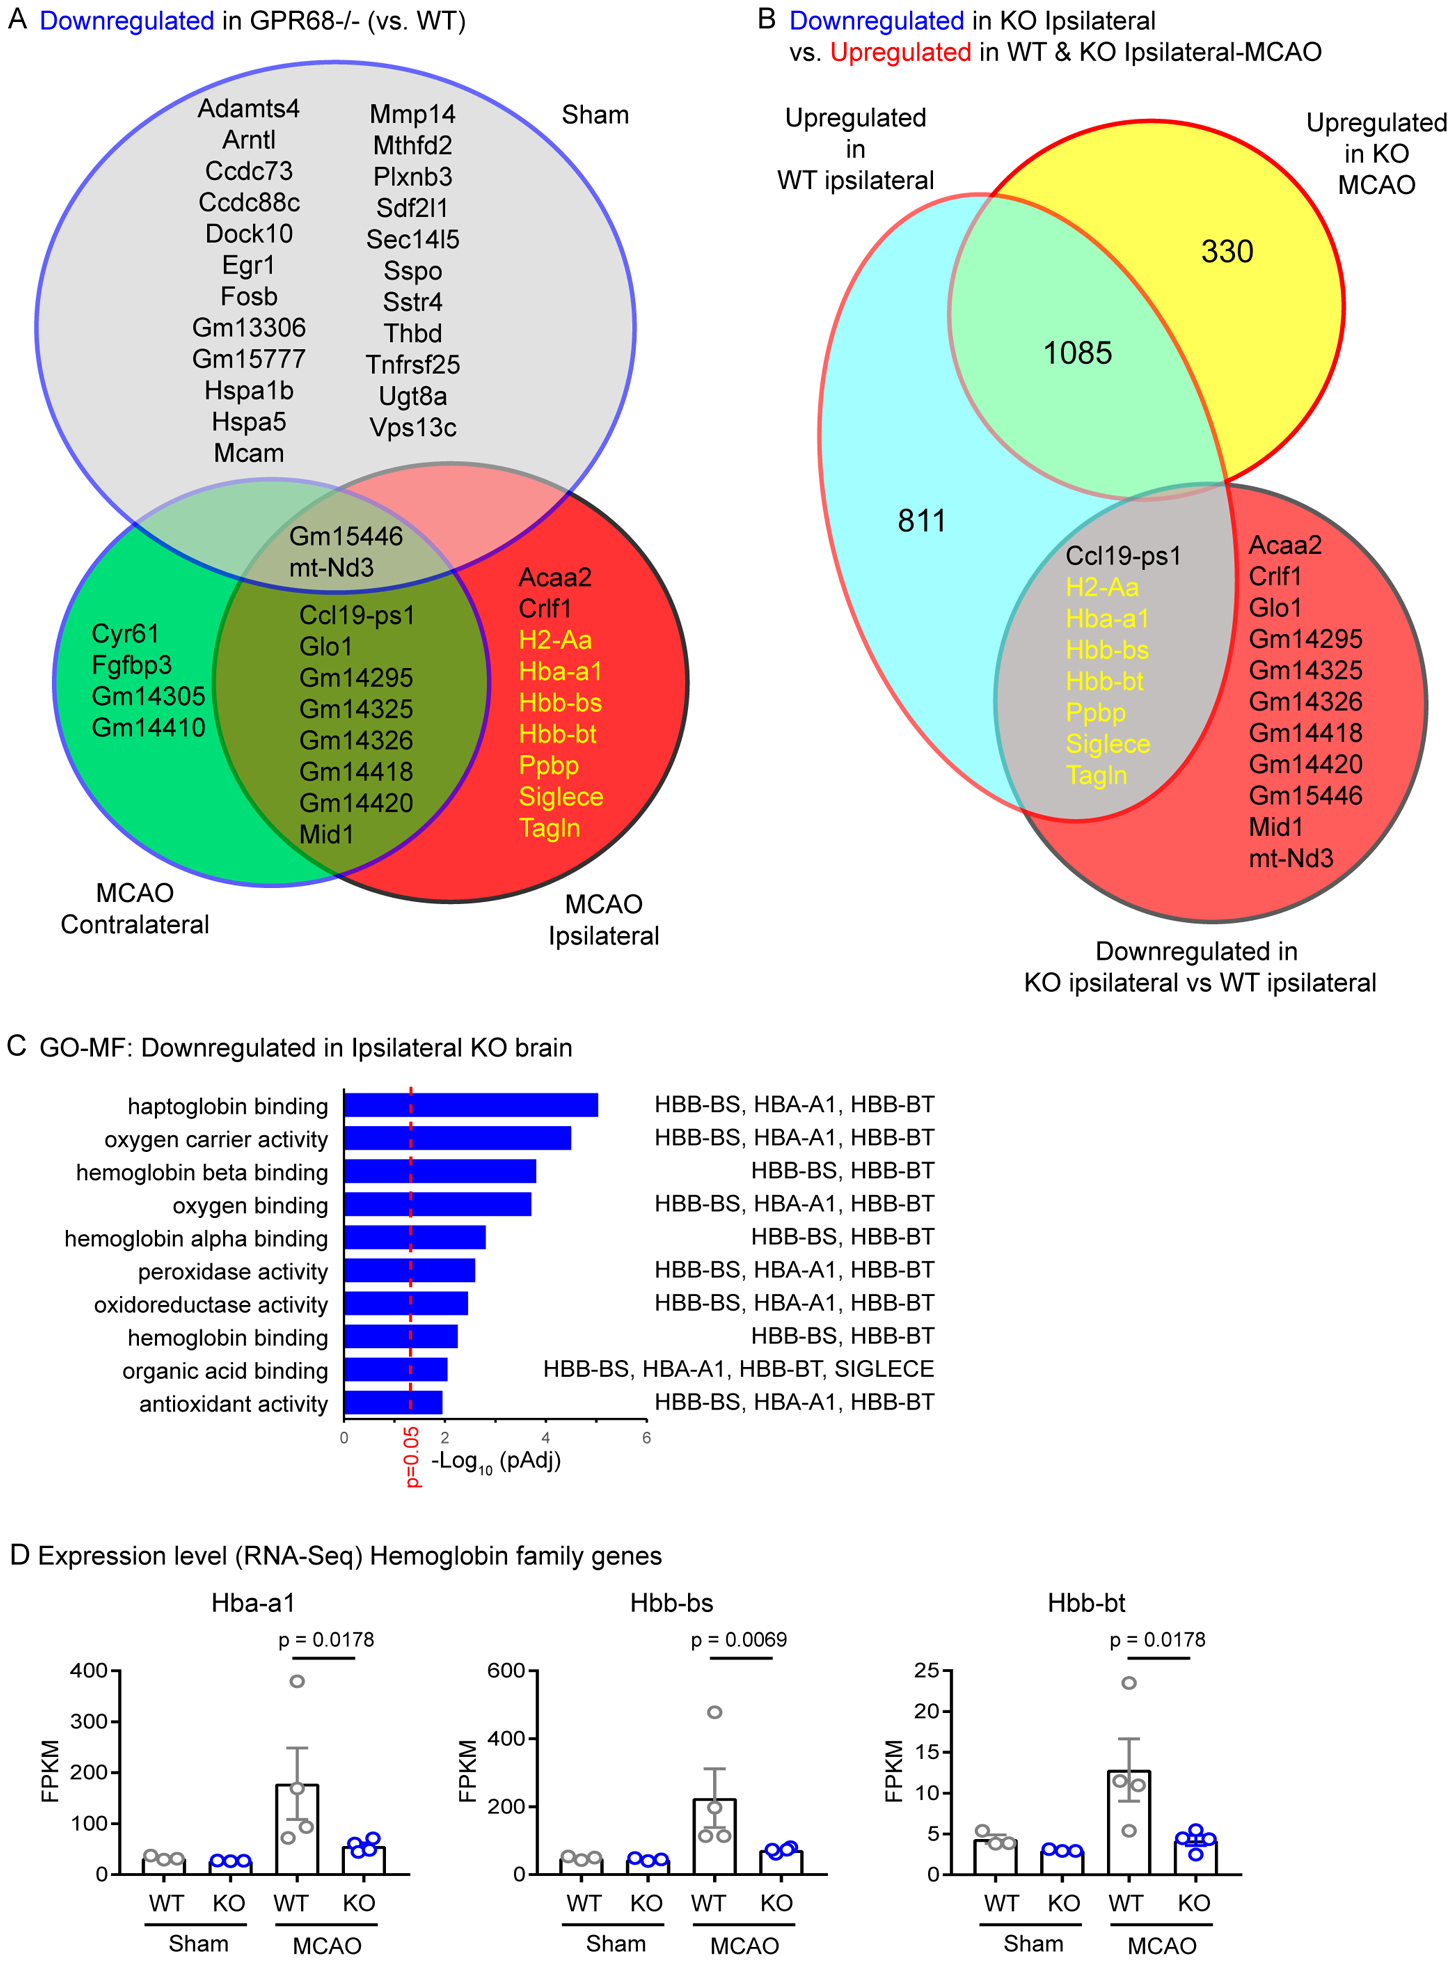
(A) GeneVenn analysis of genes downregulated in the GPR68−/− vs WT comparison in Sham, MCAO ipsilateral, and MCAO contralateral sides. (B) GeneVenn analysis of genes downregulated in ipsilateral side of GPR68−/− vs. WT comparison and those upregulated (B) in the ipsilateral vs sham comparisons of either WT or GPR68−/− brain. Genes in gold font were present only in the KO ipsilateral group in (A) while shared with those upregulated in WT ipsilateral vs sham comparison in (B). These genes fit the expected pattern for GPR68-dependent protective candidates (see Text and Table 2 for more explanation). (C) Summary graph showing significantly changed GO-molecular function of downregulated genes in GPR68−/− vs. WT ipsilateral comparison. (D) RNA-Seq result of hemoglobin family genes. FPKM was used to plot the expression level. P values on graph were Padj values determined in differential expression analysis by DESeq2. Each dot represented one animal.
Ischemia induced neuronal hemoglobin in a GPR68-dependent manner.
In multiple studies, an increase in neuronal hemoglobin or related proteins, including haptoglobin and neuroglobin, provides protection against oxidative stress or ischemia (33–39). Thus, our RNA-Seq result suggests that a GPR68-dependent upregulation of hemoglobin expression serves as one potential mechanism by which GPR68 leads to neuroprotection in ischemia. To further validate the RNA-Seq result, we performed RT-qPCR analysis on post-tMCAO ipsilateral brain. The expression was calibrated to an internal control Hprt using a standard curve method with serial dilutions as described in previous studies (22, 23). Compared to the WT tissue, GPR68−/− tissue exhibited significant reduction of all three hemoglobin genes (Figure 6A). Next, we asked whether MCAO-induced increase in hemoglobin in WT brain was localized to neurons. We performed immunostaining with a hemoglobin antibody in WT post-MCAO brain sections. Contralateral striatal (Figure 6B) or cortical (not shown) exhibited little hemoglobin signal. In contrast, ipsilateral side exhibited increased hemoglobin immunofluorescence, with most of the increase colocalized with NeuN. Lastly, we asked whether the changes in hemoglobin gene expression resulted in changed protein level, and whether the change depends on GPR68. We isolated brain tissue from sham and tMCAO brain, lysed the ipsilateral brain, and perform Western blot analysis using an anti-hemoglobin antibody. tMCAO induced an increase in hemoglobin in WT but had diminished effect in GPR68−/− tissue (Figure 6C).
Expression profile of acid-sensitive channels and receptors.
Global deletion of GPR68 raises a question of whether it alters the expression of other proton receptors. To address this question, we examined the RNA-Seq result of three ASIC genes (Asic1–3) which encode the three functional ASIC subunits, the PAC (TMEM206) gene, and four proton-sensitive GPCRs: Gpr4, −65, −68, and −132. Among all these proton receptors, Asic1 and Asic2 exhibited relatively higher expression, as evidenced by their higher FPKM value (Figure 7A). PAC, Gpr4, and Gpr68 exhibited lower expression while Asic3, Gpr65, and Gpr132 were barely detectable. For all these proton-sensitive channels and GPCRs, the WT and KO mice exhibited similar levels of expression at baseline (Figure 7A). Next, we asked whether their expression level changes in response to ischemia. At 24 hr after tMCAO, we observed a decrease in Asic1 expression and an increase in the expression of Gpr4 and Gpr65 in the ipsilateral brain (Figure 7B). However, there was no genotype difference in expression levels of these receptors in either contralateral or ipsilateral brain tissue.
Figure 7. Expression of proton-sensitive receptors in WT and KO brain.
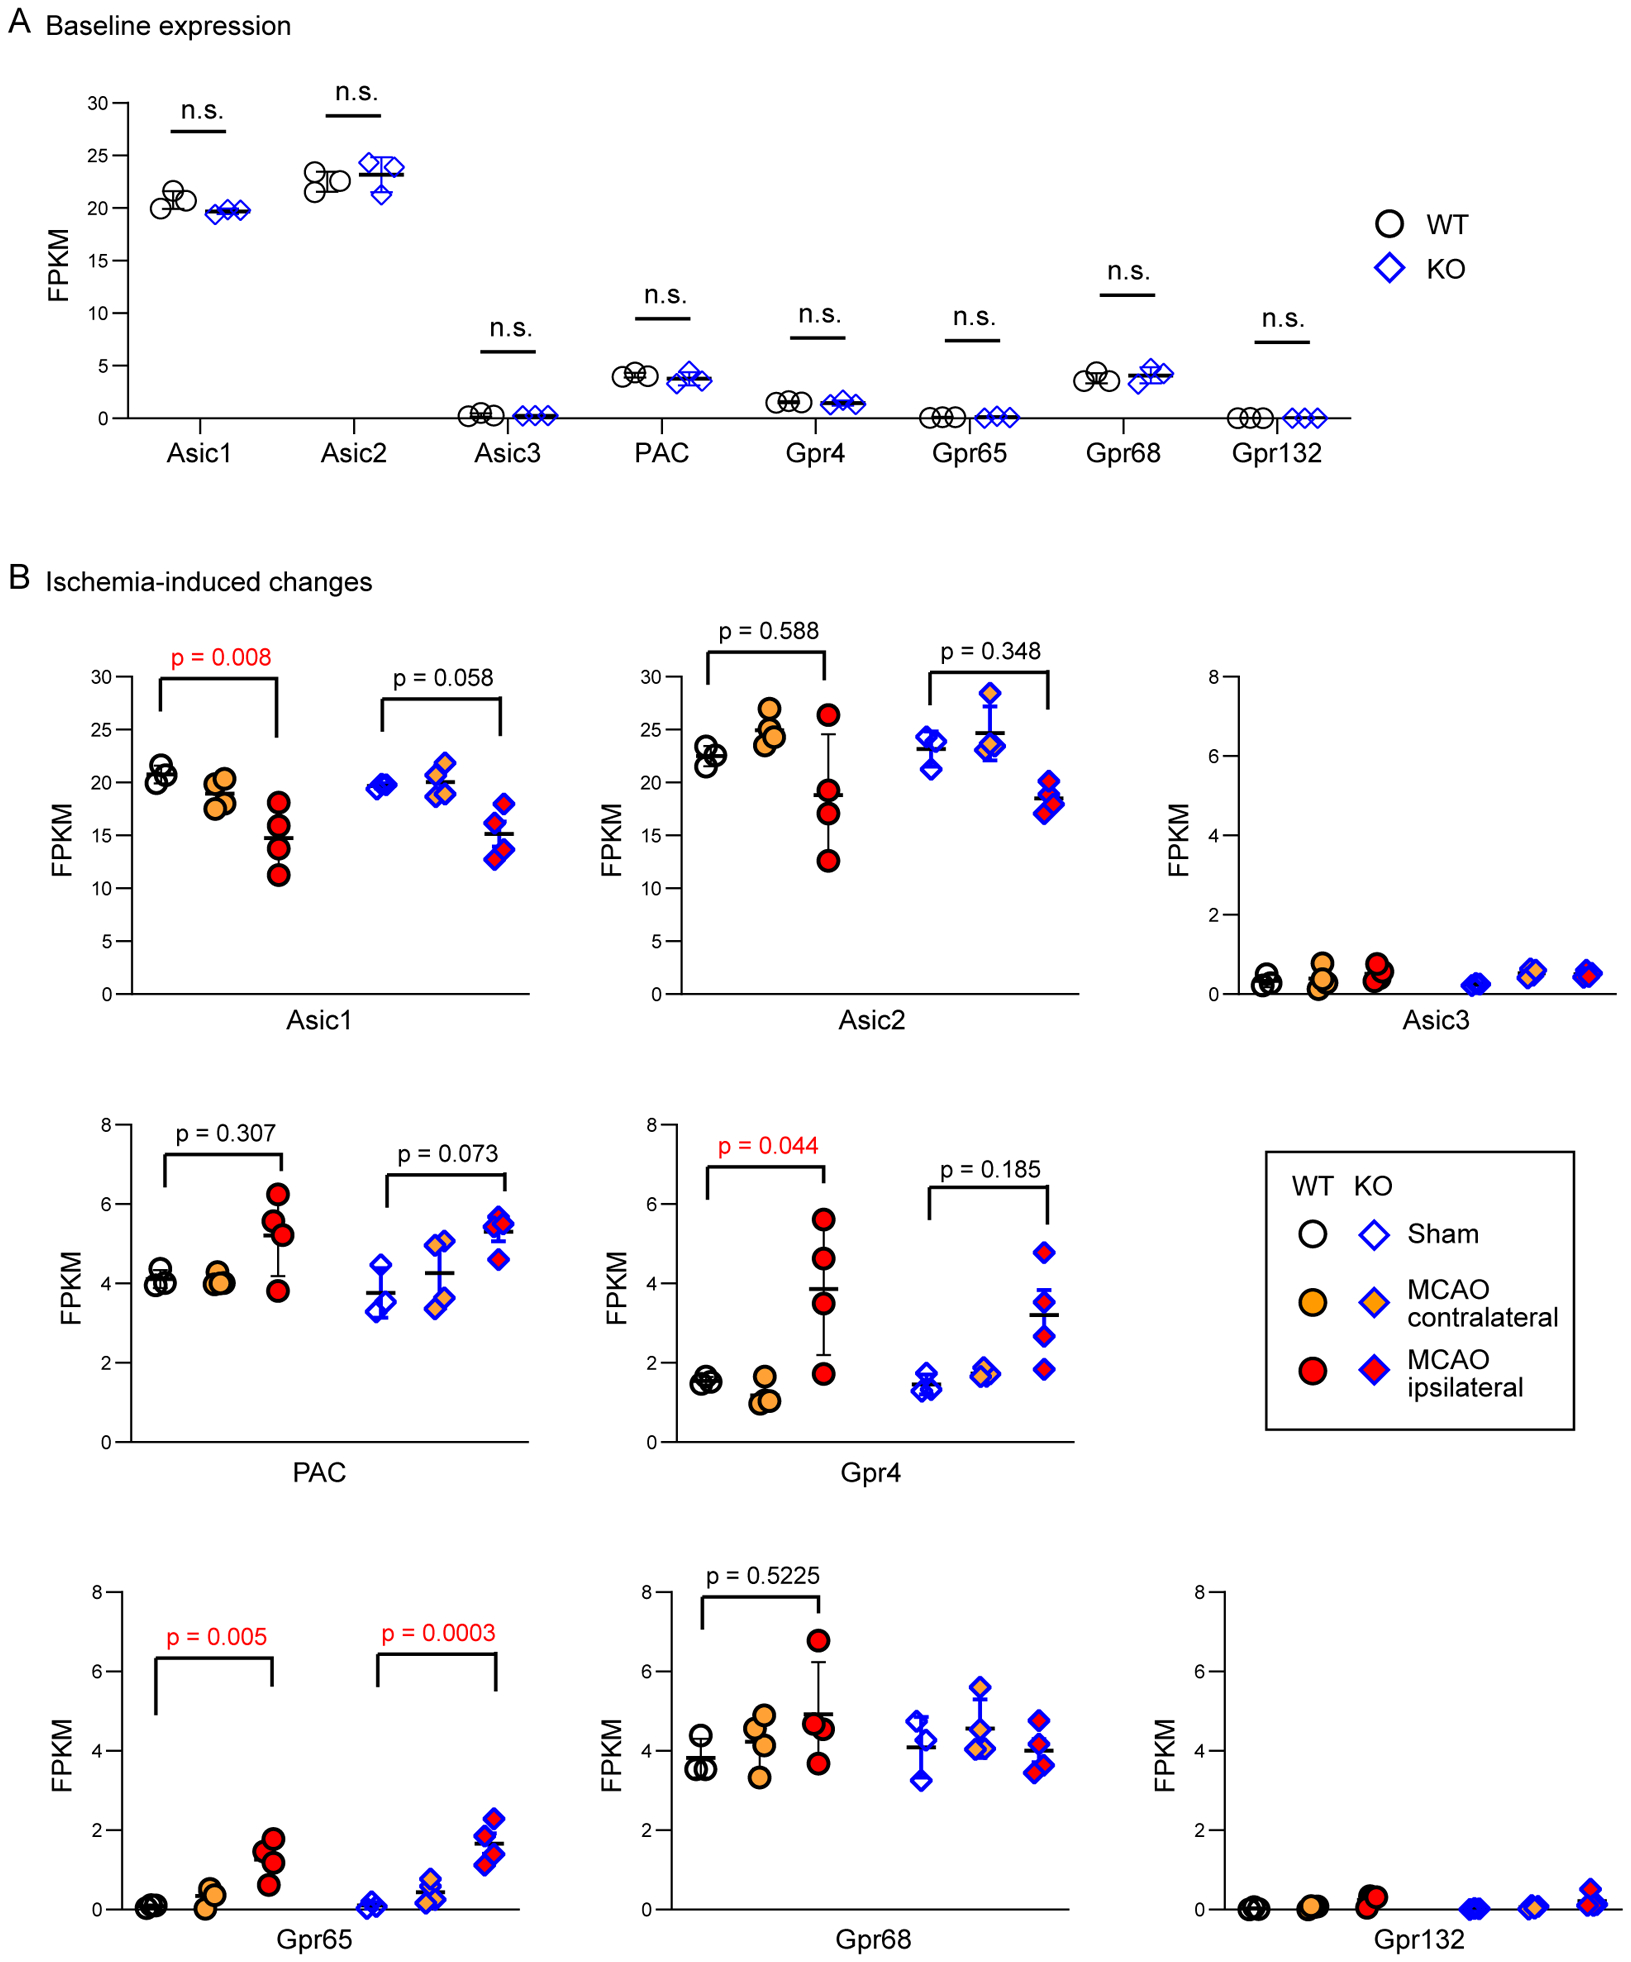
(A) Summary diagram showing the expression level of proton-sensing receptors. The Fragments Per Kilobase of transcript per Million mapped reads (FPKM) values from RNA-Seq were used to determine the relative expression of these receptors. Each dot represents one animal. For all comparisons, there was no significant differences between the two genotypes (Mann-Whitney U test). (B) Ischemia-induced changes. Sham (baseline) values were the same as in (A). p values shown were from One-way ANOVA with Tukey’s post hoc test. All other comparisons not labeled were not significant.
Comparison with published gene profile studies
Multiple studies have examined ischemia-induced changes in rodents, either in whole brain or in a cell-specific manner (24–26, 40–42). To determine whether our ischemic profile change recapitulates key observations reported in previous studies, we compared the differential genes observed here with two studies which examined MCAO-induced changes in mice. The first study used a tMCAO model, though the duration was 30 min (26). Among the 50 genes which exhibited upregulation at multiple time points in the Fury et al. study, 39 were shared with the upregulated gene observed here (Figure 8A, left Venn diagram). GO analysis showed that these genes mainly cluster in protein binding, immune related functions, and responses to cytokine and stress. For the seven consistently downregulated genes, six were shared with the downregulated list in this study (Figure 8A, right Venn diagram). Next, we compared our result with that of a permanent MCAO model (24). In this study, the authors categorize the differentially upregulated genes based on their function. Figure 8B shows the comparison on two categories- both belong to inflammatory responses. Among the 41 upregulated genes in the cytokine/complement and receptor group reported in the previous study, 34 were present in our upregulated gene list. For the second group, which genes of surface antigens, C-type lectin, and major histocompatibility complex (MHC), our list included 44 out of 47 genes reported in the Zhang et al. study. Thus, the comparison with both studies shows that our current analysis captured the key upregulated genes, at least those within immune and/or inflammatory related functions.
Figure 8. Comparison of WT differential expression studies and summary of GPR68-dependent changes.
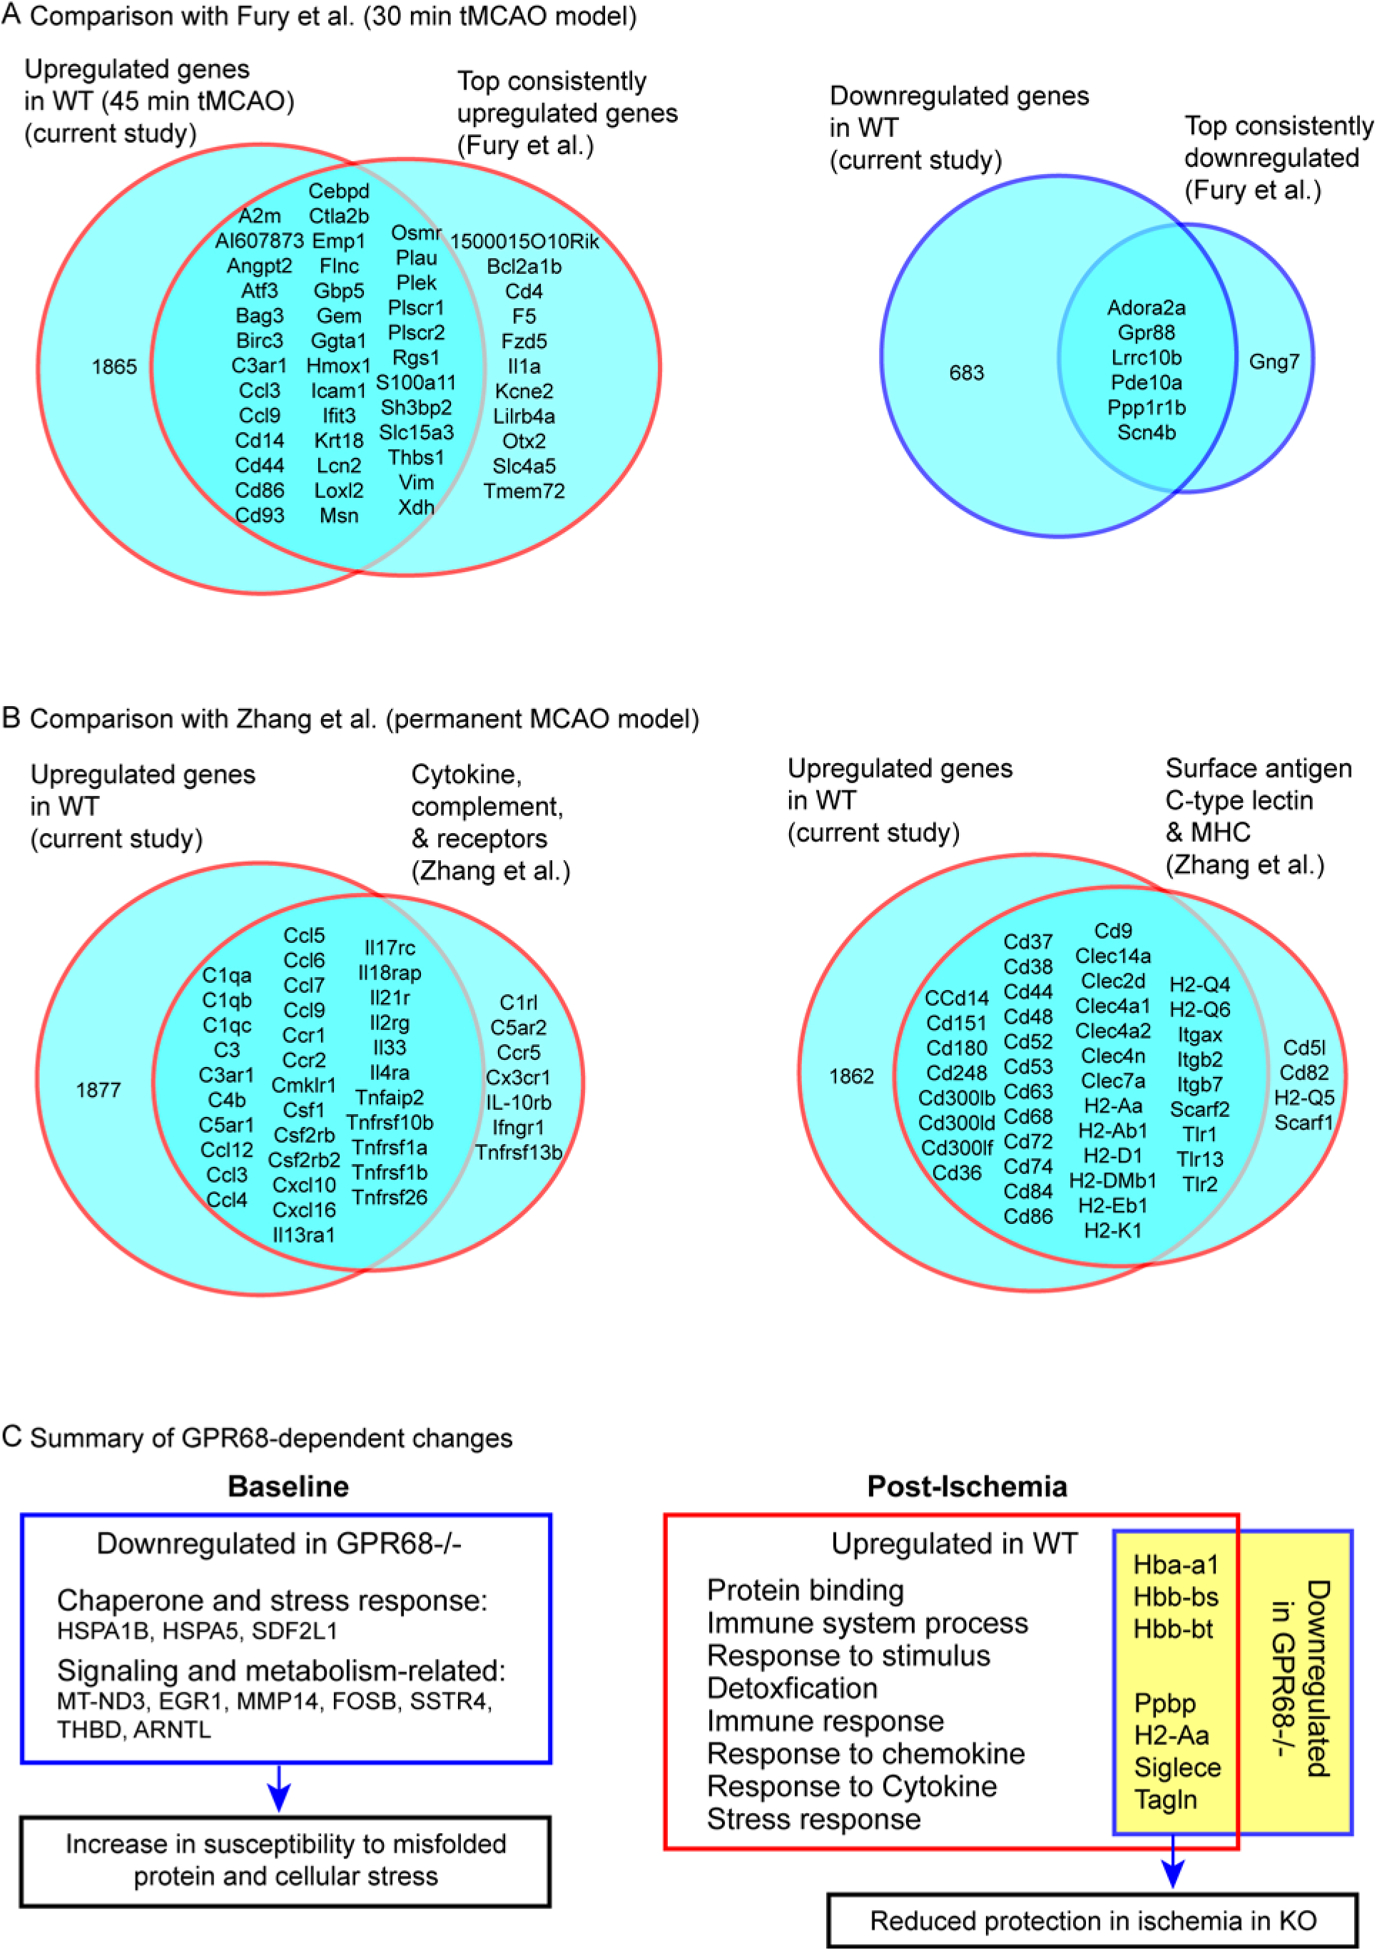
(A & B) Comparison of current study with a 30 min tMCAO model (A) and a permanent MCAO model (B). Venn diagram analyzed the genes changed in post-ischemia WT in our study vs. the differential genes reported in specific categories (as illustrated on the Venn diagram) in the published studies. Note that the majority of previously identified differential genes were observed in the current study. (C) Summary diagram shows the key changes in GPR68−/− mice at baseline and after ischemia. In Post-Ischemia diagram on the right, the functions listed are those upregulated specifically in WT. The genes listed cluster to multiple functions on the left and were downregulated in KO. For details on the link of the genes to the predicted outcome, see Table 2 and text.
DISCUSSION
Brain pH reduction is prevalent in both physiological and disease conditions. Earlier studies on brain acid signaling have primarily focused more on acid-sensing ion channels and calcium signaling (43–46). Besides the ASICs, we and others recently showed that neurons across multiple brain regions express GPR68, a proton-sensitive GPCR (12, 17, 19, 47). GPR68 deletion reduces hippocampal LTP and compromises fear-related behavior in a step-through passive avoidance test (12). In addition, GPR68 deletion worsens acidosis- and ischemia-induced neuronal injury while its overexpression reduces ischemia-induced brain infarct (17, 19). These data demonstrate that GPR68 plays an important part in neuronal response to injuries. In line with these data, our results here provide new insights into how GPR68 alter neuronal responses to stress or injurious stimuli.
To generate insights into ischemia-induced transcriptome changes, several previous studies have performed RNA-Seq analysis in vitro as well as at both acute and chronic phases of focal ischemia in vivo (24, 26, 40, 42). The exact model used in these and current studies differ in experimental details, such as transient vs. permanent occlusion, duration of the tMCAO model, time points analyzed, or animal species (mouse vs. rat). Nevertheless, as shown in Figure 8A & B, our study shared some of the key findings reported in the previous studies (24, 26). In addition, though there were differences in the exact fold change, 9 of the 10 highest expression genes, including Mmp3, Il11, Ccl4, Ccl2, Arg1, Il6, Tfpi2, Ptx3 and Ccl12, at day 1 following a mouse permanent MCAO model (24) were observed in the top 500 genes upregulated in our analysis. GO analysis showed that these genes mainly cluster in cytokine activity, cytokine receptor binding, receptor ligand activity, and signaling receptor activator activity. Another study revealed several top changed differential genes at 24 hr after 90 min tMACO in rat. These genes include eight upregulated genes- Serpina3n, Hspa1a, Hspa1b, Msr1, glycam1, spp1, Lcn2, ptx3, and five downregulated genes- Neu2, Rgs9, adora2a, gpr6, gpr88 (40). All these genes, except Neu2, were present in the top 500 up- and down-regulated genes in our current study. These comparisons suggest that our study is consistent with previous similar transcriptome studies on both gene expression profiles and major changes in gene ontology. Specifically, upregulated genes from most of the studies cluster into functions related to immune response, stress response, or inflammatory pathways.
The comparison between WT and KO provides potential explanations on how GPR68 alter neuronal function and ischemia outcome. Table 2 summarizes the key downregulated genes in KO, at both baseline and following ischemia. At baseline, GPR68 deletion led to a preferential alteration in genes related to misfolded protein binding, response to organic cyclic compounds, and copper detoxification. Three genes downregulated in the misfolding protein binding were HSP1B (HSP27), HSPA5 (GRP78, HSP70), SDF2L1, which play important roles in ER stress and related responses (48, 49). In previous studies, impaired chaperone function associates with increased susceptibility to ischemic injury while overexpression of HSP70 leads to protection (50–53). Thus, downregulation of these proteins in KO is consistent, and may provide one explanation, for the exacerbated ischemic injury in these animals (17, 19). The fitting into Go term “response to organic cyclic compound” implies a general role of GPR68 in cellular states or activities to various stimulations. Eight genes clustered in this function include ND3, EGR1, MMP14, FOSB, HSPA5 (GRP78), SSRT4, TMBD, and ARNTL. All of them contribute to cell metabolism or stress responses (54–63). As summarized in Table 2, all except SSRT4 exhibit direct association or contribution to stroke outcome or cerebrovascular function.
TABLE 2.
GPR68-dependent downregulated genes and their function.
| Category | Gene | Encoded protein | Protection-related function and references | |
|---|---|---|---|---|
| Baseline | Misfolded protein & chaperone | HSPA1B | heat shock 70 kDa protein 1B | Antiapoptotic, neuroprotective in CNS (81). |
| HSPA5 | heat shock protein family A member 5 | Promotes cell survival under conditions of ER stress (82), neuroprotective in ischemic injury (60) | ||
| SDF2L1 | stromal cell-derived factor 2-like protein 1 | Promotes the chaperone activity of ERdj3, inhibits protein aggregation (83). | ||
| Extracellular matrix degradation | MMP14 | matrix metalloproteinase-14 | Protect against oxidant injury (84), cardioprotection (85). | |
| Blood coagulation | THBD | thrombomodulin | Protective in intravascular injury (86). | |
| Signaling | MT-ND3 | NADH dehydrogenase subunit 3 | Cardioprotective (87). | |
| EGR1 | early growth response protein 1 | Important for synaptic plasticity, wound repair, inflammation, and differentiation (88). | ||
| SSTR4 | somatostatin receptor type 4 | Proliferative effect, anxiolytic and antidepressant-like effects, analgesic and anti-inflammatory actions (89). | ||
| FOSB | protein fosB | Promotes stress resilience, antidepressant action (90), neuroprotective (91). | ||
| ARNTL | aryl hydrocarbon receptor nuclear translocator-like protein 1 | Protective in neuronal redox homeostasis and neurodegeneration (92). | ||
| Post-ischemia | hemoglobin | Hba-a1 | hemoglobin alpha chain | Neuroprotective (33, 34, 38, 65, 66). |
| Hbb-bs | hemoglobin beta adult s chain | |||
| Hbb-bt | hemoglobin beta adult t chain | |||
| immunity and structural | Ppbp | platelet basic protein | Antimicrobial activity in tissue damage, injury and infection (67). | |
| H2-Aa | MHC class II antigen alpha chain | Help removing toxic elements from CNS, promote recovery and repair (68). | ||
| Siglece | sialic acid-binding Ig-like lectin 12(Siglec-E) | Neuroprotective in preventing phagocytosis and the associated oxidative burst (69, 70). | ||
| Tagln | transgelin | Protective during myocardial ischemia (71) | ||
The table summarizes the downregulated genes in GPR68−/− at baseline and after ischemia, as compared to WT brain at baseline or WT ipsilateral brain after tMCAO, respectively. The right column summarizes the studies which link the corresponding gene to protection.
In our previous studies, we showed that GPR68 deletion led to larger infarct following 45 min tMCAO (17, 19). In a separate study, Sato et al. reported no difference after 30 min tMCAO (64). We do not know the exact reason for this discrepancy in conclusion. However, the two studies used two different GPR68−/− mice. In addition, the two studies differ in tMCAO duration, suture type (Doccol #702023 in our study vs. #602191 in Sato et al.), and whether cerebral blood flow was used as inclusion/exclusion criteria. Nevertheless, the GPR68-dependent changes in gene expression support a protective role of GPR68 activation. Other than the reduction in chaperone function at baseline as described above, half of the 438 genes downregulated in GPR68−/− is unique to the knockout. For these genes uniquely downregulated in KO, the top GO functions include calmodulin-dependent kinase activities and calmodulin binding (Figure 2E). Several key genes clustered here include CAMK2A and CAMK2B, CAMKIV, ITPKA (Supplemental workbook 1). This result is consistent with the fact that GPR68 primarily couples to Gq and elicits calcium and IP3 signaling. Further, direct comparison with the genes changed in WT ipsilateral brain generated additional information to support and explain the protective mechanism of GPR68. GPR68 deletion led to a downregulation of seven genes following tMCAO, including H2-Aa, Hba-a1, Hbb-bs, Hbb-bt, Ppbp, Siglece, and Tagln. The upregulation of Hba-a1, Hbb-bs and Hbb-bt is consistent with protective of hemoglobin or related protein in cerebral and myocardial ischemia conditions (33, 34, 38, 65, 66). In addition, as detailed in Table 2, all the other four genes- H2-Aa, Ppbp, Siglece, and Tagln- exhibit protective effect in either central nervous system or cardiovascular system (67–71). Since the expression of these genes were decreased in a GPR68-dependent manner, the evidence together suggests the following mechanisms (Figure 8C): 1) GPR68 deletion at baseline, through reducing heat shock proteins, MMP14, THBD, and several genes in cellular response to stimulation, increases the susceptibility of the brain to injurious insults such as ischemia; 2) the downregulation of protective genes following ischemia provides another route for the exacerbated ischemia injury in the KO.
Since the three hemoglobin genes cluster into functions related to oxidative responses, which may explain the neuroprotective effect of GPR68, we further verified this RNA-Seq result using RT-qPCR, Western blot, and immunostaining. In our immunofluorescence analysis, WT brain exhibited an upregulation of hemoglobin in neurons. This ischemia-induced neuronal hemoglobin expression is consistent with previous reports (33, 35). Our western blot result further showed that ischemia-induced expression of neuronal hemoglobin requires GPR68. In previous studies, ischemic preconditioning increased neuronal hemoglobin while Rotenone, which inhibits mitochondrial function, reduced neuronal expression of hemoglobin (33, 72). One important note is that an increase in hemoglobin in neurons has completely different outcome from the release of extracellular hemoglobin from the blood. An increase in extracellular hemoglobin, e.g., from intracerebral hemorrhage, is detrimental to cells (73, 74). In contrast, intracellular hemoglobin most likely serves as a ROS scavenger and is neuroprotective (33). Erythropoietin, a hematopoietic growth factor, upregulates neuronal hemoglobin and protects mitochondrial function (35, 36). Similarly, upregulation of neuroglobin, a close homolog of hemoglobin, protects neurons from hypoxic and ischemic injuries (34, 38). Together, these data support that upregulation of neuronal hemoglobin provides one mechanism to explain GPR68-induced protection in ischemia. One important property of hemoglobin is that the oxygenated and deoxygenated forms of hemoglobin have pKa of ~6.8 and ~7.8, respectively (75–77). Thus, other than functioning as oxygen carrier and oxidant scavenger, hemoglobin itself can sense intracellular pH changes and serve as a good buffering system (76, 78, 79). These data raise intriguing perspectives on what additional roles neuronal hemoglobin may play following tMCAO, which increases both ROS and proton concentration. To better interpret how GPR68 achieves its neuroprotective function, it will be important to establish a causal relationship between GPR68 signaling and neuronal hemoglobin expression, and determine the functional importance of upregulated neuronal hemoglobin following brain ischemia.
Our results thus provide insights regarding GPR68 function in ischemic injury. Though ischemia reduced brain pH, ischemia in vivo is complex and alters multiple aspects of cellular signaling. Thus, the observed gene profile changes in GPR68−/− most likely involve both acid-dependent mechanism as well as additional pathways not directly downstream of pH reduction. Other than neurons, GPR68 is expressed in multiple peripheral tissues as well as upregulated in several types of cancers (80). Thus, our RNA-Seq result will also provide insights into how GPR68 regulates cellular function in general. However, the expression of GPR68 outside of neuron also raised one important consideration regarding developmental compensation in global knockouts. As one effort to address this question, we analyzed the proton-sensitive receptors and found that WT and KO did not differ in expression of ASICs, PAC, and proton-sensitive GPCRs. However, it is possible that developmental compensation contributes to part of the baseline changes in signaling. To unequivocally address this issue, it will be of future interest to use inducible conditional knockout models to determine the acute/direct effect of GPR68 deletion in neurons.
Supplementary Material
ACKNOWLEDGEMENT
We thank Dr. Yan Xu (Indiana University) for sharing the GPR68−/− mice.
FUNDING
The study was supported by NIH/NINDS grant R01NS102495 and an intramural grant #1341 from University of South Alabama College of Medicine (to XMZ). The Nikon A1 microscope was funded by an NIH/ARRA equipment grant #S10RR027535.
NONSTANDARD ABBREVIATIONS
- GO
Gene Ontology
- FPKM
Fragments per kilo base per million mapped reads
- KEGG
Kyoto Encyclopedia of Genes and Genomes
- KO
GPR68−/−
- LTP
long-term potentiation
- MCAO
middle cerebral artery occlusion
- MF
Molecular Function
- OGR1
Ovarian cancer G protein coupled receptor 1
- qPCR
quantitative Polymerase Chain Reaction
- RT
reverse transcription
- WT
wild-type
Footnotes
CONFLICT OF INTEREST STATEMENT
The authors declare no competing interests.
REFERENCES
- 1.Chesler M, and Kaila K (1992) Modulation of pH by neuronal activity. Trends Neurosci 15, 396–402 [DOI] [PubMed] [Google Scholar]
- 2.Highstein SM, Holstein GR, Mann MA, and Rabbitt RD (2014) Evidence that protons act as neurotransmitters at vestibular hair cell-calyx afferent synapses. Proc Natl Acad Sci U S A 111, 5421–5426 [DOI] [PMC free article] [PubMed] [Google Scholar]
- 3.Du J, Reznikov LR, Price MP, Zha XM, Lu Y, Moninger TO, Wemmie JA, and Welsh MJ (2014) Protons are a neurotransmitter that regulates synaptic plasticity in the lateral amygdala. Proc Natl Acad Sci U S A 111, 8961–8966 [DOI] [PMC free article] [PubMed] [Google Scholar]
- 4.Glitsch M (2019) Mechano- and pH-sensing convergence on Ca(2+)-mobilising proteins - A recipe for cancer? Cell Calcium 80, 38–45 [DOI] [PubMed] [Google Scholar]
- 5.Silver IA, and Erecinska M (1992) Ion homeostasis in rat brain in vivo: intra- and extracellular [Ca2+] and [H+] in the hippocampus during recovery from short-term, transient ischemia. J Cereb Blood Flow Metab 12, 759–772 [DOI] [PubMed] [Google Scholar]
- 6.Zha XM (2013) Acid-sensing ion channels: trafficking and synaptic function. Mol Brain 6, 1. [DOI] [PMC free article] [PubMed] [Google Scholar]
- 7.Chesler M (2003) Regulation and modulation of pH in the brain. Physiol Rev 83, 1183–1221 [DOI] [PubMed] [Google Scholar]
- 8.Kumar NN, Velic A, Soliz J, Shi Y, Li K, Wang S, Weaver JL, Sen J, Abbott SB, Lazarenko RM, Ludwig MG, Perez-Reyes E, Mohebbi N, Bettoni C, Gassmann M, Suply T, Seuwen K, Guyenet PG, Wagner CA, and Bayliss DA (2015) PHYSIOLOGY. Regulation of breathing by CO(2) requires the proton-activated receptor GPR4 in retrotrapezoid nucleus neurons. Science 348, 1255–1260 [DOI] [PMC free article] [PubMed] [Google Scholar]
- 9.Pera T, Deshpande DA, Ippolito M, Wang B, Gavrila A, Michael JV, Nayak AP, Tompkins E, Farrell E, Kroeze WK, Roth BL, Panettieri RA Jr., Benovic JL, An SS, Dulin NO, and Penn RB (2017) Biased signaling of the proton-sensing receptor OGR1 by benzodiazepines. FASEB J [DOI] [PMC free article] [PubMed] [Google Scholar]
- 10.Wemmie JA, Chen J, Askwith CC, Hruska-Hageman AM, Price MP, Nolan BC, Yoder PG, Lamani E, Hoshi T, Freeman JH Jr., and Welsh MJ (2002) The acid-activated ion channel ASIC contributes to synaptic plasticity, learning, and memory. Neuron 34, 463–477 [DOI] [PubMed] [Google Scholar]
- 11.Du J, Price MP, Taugher RJ, Grigsby D, Ash JJ, Stark AC, Hossain Saad MZ, Singh K, Mandal J, Wemmie JA, and Welsh MJ (2017) Transient acidosis while retrieving a fear-related memory enhances its lability. Elife 6 [DOI] [PMC free article] [PubMed] [Google Scholar]
- 12.Xu Y, Lin MT, and Zha XM (2020) GPR68 deletion impairs hippocampal long-term potentiation and passive avoidance behavior. Mol Brain 13, 132. [DOI] [PMC free article] [PubMed] [Google Scholar]
- 13.Lam TI, Brennan-Minnella AM, Won SJ, Shen Y, Hefner C, Shi Y, Sun D, and Swanson RA (2013) Intracellular pH reduction prevents excitotoxic and ischemic neuronal death by inhibiting NADPH oxidase. Proc Natl Acad Sci U S A 110, E4362–4368 [DOI] [PMC free article] [PubMed] [Google Scholar]
- 14.Siesjo BK (1982) Lactic acidosis in the brain: occurrence, triggering mechanisms and pathophysiological importance. Ciba Found Symp 87, 77–100 [DOI] [PubMed] [Google Scholar]
- 15.Tombaugh GC, and Sapolsky RM (1993) Evolving concepts about the role of acidosis in ischemic neuropathology. J Neurochem 61, 793–803 [DOI] [PubMed] [Google Scholar]
- 16.Huang Y, Jiang N, Li J, Ji YH, Xiong ZG, and Zha XM (2015) Two aspects of ASIC function: Synaptic plasticity and neuronal injury. Neuropharmacology 94, 42–48 [DOI] [PMC free article] [PubMed] [Google Scholar]
- 17.Wang T, Zhou G, He M, Xu Y, Rusyniak WG, Xu Y, Ji Y, Simon RP, Xiong ZG, and Zha XM (2020) GPR68 Is a Neuroprotective Proton Receptor in Brain Ischemia. Stroke 51, 3690–3700 [DOI] [PMC free article] [PubMed] [Google Scholar]
- 18.Wei WC, Jacobs B, Becker EB, and Glitsch MD (2015) Reciprocal regulation of two G protein-coupled receptors sensing extracellular concentrations of Ca2+ and H. Proc Natl Acad Sci U S A 112, 10738–10743 [DOI] [PMC free article] [PubMed] [Google Scholar]
- 19.Wang T, He M, and Zha X. m. (2020) Time-dependent progression of hemorrhagic transformation after transient ischemia and its association with GPR68-dependent protection. Brain Hemorrhages 1, 185–191 [DOI] [PMC free article] [PubMed] [Google Scholar]
- 20.Li H, Wang D, Singh LS, Berk M, Tan H, Zhao Z, Steinmetz R, Kirmani K, Wei G, and Xu Y (2009) Abnormalities in osteoclastogenesis and decreased tumorigenesis in mice deficient for ovarian cancer G protein-coupled receptor 1. PLoS One 4, e5705. [DOI] [PMC free article] [PubMed] [Google Scholar]
- 21.Jiang N, Wu J, Leng T, Yang T, Zhou Y, Jiang Q, Wang B, Hu Y, Ji YH, Simon RP, Chu XP, Xiong ZG, and Zha XM (2017) Region specific contribution of ASIC2 to acidosis-and ischemia-induced neuronal injury. J Cereb Blood Flow Metab 37, 528–540 [DOI] [PMC free article] [PubMed] [Google Scholar]
- 22.Fischer M, Skowron M, and Berthold F (2005) Reliable transcript quantification by real-time reverse transcriptase-polymerase chain reaction in primary neuroblastoma using normalization to averaged expression levels of the control genes HPRT1 and SDHA. J Mol Diagn 7, 89–96 [DOI] [PMC free article] [PubMed] [Google Scholar]
- 23.Deng X, Custer BS, Busch MP, Bakkour S, and Lee TH (2017) Simultaneous estimation of detection sensitivity and absolute copy number from digital PCR serial dilution. Comput Biol Chem 68, 1–5 [DOI] [PubMed] [Google Scholar]
- 24.Zhang C, Zhu Y, Wang S, Zachory Wei Z, Jiang MQ, Zhang Y, Pan Y, Tao S, Li J, and Wei L (2018) Temporal Gene Expression Profiles after Focal Cerebral Ischemia in Mice. Aging Dis 9, 249–261 [DOI] [PMC free article] [PubMed] [Google Scholar]
- 25.Ting SM, Zhao X, Sun G, Obertas L, Ricote M, and Aronowski J (2020) Brain Cleanup as a Potential Target for Poststroke Recovery: The Role of RXR (Retinoic X Receptor) in Phagocytes. Stroke 51, 958–966 [DOI] [PMC free article] [PubMed] [Google Scholar]
- 26.Fury W, Park KW, Wu Z, Kim E, Woo MS, Bai Y, Macdonald LE, Croll SD, and Cho S (2020) Sustained Increases in Immune Transcripts and Immune Cell Trafficking During the Recovery of Experimental Brain Ischemia. Stroke 51, 2514–2525 [DOI] [PMC free article] [PubMed] [Google Scholar]
- 27.Mortazavi A, Williams BA, McCue K, Schaeffer L, and Wold B (2008) Mapping and quantifying mammalian transcriptomes by RNA-Seq. Nat Methods 5, 621–628 [DOI] [PubMed] [Google Scholar]
- 28.Raudvere U, Kolberg L, Kuzmin I, Arak T, Adler P, Peterson H, and Vilo J (2019) g:Profiler: a web server for functional enrichment analysis and conversions of gene lists (2019 update). Nucleic Acids Res 47, W191–W198 [DOI] [PMC free article] [PubMed] [Google Scholar]
- 29.Pirooznia M, Nagarajan V, and Deng Y (2007) GeneVenn - A web application for comparing gene lists using Venn diagrams. Bioinformation 1, 420–422 [DOI] [PMC free article] [PubMed] [Google Scholar]
- 30.Kopec AM, Rivera PD, Lacagnina MJ, Hanamsagar R, and Bilbo SD (2017) Optimized solubilization of TRIzol-precipitated protein permits Western blotting analysis to maximize data available from brain tissue. J Neurosci Methods 280, 64–76 [DOI] [PMC free article] [PubMed] [Google Scholar]
- 31.Simoes AE, Pereira DM, Amaral JD, Nunes AF, Gomes SE, Rodrigues PM, Lo AC, D’Hooge R, Steer CJ, Thibodeau SN, Borralho PM, and Rodrigues CM (2013) Efficient recovery of proteins from multiple source samples after TRIzol((R)) or TRIzol((R))LS RNA extraction and long-term storage. BMC Genomics 14, 181. [DOI] [PMC free article] [PubMed] [Google Scholar]
- 32.Xu Y, Jiang YQ, Li C, He M, Rusyniak WG, Annamdevula N, Ochoa J, Leavesley SJ, Xu J, Rich TC, Lin MT, and Zha XM (2018) Human ASIC1a mediates stronger acid-induced responses as compared with mouse ASIC1a. FASEB J 32, 3832–3843 [DOI] [PMC free article] [PubMed] [Google Scholar]
- 33.He Y, Hua Y, Liu W, Hu H, Keep RF, and Xi G (2009) Effects of cerebral ischemia on neuronal hemoglobin. J Cereb Blood Flow Metab 29, 596–605 [DOI] [PMC free article] [PubMed] [Google Scholar]
- 34.Khan AA, Wang Y, Sun Y, Mao XO, Xie L, Miles E, Graboski J, Chen S, Ellerby LM, Jin K, and Greenberg DA (2006) Neuroglobin-overexpressing transgenic mice are resistant to cerebral and myocardial ischemia. Proc Natl Acad Sci U S A 103, 17944–17948 [DOI] [PMC free article] [PubMed] [Google Scholar]
- 35.Schelshorn DW, Schneider A, Kuschinsky W, Weber D, Kruger C, Dittgen T, Burgers HF, Sabouri F, Gassler N, Bach A, and Maurer MH (2009) Expression of hemoglobin in rodent neurons. J Cereb Blood Flow Metab 29, 585–595 [DOI] [PubMed] [Google Scholar]
- 36.Singhal NK, Alkhayer K, Shelestak J, Clements R, Freeman E, and McDonough J (2018) Erythropoietin Upregulates Brain Hemoglobin Expression and Supports Neuronal Mitochondrial Activity. Mol Neurobiol 55, 8051–8058 [DOI] [PubMed] [Google Scholar]
- 37.Zhao X, Song S, Sun G, Strong R, Zhang J, Grotta JC, and Aronowski J (2009) Neuroprotective role of haptoglobin after intracerebral hemorrhage. J Neurosci 29, 15819–15827 [DOI] [PMC free article] [PubMed] [Google Scholar]
- 38.Sun Y, Jin K, Peel A, Mao XO, Xie L, and Greenberg DA (2003) Neuroglobin protects the brain from experimental stroke in vivo. Proc Natl Acad Sci U S A 100, 3497–3500 [DOI] [PMC free article] [PubMed] [Google Scholar]
- 39.Amri F, Ghouili I, Tonon MC, Amri M, and Masmoudi-Kouki O (2017) Hemoglobin-Improved Protection in Cultured Cerebral Cortical Astroglial Cells: Inhibition of Oxidative Stress and Caspase Activation. Front Endocrinol (Lausanne) 8, 67. [DOI] [PMC free article] [PubMed] [Google Scholar]
- 40.Dergunova LV, Filippenkov IB, Stavchansky VV, Denisova AE, Yuzhakov VV, Mozerov SA, Gubsky LV, and Limborska SA (2018) Genome-wide transcriptome analysis using RNA-Seq reveals a large number of differentially expressed genes in a transient MCAO rat model. BMC Genomics 19, 655. [DOI] [PMC free article] [PubMed] [Google Scholar]
- 41.Zhang W, Zhao J, Wang R, Jiang M, Ye Q, Smith AD, Chen J, and Shi Y (2019) Macrophages reprogram after ischemic stroke and promote efferocytosis and inflammation resolution in the mouse brain. CNS Neurosci Ther 25, 1329–1342 [DOI] [PMC free article] [PubMed] [Google Scholar]
- 42.Guo S, Tjarnlund-Wolf A, Deng W, Tejima-Mandeville E, Lo LJ, Xing C, Arai K, Ning M, Zhou Y, and Lo EH (2018) Comparative transcriptome of neurons after oxygen-glucose deprivation: Potential differences in neuroprotection versus reperfusion. J Cereb Blood Flow Metab 38, 2236–2250 [DOI] [PMC free article] [PubMed] [Google Scholar]
- 43.Waldmann R, Champigny G, Bassilana F, Heurteaux C, and Lazdunski M (1997) A proton-gated cation channel involved in acid-sensing. Nature 386, 173–177 [DOI] [PubMed] [Google Scholar]
- 44.Immke DC, and McCleskey EW (2001) Lactate enhances the acid-sensing Na+ channel on ischemia-sensing neurons. Nat Neurosci 4, 869–870 [DOI] [PubMed] [Google Scholar]
- 45.Xiong ZG, Zhu XM, Chu XP, Minami M, Hey J, Wei WL, MacDonald JF, Wemmie JA, Price MP, Welsh MJ, and Simon RP (2004) Neuroprotection in ischemia: blocking calcium-permeable acid-sensing ion channels. Cell 118, 687–698 [DOI] [PubMed] [Google Scholar]
- 46.Zha XM, Wemmie JA, Green SH, and Welsh MJ (2006) Acid-sensing ion channel 1a is a postsynaptic proton receptor that affects the density of dendritic spines. Proc Natl Acad Sci U S A 103, 16556–16561 [DOI] [PMC free article] [PubMed] [Google Scholar]
- 47.Wei WC, Bianchi F, Wang YK, Tang MJ, Ye H, and Glitsch MD (2018) Coincidence Detection of Membrane Stretch and Extracellular pH by the Proton-Sensing Receptor OGR1 (GPR68). Curr Biol 28, 3815–3823 e3814 [DOI] [PubMed] [Google Scholar]
- 48.Devis-Jauregui L, Eritja N, Davis ML, Matias-Guiu X, and Llobet-Navas D (2020) Autophagy in the physiological endometrium and cancer. Autophagy, 1–19 [DOI] [PMC free article] [PubMed] [Google Scholar]
- 49.Enogieru AB, Omoruyi SI, Hiss DC, and Ekpo OE (2019) GRP78/BIP/HSPA5 as a Therapeutic Target in Models of Parkinson’s Disease: A Mini Review. Adv Pharmacol Sci 2019, 2706783. [DOI] [PMC free article] [PubMed] [Google Scholar]
- 50.Stetler RA, Gan Y, Zhang W, Liou AK, Gao Y, Cao G, and Chen J (2010) Heat shock proteins: cellular and molecular mechanisms in the central nervous system. Prog Neurobiol 92, 184–211 [DOI] [PMC free article] [PubMed] [Google Scholar]
- 51.Su Y, and Li F (2016) Endoplasmic reticulum stress in brain ischemia. Int J Neurosci 126, 681–691 [DOI] [PubMed] [Google Scholar]
- 52.Ouyang YB, and Giffard RG (2012) ER-Mitochondria Crosstalk during Cerebral Ischemia: Molecular Chaperones and ER-Mitochondrial Calcium Transfer. Int J Cell Biol 2012, 493934. [DOI] [PMC free article] [PubMed] [Google Scholar]
- 53.Rajdev S, Hara K, Kokubo Y, Mestril R, Dillmann W, Weinstein PR, and Sharp FR (2000) Mice overexpressing rat heat shock protein 70 are protected against cerebral infarction. Ann Neurol 47, 782–791 [PubMed] [Google Scholar]
- 54.Kori A, Hori I, Tanaka T, Aoyama K, Ito K, Hattori A, Ban K, Okazaki Y, Murayama K, and Saitoh S (2019) Transition from Leigh syndrome to MELAS syndrome in a patient with heteroplasmic MT-ND3 m.10158T>C. Brain Dev 41, 803–807 [DOI] [PubMed] [Google Scholar]
- 55.Mezuki S, Fukuda K, Matsushita T, Fukushima Y, Matsuo R, Goto YI, Yasukawa T, Uchiumi T, Kang D, Kitazono T, and Ago T (2017) Isolated and repeated stroke-like episodes in a middle-aged man with a mitochondrial ND3 T10158C mutation: a case report. BMC Neurol 17, 217. [DOI] [PMC free article] [PubMed] [Google Scholar]
- 56.Bot PT, Hoefer IE, Sluijter JP, van Vliet P, Smits AM, Lebrin F, Moll F, de Vries JP, Doevendans P, Piek JJ, Pasterkamp G, and Goumans MJ (2009) Increased expression of the transforming growth factor-beta signaling pathway, endoglin, and early growth response-1 in stable plaques. Stroke 40, 439–447 [DOI] [PubMed] [Google Scholar]
- 57.Buga AM, Margaritescu C, Scholz CJ, Radu E, Zelenak C, and Popa-Wagner A (2014) Transcriptomics of post-stroke angiogenesis in the aged brain. Front Aging Neurosci 6, 44. [DOI] [PMC free article] [PubMed] [Google Scholar]
- 58.Secondo A, Petrozziello T, Tedeschi V, Boscia F, Vinciguerra A, Ciccone R, Pannaccione A, Molinaro P, Pignataro G, and Annunziato L (2019) ORAI1/STIM1 Interaction Intervenes in Stroke and in Neuroprotection Induced by Ischemic Preconditioning Through Store-Operated Calcium Entry. Stroke 50, 1240–1249 [DOI] [PubMed] [Google Scholar]
- 59.Clarke J, Langdon KD, and Corbett D (2014) Early poststroke experience differentially alters periinfarct layer II and III cortex. J Cereb Blood Flow Metab 34, 630–637 [DOI] [PMC free article] [PubMed] [Google Scholar]
- 60.Wang P, Zhang N, Liang J, Li J, Han S, and Li J (2015) Micro-RNA-30a regulates ischemia-induced cell death by targeting heat shock protein HSPA5 in primary cultured cortical neurons and mouse brain after stroke. J Neurosci Res 93, 1756–1768 [DOI] [PubMed] [Google Scholar]
- 61.Nakano T, Nakamura Y, Matsuyama K, Irie K, Yasumura M, Hirata Y, Yamasaki M, Misumi K, Yamashita Y, Myose T, Matsuo K, Sano K, Kamimura H, Ishikura H, Egawa T, and Mishima K (2019) Long-Term Treatment with Thrombomodulin Improves Functional Outcomes after Cerebral Ischemia Even if Administration is Delayed. Thromb Haemost 119, 467–478 [DOI] [PubMed] [Google Scholar]
- 62.Anea CB, Zhang M, Stepp DW, Simkins GB, Reed G, Fulton DJ, and Rudic RD (2009) Vascular disease in mice with a dysfunctional circadian clock. Circulation 119, 1510–1517 [DOI] [PMC free article] [PubMed] [Google Scholar]
- 63.Scheich B, Cseko K, Borbely E, Abraham I, Csernus V, Gaszner B, and Helyes Z (2017) Higher susceptibility of somatostatin 4 receptor gene-deleted mice to chronic stress-induced behavioral and neuroendocrine alterations. Neuroscience 346, 320–336 [DOI] [PubMed] [Google Scholar]
- 64.Sato K, Tobo A, Mogi C, Tobo M, Yamane N, Tosaka M, Tomura H, Im DS, and Okajima F (2020) The protective role of proton-sensing TDAG8 in the brain injury in a mouse ischemia reperfusion model. Sci Rep 10, 17193. [DOI] [PMC free article] [PubMed] [Google Scholar]
- 65.He Y, Hua Y, Lee JY, Liu W, Keep RF, Wang MM, and Xi G (2010) Brain alpha- and beta-globin expression after intracerebral hemorrhage. Transl Stroke Res 1, 48–56 [DOI] [PMC free article] [PubMed] [Google Scholar]
- 66.Sun Y, Jin K, Mao XO, Zhu Y, and Greenberg DA (2001) Neuroglobin is up-regulated by and protects neurons from hypoxic-ischemic injury. Proc Natl Acad Sci U S A 98, 15306–15311 [DOI] [PMC free article] [PubMed] [Google Scholar]
- 67.Schaffner A, King CC, Schaer D, and Guiney DG (2004) Induction and antimicrobial activity of platelet basic protein derivatives in human monocytes. J Leukoc Biol 76, 1010–1018 [DOI] [PubMed] [Google Scholar]
- 68.Turrin NP, and Rivest S (2006) Molecular and cellular immune mediators of neuroprotection. Mol Neurobiol 34, 221–242 [DOI] [PubMed] [Google Scholar]
- 69.Claude J, Linnartz-Gerlach B, Kudin AP, Kunz WS, and Neumann H (2013) Microglial CD33-related Siglec-E inhibits neurotoxicity by preventing the phagocytosis-associated oxidative burst. J Neurosci 33, 18270–18276 [DOI] [PMC free article] [PubMed] [Google Scholar]
- 70.Siddiqui SS, Matar R, Merheb M, Hodeify R, Vazhappilly CG, Marton J, Shamsuddin SA, and Al Zouabi H (2019) Siglecs in Brain Function and Neurological Disorders. Cells 8 [DOI] [PMC free article] [PubMed] [Google Scholar]
- 71.Zhong W, Sun B, Gao W, Qin Y, Zhang H, Huai L, Tang Y, Liang Y, He L, Zhang X, Tao H, Chen S, Yang W, Yang L, Liu Y, Liu H, Zhou H, Sun T, and Yang C (2018) Salvianolic acid A targeting the transgelin-actin complex to enhance vasoconstriction. EBioMedicine 37, 246–258 [DOI] [PMC free article] [PubMed] [Google Scholar]
- 72.Richter F, Meurers BH, Zhu C, Medvedeva VP, and Chesselet MF (2009) Neurons express hemoglobin alpha- and beta-chains in rat and human brains. J Comp Neurol 515, 538–547 [DOI] [PMC free article] [PubMed] [Google Scholar]
- 73.Codrich M, Bertuzzi M, Russo R, Francescatto M, Espinoza S, Zentilin L, Giacca M, Cesselli D, Beltrami AP, Ascenzi P, Zucchelli S, Persichetti F, Leanza G, and Gustincich S (2017) Neuronal hemoglobin affects dopaminergic cells’ response to stress. Cell Death Dis 8, e2538. [DOI] [PMC free article] [PubMed] [Google Scholar]
- 74.Wang X, Mori T, Sumii T, and Lo EH (2002) Hemoglobin-induced cytotoxicity in rat cerebral cortical neurons: caspase activation and oxidative stress. Stroke 33, 1882–1888 [DOI] [PubMed] [Google Scholar]
- 75.Kilmartin JV, Breen JJ, Roberts GC, and Ho C (1973) Direct measurement of the pK values of an alkaline Bohr group in human hemoglobin. Proc Natl Acad Sci U S A 70, 1246–1249 [DOI] [PMC free article] [PubMed] [Google Scholar]
- 76.Kosmachevskaya OV, and Topunov AF (2018) Alternate and Additional Functions of Erythrocyte Hemoglobin. Biochemistry (Mosc) 83, 1575–1593 [DOI] [PubMed] [Google Scholar]
- 77.Yonetani T, and Laberge M (2008) Protein dynamics explain the allosteric behaviors of hemoglobin. Biochim Biophys Acta 1784, 1146–1158 [DOI] [PMC free article] [PubMed] [Google Scholar]
- 78.Perutz MF, Fermi G, Luisi B, Shaanan B, and Liddington RC (1987) Stereochemistry of cooperative mechanisms in hemoglobin. Cold Spring Harb Symp Quant Biol 52, 555–565 [DOI] [PubMed] [Google Scholar]
- 79.Reisberg PI, and Olson JS (1980) Kinetic and cooperative mechanisms of ligand binding to hemoglobin. J Biol Chem 255, 4159–4169 [PubMed] [Google Scholar]
- 80.Wiley SZ, Sriram K, Salmeron C, and Insel PA (2019) GPR68: An Emerging Drug Target in Cancer. Int J Mol Sci 20 [DOI] [PMC free article] [PubMed] [Google Scholar]
- 81.Brown IR (2007) Heat shock proteins and protection of the nervous system. Ann N Y Acad Sci 1113, 147–158 [DOI] [PubMed] [Google Scholar]
- 82.Hetz C (2012) The unfolded protein response: controlling cell fate decisions under ER stress and beyond. Nat Rev Mol Cell Biol 13, 89–102 [DOI] [PubMed] [Google Scholar]
- 83.Hanafusa K, Wada I, and Hosokawa N (2019) SDF2-like protein 1 (SDF2L1) regulates the endoplasmic reticulum localization and chaperone activity of ERdj3 protein. J Biol Chem 294, 19335–19348 [DOI] [PMC free article] [PubMed] [Google Scholar]
- 84.Alcazar O, Cousins SW, and Marin-Castano ME (2007) MMP-14 and TIMP-2 overexpression protects against hydroquinone-induced oxidant injury in RPE: implications for extracellular matrix turnover. Invest Ophthalmol Vis Sci 48, 5662–5670 [DOI] [PubMed] [Google Scholar]
- 85.Kang P, Wang J, Fang D, Fang T, Yu Y, Zhang W, Shen L, Li Z, Wang H, Ye H, and Gao Q (2020) Activation of ALDH2 attenuates high glucose induced rat cardiomyocyte fibrosis and necroptosis. Free Radic Biol Med 146, 198–210 [DOI] [PubMed] [Google Scholar]
- 86.Watanabe-Kusunoki K, Nakazawa D, Ishizu A, and Atsumi T (2020) Thrombomodulin as a Physiological Modulator of Intravascular Injury. Front Immunol 11, 575890. [DOI] [PMC free article] [PubMed] [Google Scholar]
- 87.Chouchani ET, Methner C, Nadtochiy SM, Logan A, Pell VR, Ding S, James AM, Cocheme HM, Reinhold J, Lilley KS, Partridge L, Fearnley IM, Robinson AJ, Hartley RC, Smith RA, Krieg T, Brookes PS, and Murphy MP (2013) Cardioprotection by S-nitrosation of a cysteine switch on mitochondrial complex I. Nat Med 19, 753–759 [DOI] [PMC free article] [PubMed] [Google Scholar]
- 88.Duclot F, and Kabbaj M (2017) The Role of Early Growth Response 1 (EGR1) in Brain Plasticity and Neuropsychiatric Disorders. Front Behav Neurosci 11, 35. [DOI] [PMC free article] [PubMed] [Google Scholar]
- 89.Rajput PS (2012) Characterization of somatostatin receptor in rat/mice brain : implication in Huntington’s disease. [Google Scholar]
- 90.Nestler EJ (2015) FosB: a transcriptional regulator of stress and antidepressant responses. Eur J Pharmacol 753, 66–72 [DOI] [PMC free article] [PubMed] [Google Scholar]
- 91.Patterson JR, Kim EJ, Goudreau JL, and Lookingland KJ (2016) FosB and DeltaFosB expression in brain regions containing differentially susceptible dopamine neurons following acute neurotoxicant exposure. Brain Res 1649, 53–66 [DOI] [PMC free article] [PubMed] [Google Scholar]
- 92.Musiek ES, Lim MM, Yang G, Bauer AQ, Qi L, Lee Y, Roh JH, Ortiz-Gonzalez X, Dearborn JT, Culver JP, Herzog ED, Hogenesch JB, Wozniak DF, Dikranian K, Giasson BI, Weaver DR, Holtzman DM, and Fitzgerald GA (2013) Circadian clock proteins regulate neuronal redox homeostasis and neurodegeneration. J Clin Invest 123, 5389–5400 [DOI] [PMC free article] [PubMed] [Google Scholar]
Associated Data
This section collects any data citations, data availability statements, or supplementary materials included in this article.
Supplementary Materials
Data Availability Statement
All data supporting the findings of this study are available within the paper and its supplementary information files. Additional inquires can be directed to the corresponding author.