Abstract
Optical technologies for label-free detection are an attractive solution for monitoring molecular binding kinetics; however, these techniques measure the changes in the refractive index, making it difficult to distinguish surface binding from a change in the refractive index of the analyte solution in the proximity of the sensor surface. The solution refractive index changes, due to solvents, temperature changes, or pH variations, can create an unwanted background signal known as the bulk effect. Technologies such as biolayer interferometry and surface plasmon resonance offer no bulk-effect compensation, or they alternatively offer a reference channel to correct in postprocessing. Here, we present a virtually bulk-effect-free method, without a reference channel or any computational correction, for measuring kinetic binding using the interferometric reflectance imaging sensor (IRIS), an optical label-free biomolecular interaction analysis tool. Dynamic spectral illumination engineering, through tailored LED contributions, is combined with the IRIS technology to minimize the bulk effect, with the potential to enable kinetic measurements of a broader range of analytes. We demonstrate that the deviation in the reflectivity signal is reduced to ∼8 × 10⁻⁶ for a solution change from phosphate-buffered saline (PBS) (n = 1.335) to 1% dimethyl sulfoxide (DMSO) in PBS (n = 1.336). As a proof of concept, we applied the method to a biotin–streptavidin interaction, where biotin (MW = 244.3 Da) was dissolved at a final concentration of 1 μM in a 1% solution of DMSO in PBS and flowed over immobilized streptavidin. Clear binding results were obtained without a reference channel or any computational correction.
Introduction
Label-free optical biosensors are an attractive solution for biomolecular analysis, offering highly sensitive, multiplexed, and real-time affinity measurements. However, in optical sensing, the signal is dependent on the optical refractive index change caused by the presence of the molecule and scales with the size of the molecule; therefore, low-signal and high-signal noise can make it difficult to characterize the binding of small-molecular-weight targets. Small molecules, organic molecules with a molecular weight of less than 1 kDa, and measurements of their affinity are of growing interest to the diagnostic and pharmaceutical industries.1,2 Amino acids, nucleotides, sugars, and many therapeutics fall into the category of small molecules; therefore, sensitive small-molecule affinity measurements are crucial to drug and diagnostic development.3 The major technical challenge limiting optical label-free kinetic measurements and small-molecule detection is the bulk effect. Differences in composition or temperature and, therefore, refractive index of the analyte solution generate a background signal, referred to as the bulk effect that can make it difficult to discriminate surface binding.4 If the bulk effect can be eliminated, kinetic measurements could be performed in any index solution, increasing the ease and flexibility of experimentation and allowing for accurate small-molecule measurements. Dimethyl sulfoxide (DMSO) is often added to solutions to increase the solubility of DNA or other molecules and is a typical contributor to the bulk effect.5 Commonly, 1–3% DMSO is used to ensure the solubility of small organic compounds.6 Adding a small amount of DMSO, which has a refractive index of 1.479, results in a solution refractive index change from 1.335 for 1× phosphate-buffered saline (PBS) to 1.336 for a 1% solution of DMSO in 1× PBS at room temperature. The refractive indices of some commonly used solutions can be found in Table 1 measured with a Rudolph Research J257 automatic refractometer.
Table 1. Refractive Indices of Commonly Used Solutions.
| solution | refractive index |
|---|---|
| H2O | 1.333 |
| PBS | 1.335 |
| 1% DMSO | 1.336 |
| 5% DMSO | 1.341 |
Surface plasmon resonance (SPR) is one of the most used label-free detection techniques due to its high sensitivity, flexibility, and widespread commercial availability. In its simplest form, transverse magnetic polarized light undergoes total internal reflection at a glass/gold film interface, which under certain resonance conditions excites surface plasmon waves. This resonant coupling results in an evanescent surface wave that extends into the solution, allowing for sensing minute changes in the local refractive index.7 However, changes in the refractive index can be caused both due to molecular binding or to bulk changes in solution since SPR measures the refractive index with the full penetration depth of the evanescent wave, as illustrated in Figure 1a. In a simplistic view for a penetration depth of 150 nm (the effective penetration depth of the industry leader Biacore), a 1 nm molecular adsorption is easily lost to the background signal caused by a small change in the refractive index of the remaining 149 nm of solution within the penetration depth.8 As an example, a 1% solution of DMSO corresponds to a signal difference of about 1200 RU6.
Figure 1.
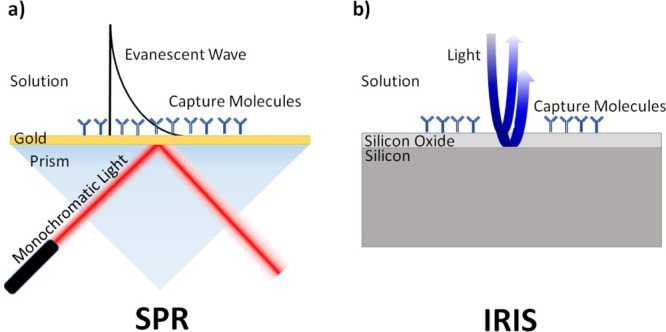
(a) Configuration of SPR, which measures the refractive index changes with an evanescent wave extending into the solution. (b) Configuration of IRIS, which images through the solution and measures the film thickness on the surface.
To compensate for the bulk effect in SPR, a number of laborious steps are taken. Precise care is taken to match the refractive index properties of samples and running buffer as closely as possible. Then, SPR instruments correct for the bulk effect using a reference channel where a solution intended to be identical to the analyte solution is run, often over an inactive ligand intending to mimic the ligand density of the active channel.6,9 This referencing technique requires high precision in matching the properties of the reference channel to the active channel, increasing the difficulty of the experiment and the possibility for error.9 When the reference channel is not sufficient, a calibration for solvent correction is performed by injecting blank samples containing a range of DMSO concentrations and then subtracting the reference response from the active surface response for each concentration. This calibration is then applied to sample measurements to correct for solvent effects. In addition to this, SPR sensors incorporate a matrix of carboxymethylated dextran to the gold surface, which is a carbohydrate polymer that adds about 100 nm thickness and provides a three-dimensional (multilayer) probe functionalization on the surface.9 This polymer fills a large amount of the penetration depth and increases the effective surface area with which the capture molecule can bind. However, diffusion of the target molecule through the carboxymethylated dextran layer can limit the binding kinetics, and the inhomogeneous distribution of the carboxymethylated dextran layer can introduce other effects (pH and charge distribution) that can interfere with binding.10 Since the bulk effect in SPR-based molecular sensors arises due to the underlying physical principles of evanescent waves, it is a fundamental limitation of the technique itself.
IRIS (Interferometric Reflectance Imaging Sensor), which offers a sensitivity comparable to SPR and better than SPR imaging,11 is not based on evanescent fields and does not suffer from this limitation. While other technologies collect the signal and background together in each measurement, IRIS produces spectral reflectivity information that allows for extracting surface binding and the solution refractive index as separate quantities. To detect changes in biomass, the IRIS technique uses common-path interferometry where incident light is reflected from a layered sensor surface as seen in Figure 1b, and the fields from each layer interfere to produce a signal. Accumulation of biomass on the top surface changes the optical path length and, therefore, the measured interference signal. Performing this measurement across multiple wavelengths creates a spectral signature that changes uniquely with surface biomass accumulation and solution index of refraction, and these two sources of reflectivity change can be distinguished. Recently, we have made significant advancements in data analysis and reduced the computational cost by 4 orders of magnitude using a look-up-table (LUT) method. Initial images across four different LED illumination wavelengths are acquired and fitted to a reflectance curve to generate a LUT to convert intensity into biomass.12 Single-color illumination images are captured for the duration of the experiment, and the measurements are converted to biomass using the generated LUT. While this method offers very significant improvements in speed and computational cost, the drawback for these single-wavelength measurements is that the bulk effect can no longer be completely separated from surface binding.
In this article, we introduce an innovation for bulk-effect elimination, utilizing the same simple low-cost IRIS instrumentation but with a novel implementation. Here, we perform dynamic spectral illumination engineering for the IRIS technique that allows for virtual elimination of the bulk effect in biomolecular interaction analysis.
Results and Discussion
Bulk-Effect-Free Method
The IRIS instrument provides critical illumination for a dual-layer substrate, and the reflected light is captured and imaged on a CMOS camera, FLIR GS3-U3-51S5MC, as shown in Figure 2. The technique has been extensively previously described.13 Briefly, the substrate consists of a thermally grown SiO2 layer atop a silicon chip, creating a common path interferometer from reflections at each interface. The reflectance spectrum R of the thin film calculated from the Fresnel equations is as follows
| 1 |
| 2 |
| 3 |
| 4 |
where r12 represents the media/SiO2 interface reflection coefficient and r23 represents the SiO2/Si interface reflection coefficient, n is the refractive index of the material, and d is the SiO2 film thickness. The intensity I(d) measured at the CMOS camera is then dependent on this wavelength-dependent reflectance R(d, λ), the electric field amplitude of the incident LED source |Eled|, and the detector quantum efficiency QE(λ).12
| 5 |
Figure 2.
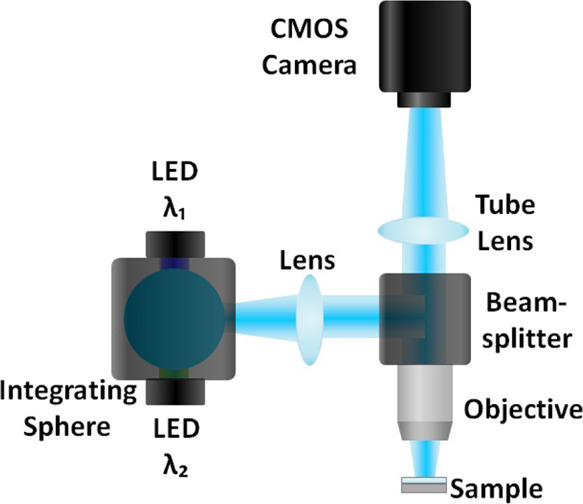
IRIS setup: critical illumination setup with multiple simultaneous wavelength sources incorporated using an integrating sphere. The light reflected off the substrate is imaged with a tube lens and a CMOS camera.
For each thickness of oxide, there exists a wavelength where the index of refraction changes in the solution have no effect on the observed reflectance, referred to here as the bulk-effect-free wavelength. Figure 3 shows the reflectance versus wavelength for an IRIS substrate of 119 nm for various solutions with indices of refraction from 1.333 to 1.433, revealing this bulk-effect-free wavelength. The idealistic solution for illuminating a silicon chip with 119 nm of oxide would be a 473 nm source. The bulk-effect-free wavelength, however, changes with film thickness; thus, to continuously operate at the bulk-effect-free wavelength, we would require a tunable light source and/or precise fabrication, both of which are costly additions. IRIS chips are cut from silicon wafers with a thin film of oxide thermally grown with a tolerance of 5%. When fabricating silicon wafers with 113 nm oxide, the oxide thickness can vary from 107 to 119 nm. Tight fabrication tolerances are required to reliably ensure 113 nm every time, requiring extra steps such as polishing, which greatly increase both the time and cost. Additionally, surface functionalization, as well as large immobilized molecules, will add a variable thickness to the chip, making it difficult to engineer the chip for the precise thickness needed. Because of this, these are not practical solutions and a more flexible and low-cost solution is required.
Figure 3.
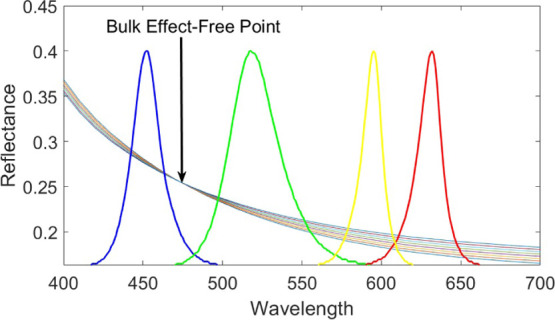
Reflectance from a 119 nm thick IRIS substrate in solutions with indices of refraction from 1.333 to 1.433. The bulk-effect-free point lies at a wavelength between the blue and green LED sources (473 nm).
The instrument has incorporated four independent LEDs with peak wavelengths at 456, 518, 598, and 635 nm for illumination of the sample. When illuminating with the blue LED (456 nm), the reflectance decreases with an increased solution index of refraction, and when illuminating with the green LED (518 nm), the reflectance increases with an increased solution index of refraction from a nominal refractive index of 1.333, seen in Figure 4b. Both of these illumination sources result in an increase in reflectance with biomass accumulation, as shown in Figure 4a. By illuminating with two different wavelength sources simultaneously, an increase in intensity due to the bulk effect at one wavelength can be compensated for by a decrease in intensity due to the bulk effect at another, while still having the ability to measure biomass accumulation. Since there is no phase relationship between the individual LEDs, the intensity measured by the camera when illuminating with two LEDs is the sum of the contributions from each. The resulting equation for I(d) is below
| 6 |
Figure 4.
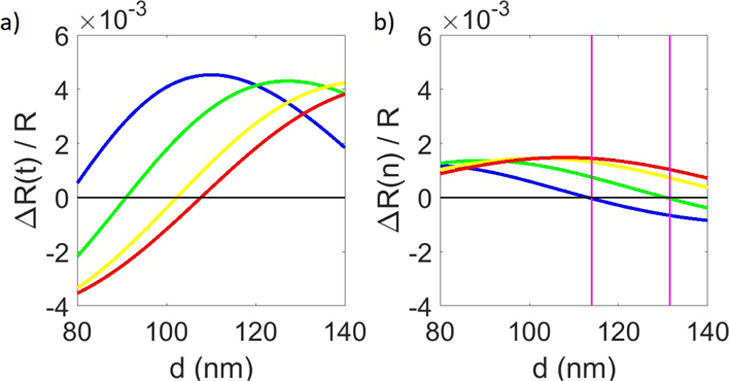
(a) Calculated change in reflectance due to biomass accumulation of 1 nm (t), (b) calculated change in reflectance due to a change in the refraction index (n) of the solution of 0.01, normalized by total reflectance as a function of SiO2 film thickness for each of the IRIS system’s four LEDs, with the blue curve pertaining to the 456 nm LED, the green curve to the 518 nm LED, the yellow curve to the 598 nm, and the red curves to the 635 nm LED. The thickness window where the proposed method for bulk-effect elimination is possible is marked with magenta lines.
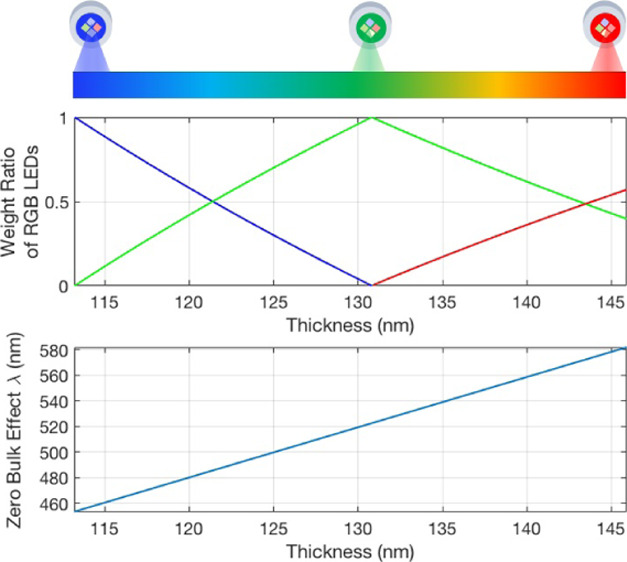
The values A and B are used to adjust the contribution from each LED, allowing for correct bulk-effect compensation at any film thickness. These illumination sources can be combined effortlessly in their chosen amounts using the integrating sphere of the IRIS setup, implemented in Figure 2, to create the desired spectral profile while maintaining color-independent illumination uniformity, for producing bulk-effect-free results. Performing this addition on the optical bench rather than computationally provides a simpler and faster solution. Note that there is no computational step or a reference measurement. By mixing the two colors at a prescribed weight ratio, the direct reflectivity measurement on a monochrome sensor (CMOS camera) yields virtual elimination of the bulk effect.
Theoretical Results
Theoretical results were produced in MATLAB using eq 6. Figure 5a shows the calculated signal change due to refractive index changes in the bulk solution when only blue LED illumination is used. The improvement when illumination engineering is used for bulk-effect minimization is shown in Figure 5b. Values for the intensity ratio of the blue and green LED contributions (A and B in eq 6) were found to minimize the bulk effect at various oxide thicknesses. The determined ratios of blue (456 nm) to green (518 nm) were found to be 1:0 for 113 nm substrate thickness, 0.88:0.12 for 115 nm, 0.76:0.24 for 117 nm, and 0.63:0.37 for 119 nm. Undesirable changes in signal were limited to <0.0003% of the signal for refraction indices from 1.33 to 1.34. A 0.0003% signal change corresponds to ∼0.8 pg/mm2, which is below the noise floor of the typical implementation of the IRIS system and would, therefore, be undetectable during experimentation.11 A bulk-effect-free wavelength exists for substrate thicknesses from 113 to 130 nm, which is marked by the vertical magenta lines in Figure 4b.
Figure 5.
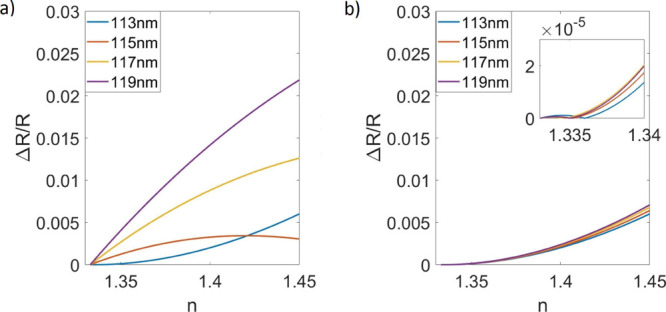
(a) Response due to changes in the refraction index without illumination engineering (b) response due to the refraction index changes using two-color custom illumination with the following blue to green ratios: 113 nm—1:0, 115 nm—0.89:0.11, 117 nm—0.77:0.23, and 119 nm—0.66:0.34. The inset shows a zoomed view of these data, showing refractive indices from 1.335 to 1.34.
Experimental Results
Proof of Concept Experiment: Biotin–Streptavidin
Experimental verification of this bulk-effect-minimization method was performed using the biotin–streptavidin binding interaction. The biotin–streptavidin interaction is one of the strongest natural noncovalent interactions, making it a good candidate for an experiment where reliable binding is necessary. The biotin–streptavidin complex is bound by multiple hydrogen bonds that act cooperatively, resulting in a binding energy greater than the sum of the individual hydrogen bonds.14 Additionally, biotin is a small molecule with a molecular weight of only 244.3 Da; therefore, using biotin for this proof of concept experiment serves as a demonstration of bulk-effect minimization for small-molecule sensitivity.
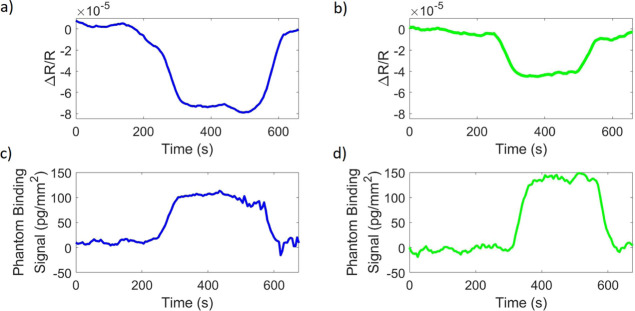
Streptavidin molecules were deposited at a spotting concentration of 18 μM on IRIS chips. Bovine serum albumin was spotted as a negative control at a spotting concentration of 15 μM. An image of one of the chips used can be seen in Figure S1 in Supporting Information. A 420 nm LED (Thorlabs M420L2) was used to illuminate the IRIS chip while 1× PBS (refractive index = 1.335) was flowed over the surface for 5 min, followed by 1% DMSO in 1× PBS (refractive index = 1.336) for 5 min and followed again by 1× PBS for 5 min. The same was repeated with a 530 nm LED (Thorlabs M530L3). The reflectance signal measured in these trials can be seen in Figure 6a,b. Figure 6c,d shows the biomass density that would correspond to these signal levels. This conversion of signal to biomass is performed by capturing images across four LED wavelengths (here, 420, 530, 595, and 632 nm) as described in Sevenler and Selim Ünlü.12 The obtained reflectance spectrum is then used to determine the film thickness and subsequently the biomass.15 This phantom binding signal created from a change in the index of refraction of the bulk solution can create the illusion of binding when none is present and impede the quantitative ability of IRIS.
Figure 6.
Signal generated from a change in the refractive index from 1.335 to 1.336 when illuminated with (a) a 420 nm LED and (b) a 530 nm LED. The signal converted to mass density values for (c) 420 nm illumination and (d) 530 nm illumination.
Biotin–Streptavidin-Binding Experiment with the Bulk Effect
Next, a biotin–streptavidin-binding experiment was performed under single-color, 420 nm illumination to show the bulk effect when no bulk-effect-minimization method is implemented. Biotin was flowed across the streptavidin spots at 1 μM concentration for 10 min, at a flow rate of 200 μL/min. Temporal and spatial averaging were implemented to minimize system noise;11 averaging 100 frames and 60 spots, each spot ∼270 μm in diameter. The resulting signal is shown in Figure 7. Figure 7a shows the differential signal of the control spot (the average pixel value of the spot area minus the average value of the pixels surrounding the spot) and shows a decrease in intensity when the analyte solution is introduced, resulting in an inaccurately high-binding signal as seen in Figure 7b. By taking the differential signal, potential environmental sources of artifacts affecting the sensor are eliminated. The time point when the analyte solution is introduced is marked by the red line in these figures. The black horizontal line corresponds to the binding signal for biotin obtained with the described bulk-effect-minimization method, consistent with theoretically expected values in Chiodi, et al.11 The refractive index difference between the analyte and buffer solution used in this study created a bulk-effect signal that is about 2 times the size of the biotin-binding signal measured here with the IRIS technique. The same refractive index difference in SPR (as simulated using a Kretcshmann configuration) would result in a bulk-effect signal that is 30 times as large as the same biotin-binding signal measured in SPR. With IRIS, binding is still observable with the bulk effect present; however, it hinders the quantitative nature of the technology.
Figure 7.
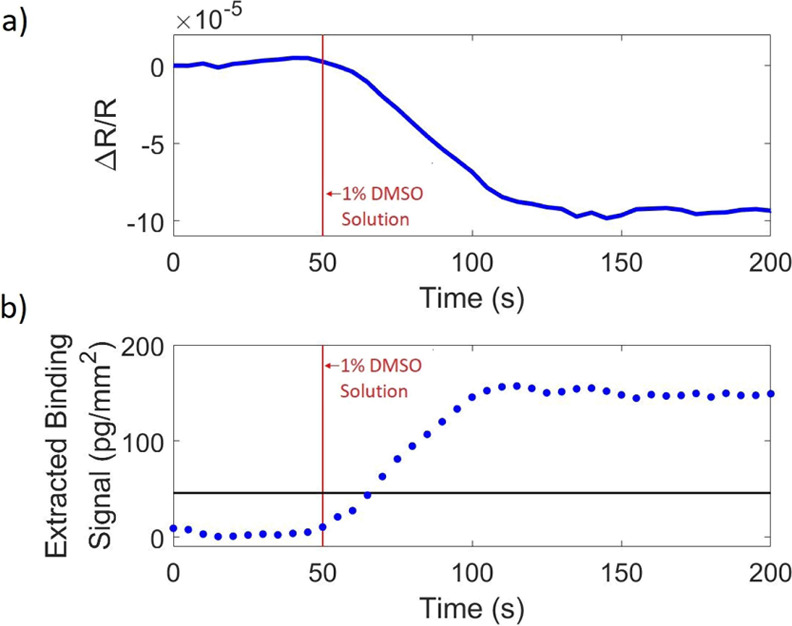
Binding experiment of 1 μM biotin binding to immobilized streptavidin without the use of the described bulk-effect-elimination method. (a) Reflectance signal of the negative control spot minus the background around the spot, normalized by the mean reflectance and (b) binding signal of the biotin to the streptavidin spot without any illumination engineering for bulk-effect elimination.
Biotin–Streptavidin-Binding Experiment with Bulk-Effect Minimization
The experiment was then repeated with bulk-effect-minimization illumination. The power of the LEDs was adjusted using adjustable LED drivers (Thorlabs LEDD1B) based on the bulk-effect signal captured in Figure 6, and the bulk-effect minimization was confirmed with another run of 1× PBS, 1% DMSO in 1× PBS, and 1× PBS. The resulting signal is shown in Figure 8b showing a clear binding step as expected of biotin and confirmed in similar studies,11 and results were consistent across many trials of this experiment. Due to the high affinity of biotin to streptavidin, the binding interaction is mass-transport-limited (further discussed in Supporting Information) and, therefore, the data serve only as a proof of concept and do not show actual kinetic information.
Figure 8.
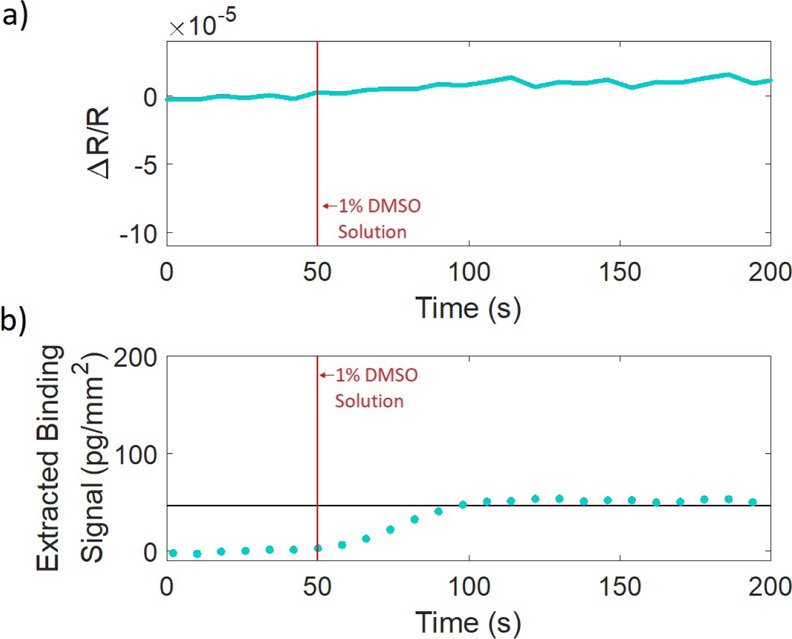
Binding experiment of 1 μM biotin binding to immobilized streptavidin with the use of the described bulk-effect-elimination method. (a) Reflectance signal of the negative control spot minus the background around the spot, normalized by the mean reflectance and (b) binding signal when illuminated at the bulk-effect-free point.
The differential reflectance signal of the control spot, normalized to zero, is shown in Figure 8a showing no observable signal change due to the bulk effect, confirming the bulk-effect-free operation. The differential control spot signal has a maximum reflectance change of 0.000774%, improved from 0.0225%, when no bulk-effect-elimination method was utilized (Figure 7a). It can also be seen that the biotin-binding signal measured under blue (420 nm) illumination with the included bulk effect (Figure 7b) is about equal to the sum of the signal resulting from the bulk solution under blue illumination with no binding (Figure 6c) and the biotin-binding signal when the bulk-effect-free-illumination method was applied (Figure 8b), further supporting the successful achievement of bulk-effect-free operation.
To verify that the dual illumination did not affect the trend of the binding curve measured, the same biotin–streptavidin-binding experiment was performed with 1% DMSO in 1× PBS as both the buffer and sample media, so that there would be no refractive index difference between solutions. Since there is no refractive index change between the buffer and sample solution, there is no resulting bulk effect, and one color (420 nm blue illumination) was used for the experiment. The experiment produced a binding curve for biotin–streptavidin binding that matches the curve measured with dual illumination, confirming that dual illumination is not affecting the observed behavior. These data can be seen in Figure S3 in Supporting Information.
Conclusions
A bulk-effect-free method for binding kinetic measurements was demonstrated, without a reference channel or computational post-processing, and applied to the small-molecule binding interaction of biotin–streptavidin in a 1% DMSO solution. The success of the developed method demonstrates the potential for accurate kinetic measurements in various compositions of bulk solution. Further optimization and automation of this method with an increase in the flexibility and simplicity of these kinetic measurements enable the highly sensitive characterization of small molecules in diverse solutions.
Experimental Section
Chip Functionalization and Preparation
Streptavidin was printed on the chip surface in a microarray modality with the M2 iTWO-300P high-precision microarray-dispensing instrument (Berlin, Germany). Prior to spotting, the surface of the chips is functionalized with an N,N-dimethylacrylamide-based polymer, commercially known as MCP-2 (Lucidant Polymers, LLC, Sunnyvale, CA, USA).16 The chips are activated with oxygen plasma for 10 min and then immersed in the aqueous polymer solution (1% w/v polymer in 20% saturated ammonium sulfate) for 30 min. Following this, the chips are rinsed with DI water and dried gently with a nitrogen stream before drying in a vacuum oven at 80 °C for 15 min. The chips are then spotted and left in the spotter at 70% humidity overnight. Finally, the chips are blocked with a 50 mM ethanolamine solution in 100 mM Tris–HCl (pH = 9) before starting the experiment.
Materials
All buffers and reagents were purchased from Sigma-Aldrich (St. Louis, MO, USA). Biotin was dissolved in DMSO at a concentration of 100 mM and then diluted in PBS at 1 mM. This solution was subsequently diluted to a final concentration of 1 μM in a 1% solution of DMSO in PBS.
Acknowledgments
This work was partially funded by the Boston University Ignition Program and by the National Science Foundation (NSF iCorps award no. 2027109 and NSF-TT PFI award no. 1941195) of which M.S.Ü. is the principal investigator. He is also the founder of the startup iRiS Kinetics, Inc., which is working toward the commercialization of the IRIS technique. We also acknowledge Celalettin Yurdakul for insightful scientific discussions.
Supporting Information Available
The Supporting Information is available free of charge at https://pubs.acs.org/doi/10.1021/acsomega.0c05994.
Image of the IRIS chip; photograph of the IRIS system; binding curve with no bulk difference between buffer and analyte solutions; reflectivity response from dual-color illumination; theoretical and experimental biotin–streptavidin-binding curves at different concentrations of biotin solution; and evolution of IRIS measurements (PDF)
The authors declare the following competing financial interest(s): M. Selim Unlu is the founder the startup iRiS Kinetics, Inc., which is working towards the commercialization of the IRIS technique.
Supplementary Material
References
- Schuetz D. A.; de Witte W. E. A.; Wong Y. C.; Knasmueller B.; Richter L.; Kokh D. B.; Sadiq S. K.; Bosma R.; Nederpelt I.; Heitman L. H.; et al. Kinetics for Drug Discovery: an industry-driven effort to target drug residence time. Drug Discovery Today 2017, 22, 896–911. 10.1016/j.drudis.2017.02.002. [DOI] [PubMed] [Google Scholar]
- Piehler J.; Brecht A.; Gauglitz G. Affinity Detection of Low Molecular Weight Analytes. Anal. Chem. 1996, 68, 139–143. 10.1021/ac9504878. [DOI] [PubMed] [Google Scholar]
- Peltomaa R.; Glahn-Martínez B.; Benito-Peña E.; Moreno-Bondi M. Optical Biosensors for Label-Free Detection of Small Molecules. Sensors 2018, 18, 4126. 10.3390/s18124126. [DOI] [PMC free article] [PubMed] [Google Scholar]
- Grassi J. H.; Georgiadis R. M. Temperature-Dependent Refractive Index Determination from Critical Angle Measurements Implications for Quantitative SPR Sensing. Anal. Chem. 1999, 71, 4392–4396. 10.1021/ac990125q. [DOI] [PubMed] [Google Scholar]
- Manjunath P.; Shivaprakash B. Pharmacology and Clinical Use of Dimethyl Sulfoxide (DMSO): A Review. Int. J. Mol. Vet. Res. 2013, 3, 23–33. 10.5376/ijmvr.2013.03.0006. [DOI] [Google Scholar]
- GE Healthcare Bio-Sciences . Biacore Assay Handbook; GE Healthcare Bio-Sciences AB: Bjorkgatan; Uppsala, Sweden, 2012; Vol. 30, 751 84. [Google Scholar]
- Nguyen H.; Park J.; Kang S.; Kim M. Surface plasmon resonance: a versatile technique for biosensor applications. Sensors 2015, 15, 10481–10510. 10.3390/s150510481. [DOI] [PMC free article] [PubMed] [Google Scholar]
- Karlsson R. Biosensor binding data and its applicability to the determination of active concentration. Biophys. Rev. 2016, 8, 347–358. 10.1007/s12551-016-0219-5. [DOI] [PMC free article] [PubMed] [Google Scholar]
- Nikolovska-Coleska Z.Protein-Protein Interactions: Methods and Applications; Meyerkord C. L., Fu H., Eds.; Springer: New York, NY, 2015; pp 109–138. [DOI] [PubMed] [Google Scholar]
- Zhao H.; Gorshkova I. I.; Fu G. L.; Schuck P. A comparison of binding surfaces for SPR biosensing using an antibody-antigen system and affinity distribution analysis. Methods 2013, 59, 328. 10.1016/j.ymeth.2012.12.007. [DOI] [PMC free article] [PubMed] [Google Scholar]
- Chiodi E.; Marn A. M.; Geib M. T.; Ekiz Kanik F.; Rejman J.; AnKrapp D.; Ünlü M. S. Highly Multiplexed Label-Free Imaging Sensor for Accurate Quantification of Small-Molecule Binding Kinetics. ACS Omega 2020, 5, 25358–25364. 10.1021/acsomega.0c03708. [DOI] [PMC free article] [PubMed] [Google Scholar]
- Sevenler D.; Selim Ünlü M. Numerical techniques for high-throughput reflectance interference biosensing. J. Mod. Opt. 2016, 63, 1115–1120. 10.1080/09500340.2015.1117668. [DOI] [Google Scholar]
- Daaboul G. G.; Vedula R. S.; Ahn S.; Lopez C. A.; Reddington A.; Ozkumur E.; Ünlü M. S. LED-based Interferometric Reflectance Imaging Sensor for quantitative dynamic monitoring of biomolecular interactions. Biosens. Bioelectron. 2011, 26, 2221–2227. 10.1016/j.bios.2010.09.038. [DOI] [PubMed] [Google Scholar]
- DeChancie J.; Houk K. N. The Origins of Femtomolar Protein-Ligand Binding: Hydrogen-Bond Cooperativity and Desolvation Energetics in the Biotin-(Strept)Avidin Binding Site. J. Am. Chem. Soc. 2007, 129, 5419–5429. 10.1021/ja066950n. [DOI] [PMC free article] [PubMed] [Google Scholar]
- Özkumur E.; Yalçın A.; Cretich M.; Lopez C. A.; Bergstein D. A.; Goldberg B. B.; Chiari M.; Ünlü M. S. Quantification of DNA and protein adsorption by optical phase shift. Biosens. Bioelectron. 2009, 25, 167–172. 10.1016/j.bios.2009.06.033. [DOI] [PMC free article] [PubMed] [Google Scholar]
- Pirri G.; Damin F.; Chiari M.; Bontempi E.; Depero L. E. Characterization of A Polymeric Adsorbed Coating for DNA Microarray Glass Slides. Anal. Chem. 2004, 76, 1352–1358. 10.1021/ac0352629. [DOI] [PubMed] [Google Scholar]
Associated Data
This section collects any data citations, data availability statements, or supplementary materials included in this article.


