

Abstract
DNA and RNA have been measured with many techniques but often with relatively long analysis times. In this study, we utilize fast-scan cyclic voltammetry (FSCV) for the subsecond codetection of adenine, guanine, and cytosine, first as free nucleosides, and then within custom synthesized oligos, plasmid DNA, and RNA from the nematode Caenorhabditis elegans. Previous studies have shown the detection of adenosine and guanosine with FSCV with high spatiotemporal resolution, while we have extended the assay to include cytidine and adenine, guanine, and cytosine in RNA and single- and double-stranded DNA (ssDNA and dSDNA). We find that FSCV testing has a higher sensitivity and yields higher peak oxidative currents when detecting shorter oligonucleotides and ssDNA samples at equivalent nucleobase concentrations. This is consistent with an electrostatic repulsion from negatively charged oxide groups on the surface of the carbon fiber microelectrode (CFME), the negative holding potential, and the negatively charged phosphate backbone. Moreover, as opposed to dsDNA, ssDNA nucleobases are not hydrogen-bonded to one another and thus are free to adsorb onto the surface of the carbon electrode. We also demonstrate that the simultaneous determination of nucleobases is not masked even in biologically complex serum samples. This is the first report demonstrating that FSCV, when used with CFMEs, is able to codetect nucleobases when polymerized into DNA or RNA and could potentially pave the way for future uses in clinical, diagnostic, or research applications.
1. Introduction
Deoxyribonucleic acid (DNA) carries the genetic information needed to sustain life via unique combinations of four different nucleobases (adenine, guanine, thymine, and cytosine) and has a double-stranded structure with its nucleobases shielded by the phosphate backbone groups.1 Two of these nucleobases, adenine and guanine, are purines, with a double-ring structure. The other two, thymine and cytosine, are pyrimidines containing a single-ring structure.2−4 Various analytical techniques have been developed for the detection of DNA or RNA, such as capillary zone electrophoresis,5,6 high-performance liquid chromatography,7 fluorescence,8 gas chromatography,9 and infrared reflection absorption spectroscopy.10 To identify specific DNA or RNA sequences, polymerase chain reaction (PCR)11 and hybridization- or sequence-based high-throughput methods, including microarrays12 and DNA or RNA sequencing (DNA-seq or RNA-Seq)13,14 have been developed. These methods are well established, but they are relatively slow, while electrochemical sensors offer simpler, less expensive, and faster (millisecond) methods for sample evaluation,15 which can be used for evaluating samples prior to sequence-based methods.16,17
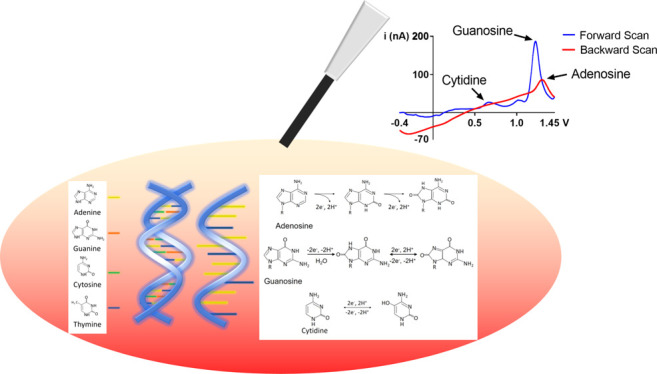
Electrochemical DNA biosensors detect the redox signal of the target analytes or a hybridization of a specific single-stranded DNA (ssDNA) sequence with its complementary strand, which are accumulated on the electrode surface.18,19 The purine bases of DNA can be oxidized electrochemically through carbon, gold,64 indium tin oxide, and polymer-coated conductive electrodes.18 The most commonly used electrochemical biosensors are carbon-based biosensors.20−26 Among carbon-based sensors, carbon fiber microelectrodes (CFMEs) are suitable for detecting biomolecular analytes at subsecond times with high sensitivity and selectivity.27−30 They are relatively small, inert, and biocompatible and thus can be used for the in vivo detection of neurotransmitters.31−35 Fast-scan cyclic voltammetry (FSCV) coupled with CFMEs is a commonly used electrochemical technique to detect neurotransmitters in the brain with subsecond temporal resolution.32,34,36−39,65 In recent years, it has been explored to study the rapid purinergic signaling in the brain. Specifically, the Venton laboratory showed that adenosine can be detected with FSCV utilizing the triangle waveforms at high (1.45 V) switching potentials.40 With FSCV, it is more facile to detect purines (adenosine and guanosine) than pyrimidines (cytidine and thymine) due to their higher oxidative electrochemical activity. However, conventional triangular waveforms produce overlapping peaks for adenosine and guanosine,25,41−43 thus making it challenging to codetect these analytes simultaneously using FSCV.
Recently, the Ross group has shown the codetection of adenosine and guanosine with FSCV by utilizing a “scalene”-shaped waveform to increase the oxidative peak separation between guanosine and adenosine.44 Despite the significantly improved resolution between guanosine and adenosine as compared with that of the conventional triangle waveform, the simultaneous detection of polymerized nucleobases within DNA or RNA has not yet been explored. Moreover, cytosine (a pyrimidine), in particular, has a relatively higher oxidation potential and slower electron-transfer kinetics compared with purine bases, guanine and adenine.45
In this study, we optimized a scalene waveform for FSCV testing with CFMEs coupled with DNA base ratios in a mixture to multiplex the detection of adenine, guanine, and cytosine applied to oligonucleotides, extracted plasmid DNA, and Caenorhabditis elegans RNA. We demonstrate a higher sensitivity toward shorter and single-stranded oligonucleotide samples than longer and double-stranded oligonucleotides, respectively. Furthermore, we show that nucleobases can be detected in a complex rat serum sample in spite of interfering biological substances. This suggests that FSCV with CFMEs can be used in complex biological fluids to detect DNA or RNA, evaluating multiple nucleobase analytes, simultaneously.
2. Results and Discussion
2.1. Codetection of Nucleosides and Nucleotides
Since the scan rate determines the flux of analytes to the electrode surface, we hypothesized that using the scalene waveform, which varies the scan rates when ramping up and ramping down, would allow us to codetect and differentiate purines and pyrimidines. We used a scalene waveform that sweeps up at 150 V/s and sweeps back down at 400 V/s from −0.4 to 1.45 V, since forward scan rates lower than 150 V/s were less sensitive to nucleotide samples, especially at lower concentrations. We term this the “150–400 scalene waveform”. Using the 150–400 scalene waveform, we first examined the codetection of free adenine, guanine, and cytidine nucleosides, which were obtained from a commercial vendor (see Methods and Materials). Each gave a distinct oxidation peak, and the shapes of the cyclic voltammograms were distinguishable from one another (Figure 1A).
Figure 1.

Codetection of adenine, guanine, and cytosine using the modified scalene waveform. Representative cyclic voltammograms of (A) nucleosides and (B) nucleotides with a ratio of 1 cytosine to 20 purine bases (adenine and guanine) and the corresponding color plots for (C) nucleosides and (D) nucleotides. 10-bp synthetic poly-AAT (5′-AATAATAATAATAA-3′), poly-GGT (5′-GGTGGTGGTGGTGG-3′), and poly-CCT (5′-CCTCCTCCTCCTCC-3′) were used. (E) 150/400 scalene waveform, which ramps up from −0.4 to 1.45 V at 150 V/s and ramps down at 400 V/s.
The oxidation of adenosine and guanosine occurs at the purine nucleobase moieties, adenine and guanine. Among the three nitrogenous bases, guanosine yields the highest peak oxidative current because guanine is the most electrochemically active base. Guanosine’s oxidation involves two-step oxidation processes with transferring four electrons and four protons. The first step oxidizes guanosine to 8-oxoguanosine (Scheme 1), which is the rate-limiting step. This is followed by a secondary oxidation step which yields an unstable product.41 The corresponding oxidation peaks can be found at 1.15 V for the primary peak and at 0.65 V for the secondary peak, respectively (both on the forward scan) as shown in the literature.45 Meanwhile, adenosine’s molecular oxidation involves three oxidation steps with total exchanges of six electrons and six protons, yielding a dicarbonium ion as an intermediate (Scheme 2).46 The corresponding oxidative peaks for adenosine are found at 1.4 V on the backward scan for the primary peak and 0.95 and 0.2 V for the secondary and tertiary peaks, respectively.40,44,46 The oxidation peak of cytidine was observed at around 0.65 V with varying concentrations as shown in Figure S2, where the slope of the linear plot (sensitivity) was 0.06 nA/μM, 2 orders of magnitude lower than those of adenosine and guanosine. Cytidine undergoes a reversible one-step oxidation with a transfer of two electrons and two protons (Scheme 3).47
Scheme 1. Oxidation–Reduction Reaction Schemes of Guanosine; Four Electrons Are Involved in Oxidizing Guanosine to Produce the Final Product41.

Adapted with permission from [Analyst2019,144 (1), 249–257]. Copyright [2019] [Royal Society of Chemistry].
Scheme 2. Oxidation Schemes of Adenosine Where the First Two Oxidations of Adenosine Involving Two Electrons Each Are Irreversible46.

The product from the tertiary oxidation can be reduced back regaining two electrons. Adapted with permission from [Anal. Chem.2007,79, 2, 744–750. Copyright [2007] [ACS publications].
Scheme 3. Oxidation Scheme of Cytosine Involving the Electron-Transfer Mechanism47.

Adapted with permission from [Int. J. Electrochem. Sci.2017,12, 2329–2343]. Copyright [2017] [International Journal of Electrochemical Science].
For the multianalyte codetection, we noted that the oxidative peak of adenosine is masked by the oxidative peak of cytidine during the codetection of the three nucleobases (Figure S3). It can be attributed to adenosine’s adsorption-controlled interaction with the carbon fiber electrode, which is typically slower than guanosine’s diffusion and partially adsorption-controlled interaction. In order to minimize the interfering effect of cytidine while maintaining its sensitivity, a molar ratio mixture of 1 cytidine to 20 adenosine and guanosine (1C:20A:20G) was used. The distinction between the oxidative peaks of adenine, cytosine, and guanine can be verified by a color plot, which shows the separation of each oxidation peak at different voltages (y-axis) as shown in Figure 1C,D. The simultaneous measurement CV of adenine, guanine, and cytosine was obtained from the vertical slice of this color plot at approximately 5.5 s. The false color plot is a representation of current versus voltage over time. The blue color represents the negative reduction current, while the green color represents the positive oxidation current, and yellow represents the background charging current as shown in the scale. There is less distinction between the primary peaks of cytosine, showing some coalescence with the secondary oxidative peak for guanine since it has a sensitivity of 0.06 nA/μM, which is 2 orders of magnitude lower than those of guanosine. The separation of the peaks indicates their difference in kinetic activity at the electrode cycling voltages.
Having shown that free nucleosides can be codetected using the 150–400 scalene waveform, we tested whether the synthetic ssDNA is a suitable substrate for the codetection of the three nucleobases. For this experiment, we tested 10-bp synthetic poly-AAT or poly-GGT (to avoid G-quadruplex) sequences. While the position of each potential remains unchanged, there is a significant difference in the oxidative current relative to free nucleosides (Figure 1B). This can likely be attributed to the negatively charged sugar–phosphate backbone of the ssDNA that is electrostatically repelled from the carbon surface and may affect the kinetics of adsorption and/or desorption to the electrode surface.
To determine whether the nucleobases are adsorption controlled to the surface of the electrode, we performed a series of concentration dilution experiments directly comparing both adenine in ssDNA versus adenosine and guanine in ssDNA versus guanosine. Figure 2A,C shows that the peak oxidative current response is linear at lower concentrations, whereas it becomes asymptotic at higher concentrations (both for A-based or G-based analytes) above 20 μM. This suggests that adenosine becomes saturated on the electrode surface at higher concentrations. These experiments reveal that the peak oxidative current of both adenosine and adenine is indeed concentration-dependent. This also corroborated our hypothesis that adenosine is adsorption-controlled to the surface of the carbon electrode due to the linear relationship between the peak oxidative current and concentration. The sensitivity of the analytes can be quantified by the slope of the linear region. The sensitivity of adenosine is 1.93 nA/μM, whereas that of adenine in 10 bp poly-AAT ssDNA is 0.82 nA/μM, which is a 58% decrease (n = 3). Moreover, the sensitivity of guanosine (4.15 nA/μM) is dramatically decreased to 0.44 nA/μM for the guanine in 10 bp poly-GGT ssDNA, which is nearly a 10-fold decrease as plotted in Figure 2B,D. These results suggest that the electrostatic repulsion from the negatively charged phosphate backbone groups of the ssDNA and its bulkier size with respect to single nucleobases reduce their adsorption to the negatively charged electrode surface, hence decreasing the sensitivity. Furthermore, a significant decrease in the sensitivity of guanine in 10 bp ssDNA compared to that of adenine can explain the higher oxidative current of adenine compared to guanine in the ssDNA mixture sample (Figure 1B).
Figure 2.

Comparison of the concentration curve between (A) adenosine and adenine in ssDNA (5′-AATAATAATAATAA-3′) and (B) guanosine and guanine in ssDNA (5′-GGTGGTGGTGGTGG-3′). The detection sensitivity of purine bases in nucleosides and nucleotides was compared at (C) adenosine versus adenine in ssDNA at 50 μM (p = 0.0045, n = 3, two-tailed and unpaired t-test) and (D) guanosine versus guanine in ssDNA at 50 μM (p < 0.0001, n = 3, two-tailed and unpaired t-test). The peak oxidative current of purine bases was used to normalize the peak currents of each nucleotide in 10 bp ssDNA.
During nucleoside codetection, guanosine displayed a higher sensitivity compared to adenosine (Figure 3A,B). The concentration curve displays a linear relationship between the concentration of each purine and peak oxidative current between 1 and 20 μM. Although the overall sensitivity is lower compared to the single measurement of each analyte, guanosine (0.9 nA/μM) still has a higher sensitivity than adenosine (0.75 nA/μM) in their nucleoside mixture. However, the overall peak oxidation current of adenine is higher than that of guanine, as shown in Figures 3C and S4. Moreover, we observe a linear relationship between the peak oxidative current and concentration between 1 and 20 μM (Figure 3D).
Figure 3.

Nucleoside and nucleotide codetection comparison. (A,B) Adenosine and guanosine codetection at different concentrations along with their respective R2 values comparing lower concentrations (p < 0.0001, n = 3 for both). (C,D) Adenine and guanine codetection in 10 bp ssDNA (5′-AATAATAATAATAA-3′, 5′-GGTGGTGGTGGTGG-3′) and their comparison at lower concentrations (p < 0.0001, n = 3 for both). (E,F) Adenine and guanine codetection in 20 bp ssDNA (5′-AATAATAATAATAATAATAATAATAATAA-3′, 5′-GGTGGTGGTGGTGGTGGTGGT GGTGGTGG-3′) and their comparison at a lower concentration (p < 0.0001, n = 3 for both). (B,D,F) Linear range for detection at lower concentrations. Corresponding t-test on the peak oxidative current of (G) adenine in shorter (10 bases) and longer (20 bases) ssDNA (n = 3, p = 0.0017, two-tailed and unpaired t-test) and (H) guanine in 10 bases and 20 bases ssDNA (n = 3, p < 0.05, two-tailed and unpaired t-test).
Having shown that polymerized nucleobases can be measured, we hypothesized that increasing the sequence length would hinder the sensitivity of nucleobases due to both size and charge characteristics. As can be seen in Figure 3E,F, the longer molecules (20 bp poly-AAT and poly-GGT ssDNA) have approximately half the signal/sensitivity (current) observed from the shorter molecules (10 bp poly-AAT and poly-GGT ssDNA). The corresponding statistical analyses further demonstrate that both adenine (n = 3, p = 0.0017, t-test) and guanine (n = 3, p < 0.05, t-test) in longer (20 bp) ssDNA have a significantly decreased sensitivity compared to those in shorter (10 bp) ssDNA as shown in Figure 3G,H. This lower sensitivity is presumably due to the limitation of the longer base pair DNA mobility, thus reducing the adsorption capacity and the resulting electrochemical activity at the surface of the electrode. Moreover, we hypothesized that the increased number of negatively charged phosphate groups in longer ssDNA increases the electrostatic repulsion at the surface of the carbon fiber electrode, specifically oxygen-containing groups at the edge plane of the graphitic lattice and from the negative holding potential.29
Demonstrating that shorter single-stranded sequences are more easily detected than longer ones, we then tested whether annealing two complementary strands alters detection relative to their single-stranded forms. For this experiment, we annealed 5′-AGTAGTAGTAGTAG-3′ and 5′-CTACTACTACTACT-3′ carefully by heat and slow cooling (see Methods and Materials). It appears that the peak oxidative currents of adenine and guanine in the ssDNA show significantly greater signal than the double-stranded duplex (Figure 4A,B).Thus, we found that a key parameter for detection was whether the DNA was single-stranded (ssDNA) or double-stranded (dsDNA) in addition to its length. The sensitivity of adenine (n = 3, p < 0.001, t-test) and guanine (n = 3, p = 0.0021, t-test) in a mixture of ssDNA is higher than that of hybridized dsDNA, as can be seen from Figure 4A,B. The lower sensitivity of adenine and guanine in the dsDNA can be attributed to the formation of the double-helix structure, where nucleobases are not exposed to be freely adsorbed onto the electrode. In addition to this blocking effect, the concentration of the phosphate groups in the annealed DNA is doubled, and they surround the entire exterior of the molecule, which will be electrostatically repelled from the negatively charged surface of the CFMEs.
Figure 4.

Effect of annealing two complementary strands on the peak oxidative current (A) adenine in a mixture of ssDNA (5′-AGTAGTAGTAGTAG-3′) and adenine in annealed two complementary ssDNA (5′-AGTAGTAGTAGTAG-3′ and 5′-CTACTACTACTACT-3′) (n = 3, p < 0.001, two-tailed and unpaired t-test) and (B) guanine in a mixture of ssDNA and guanine in annealed two complementary ssDNA (n = 3, p = 0.0021, two-tailed and unpaired t-test).
To evaluate the practical applicability of a CFME sensor, we used real biological samples: plasmid DNA (Figure 5A), C. elegans RNA in buffer (5B), and rat serum (5C). For both plasmid DNA and C. elegans RNA, adenine and guanine were detected, displaying an increase in peak oxidative current with respect to their increasing concentrations. Adenine appeared to have a higher sensitivity than guanine at CFMEs, which is consistent with the aforementioned detection sensitivity of polymerized nucleobases. The current response of cytosine nucleobases was not within the limit of detection and was, therefore, not shown for this assay.
Figure 5.

Codetection of (A) adenine and guanine in native B9-plasmid DNA. (B) Adenine and guanine in native C. elegans RNA. (C) Example cyclic voltammograms of the multiplex detection of nucleobases with simultaneously increasing rat serum volume. (D) Series dilution showing a linear relationship between rat serum concentration and peak oxidative current between 4 and 100 μL/mL for all three nucleobase peaks.
Given that we could detect purified biologically isolated DNA and RNA, we determined whether the detection of the nitrogenous bases could be performed in a complex biological sample such as rat serum. The false-color plot shows that oxidative peaks of each nucleobase are well-resolved, confirming the separation of each oxidation peak at different voltages (y-axis) as shown in Figure S5. Our initial plan was to spike in synthetic nucleobases or plasmid DNA, but unexpectedly, the primary oxidation peaks of adenine, guanine, and cytosine were detected in the serum as shown in the CV plots (Figure 5C). These data suggest that nucleobases are circulating in the blood, likely including RNA/DNA from lysed cells. However, the peaks appeared slightly shifted to lower oxidative potentials at around 1.15, 1.00, and 0.55 V, respectively (Figure 5C). This is shifted from the flow-cell peak voltages of 1.4, 1.15, and 0.65 V for A, G, and C, respectively, where stock solutions of the nucleobases are diluted in phosphate-buffered saline (PBS) buffer (pH = 7.4) (Figure 1).
To confirm that these peaks are the nucleobases, we performed spike-in testing of each base with a fixed amount of rat serum and found augmentation of each expected endogenous peak as shown in Figures 6A–D and S6A–C. An additional peak was observed at around 1.2 V and is associated with the spike-in guanosine, which may reflect the peak that we observe in rat serum (approximately at 1.00 V) combined with a peak near the flow-cell voltage of ∼1.15 V. Both peaks increase with spiked-in guanosine (Figure S6). These results confirm that our method is indeed capable of detecting adenine, guanine, and cytosine bases in a rat serum sample. We hypothesize that the overall shift of oxidative current peak to a lower oxidative potential found at all nucleobases in a rat serum might be attributed to the pH changes of the serum48−50 or active interfering electrochemical properties of constituents in the serum,51 such as hemoglobin, serum albumin, or other proteins.52 This suggests enhanced electrocatalytic effects, but further experiments are required before this can be ascertained. We found that the pH of the rat serum in our experiment was 8.5, as opposed to buffer (pH = 7.4) and is consistent with the shifted peaks observed. In addition, protein–protein interactions53 and protein-ion (i.e., Na+, K+ in the buffer solution) interactions54 could have possible implications for the ion-shielding and the resulting reduced detection of endogenous nucleobases. This is a proof of the principle study that FSCV with CFMEs can be utilized to detect nucleobases in the presence of a complex biological sample such as serum, which would allow for real-world diagnostic applications. This further illustrates that endogenous nucleobase-containing samples can be detected using our method (Figure 5C).
Figure 6.

(A) Cyclic voltammograms of the colligative spike-in test with adenine, guanine, and cytosine. The corresponding concentrations show a linear relationship between the concentration of (B) adenine, (C) guanine, (D) cytosine, and peak oxidative current with increasing spike-in amount between 0.4 and 20 μM (n = 3).
3. Conclusions and Future Perspectives
This study paves the way for the multiplex detection of adenine, guanine, and cytosine at the modified scalene waveform. In this work, we used CFMEs with FSCV and a scalene waveform to codetect multiple nucleobases. We found that single-stranded molecules (whether DNA or RNA) have a higher sensitivity of detection than double-stranded molecules and that complex sample matrices (such as blood serum) do not preclude detection. Therefore, these results suggest that our method could eventually be useful in clinical settings such as detecting pathogens, particularly, single-stranded RNA or DNA viruses, within blood samples.
Indeed, it has been shown that cell-free DNA and RNA are present at low levels in the blood of healthy humans and that the levels increase upon infection with certain pathogens.55 For example, difficult-to-diagnose fungal infections have been associated with elevated levels of cell-free circulating DNA.56,57 This could be important because fungal infections are often difficult or impossible to culture; they have a high fatality rate, and liquid biopsy of blood is a promising approach to quickly identify these cases.57,58 Our work with FSCV opens the tantalizing possibility to begin evaluating levels of cell-free DNA in clinical samples from healthy and infected patients to identify clinically useable signatures of infection types. More importantly, our work shows that the detection of nucleic acids is feasible in complex biological contexts like blood serum.
In addition, it also has been determined that cancers and autoimmune diseases can cause significant increases in cell-free DNA as cells lyse or undergo necrosis.59 Therefore, we speculate that a rapid nucleic acid detector may provide valuable information in the clinic, enabling a quick prescreening prior to sequence-based testing like PCR. The possibility to test additional fluids beyond blood, including urine or saliva, may offer additional diagnostic potential.60 Further applications include the measurement of DNA/RNA and nucleotide biosynthesis and metabolism at the timescale approaching enzymatic metabolism in real time in situ.
Specifically, future work could investigate whether classes of pathogens have distinct elevated signatures of nucleic acids, whether protein or lipid viral coats interfere with the detection using FSCV, and to characterize the release of nucleic acids by the host cells. Another future direction would be a test with FSCV to detect structurally oxidized nucleobases such as 8-oxo-guanine, which correlates with cancer and diabetes in humans.61 Given that crime-scene forensics may require the detection of blood or other nucleic acid-bearing fluids, the development of a fast, portable, biocompatible, and robust CFME biosensor for DNA/RNA with a high spatial and temporal resolution may have long-lasting impacts beyond the laboratory or clinic.
4. Methods and Materials
4.1. Solutions and Chemicals
4.1.1. Purine and Pyrimidine Solutions
Lyophilized adenosine (Cas no: 58-61-7), guanosine (Cas no: 118-00-3), and cytidine (Cas no: 65-46-3) were obtained from Sigma-Aldrich Co. (St. Louis, MO). Each 10 mM stock solution was prepared in 0.1 M perchloric acid and diluted with PBS (131.5 mM NaCl, 3.25 mM KCl, 1.2 mM CaCl2, 12.5 mM NaH2PO4, 1.2 mM MgCl2, and 2.0 mM Na2SO4 with pH adjusted to 7.4).
4.1.2. Nucleic Acid Solutions
The synthesized ssDNAs with different sizes (10- and 20-mer) were obtained from Integrated DNA Technology (IDT) in an anhydrate form. The sequences of 10-mer and 20-mer of Poly-GGT ssDNA are 5′-GGTGGTGGTGGT ......GG-3′, where the recurrent thymidine prevents the G oligonucleotide from folding and then forming a quadruplex. Similar sequences of 10-mer and 20-mer of Poly-A oligonucleotide (10 bp poly-AAT ssDNA, 20 bp poly-AAT ssDNA) and 10 bases of Poly-CCT ssDNA (10 bp poly-CCT ssDNA) with thymidine were also obtained from IDT. The DNA strands were dissolved as a stock solution in nuclease-free water (nondiethyl pyrocarbonate treated) from Thermo Fischer Scientific (Life Technologies Corp., Austin, TX). Diluted solutions in the range of 1–100 μM were prepared as needed with PBS buffer solutions. Single-stranded oligonucleotide having sequences of 5′-AGTAGTAGTAGTAG-3′ was annealed with its complementary 5′-CTACTACTACTACT-3′ sequence. This was accomplished by mixing them at equimolar concentrations and then heating the mixture on a hot plate (95 °C) for 5 min. After this the hot plate was switched off, allowing the mixture to slowly cool to room temperature (approximately 90 min). When we performed the detection experiment, we used boiling to reseparate the strands as discussed in the text.
4.1.3. Plasmid DNA
We constructed a high-copy plasmid (B9) by ligating a segment of the prp-8 gene from the nematode Halicephalobus mephisto(62) into the RNAi vector L4440.63 Specifically, single colony of B9-carrying Escherichia coli was inoculated into two flasks using a sterile loop and then grown in 75 mL of LB culture media supplemented with 50 μg/mL ampicillin at 37 °C for 24 h with gentle shaking. The plasmid was then extracted from these bacteria using ZymoPure II Plasmid Maxiprep kit (Cat# D4202) according to the manufacturer’s protocols (one set of columns can process 150 mL of bacterial culture), followed by elution using 400 μL of DI rather than ethylenediaminetetraacetic acid, which could cause a background signal in FSCV. The obtained plasmid DNA was subsequently diluted in the range of 1–10 μM using PBS buffer in a centrifuge tube. The denatured form of the plasmid DNA was obtained by putting it in boiling water for 5 min and then letting it cool down in an ice bath for 2 min.
4.1.4. C. elegans RNA
The isolation of RNA was performed with Zymo Research DNA/RNA Miniprep Plus kit (Cat# D7003). The nematodes were cultured on standard nematode growth media plates at room temperature for 1 week. The worms were washed off the plates in M9 buffer and centrifuged at 400g for 1 min, followed by aspiration to form a high-density pellet. An equal volume of DNA/RNA shield buffer (from the Zymo DNA/RNA Miniprep Kit) was added to the pellet and it was rapidly frozen at −80 °C. To extract RNA from C. elegans, the frozen aliquot worms were thawed and transferred to ZR Bashing Bead Lysis Tubes (Cat# S6012). They were then vortexed for 5 min, followed by a 1 min rest and another vortexing for 5 min. Then, 30 μL of proteinase K buffer and 15 μL of Proteinase K were added to each tube, which was incubated for 30 min at 55 °C. The rest of the protocol was performed as per the manufacturer’s instructions to yield purified RNA for the procedure.
4.1.5. Rat Serum
The rat serum was obtained from the Davidson Laboratory in the Psychology Department of the American University, in accordance with the animal welfare and safety protocol #1604. The rats were anesthetized with isoflurane before they were decapitated. The blood was drained in a 15 mL falcon tube and was allowed to clot for 10–15 min at room temperature. It was then centrifuged at 2000g for 10 min at room temperature. The serum (supernatant) was subsequently pipetted out to a new tube and stored at −80 °C.
4.2. Instrumentation
4.2.1. CFME Preparation
The CFME preparation was based on previously reported procedures.28 Briefly, a single strand carbon fiber of 7 μm in diameter was separated and aspirated into a glass capillary with a 1.2 mm outer and 0.68 mm inner diameter (A-M Systems, Sequim, WA) using a vacuum pump. Carbon fibers were pulled to form two electrodes on a vertical pipette puller (Narishige, model PC-100 and PE-22, Tokyo, Japan) and then cut to lengths of approximately 100–150 μm. To stabilize the carbon fiber inside the glass capillary and prevent leakage of backfilled saturated KCl solution, protruding CFME tips were dipped in the epoxy hardener mixture (Epon 828 epoxy) (Miller-Stephenson, Morton Grove, IL) and diethylenetriamine (Sigma-Aldrich), 0.8% by mass resin, for approximately 15 s and then rinsed in acetone to wash away any excess residual epoxy. The electrodes were cured in the oven for 4 h at 125 °C.
4.2.2. Fast-Scan Cyclic Voltammetry
The cyclic voltammograms were obtained using the WaveNeuro FSCV System with 5 MΩ headstage (Pine Instruments). For data collection and analysis, the software high-definition cyclic voltammetry with the PC1e-6363 multifunction I/O device (National Instruments, Austin, TX) was used. Upon testing the electrodes, a triangle waveform was applied with a holding potential of −0.4 to 1.45 V against the silver–silver chloride reference electrode (Ag/AgCl, −0.197 V) and back at a scan rate of 400 V/s with a frequency of 10 Hz. However, for the scalene waveform, a potential in the range of −0.4 −1.45 V against the silver–silver chloride (Ag/AgCl) reference electrode was applied and back at a forward scan rate of 150 V/s and a backward scan rate of 400 V/s with a frequency of 10 Hz. Each electrode was back-filled with 0.1 M KCl solution to create an electrical connection and was allowed to equilibrate with the applied waveform for 10 min. Samples were tested in a flow injection analysis system (In Vitro/FSCV Microelectrode Flow Cell with xyz micromanipulator Translational Stage, Pine Instruments, Durham, NC). The buffer and samples were pumped through the flow cell at 1 mL/min using the NE-300 Just Infusion Syringe Pump (New Era Pump Systems, Farmingdale, NY). All data were background-subtracted to remove any non-Faradaic currents by averaging 10 CVs.
4.3. Statistical Analysis
The statistical analysis was performed with the software GraphPad Prism 8 by performing two-tailed and unpaired t-test. All were performed at the 95% confidence level (p < 0.05).
Acknowledgments
We acknowledge the following funding sources: the American University Faculty Research Support grant (A.G.Z.), the Faculty Mellon Grant, the NASA DC Space grant, NIH 1R41NS113702-01 (A.G.Z.), the SACP Pittcon Starter grant, and the NSF I-Corps #1936173 (A.G.Z.).
Supporting Information Available
The Supporting Information is available free of charge at https://pubs.acs.org/doi/10.1021/acsomega.0c04845.
Cyclic voltammograms of conventional triangle waveform to codetect purines compared to scalene waveform with a 150 V/s forward scan rate to codetect purines; background-subtracted CVs of cytidine with varying concentrations and concentration experiment showing a linear relationship between cytidine concentration and the peak oxidative current between 5 and 20 μM; cyclic voltammograms of the codetection of cytidine and 20 μM adenine and guanine with varying cytidine concentrations of 1, 5, and 10 μM and representative color plot for the codetection of 1 μM cytidine and 20 μM adenine and 20 μM guanine in a rat serum sample; representative cyclic voltammograms of the codetection of 20 μM adenine and guanine in ssDNA, codetection of adenine and guanine with simultaneously varying concentrations in the range of 10–100 μM, and concentration experiment showing a linear relationship between the concentration of each purine and peak oxidative current between 20 and 100 μM (n = 3); and cyclic voltammograms of the spike-in test with adenosine, guanosine, and cytidine (PDF)
Author Contributions
§ T.M.A. and W.C. authors contributed equally to this work.
The authors declare no competing financial interest.
Supplementary Material
References
- Zhou W.; Saran R.; Liu J. Metal sensing by DNA. Chem. Rev. 2017, 117, 8272–8325. 10.1021/acs.chemrev.7b00063. [DOI] [PubMed] [Google Scholar]
- Dragunow M.; Faull R. L. M. Neuroprotective effects of adenosine. Trends Pharmacol. Sci. 1988, 9, 193–194. 10.1016/0165-6147(88)90079-x. [DOI] [PubMed] [Google Scholar]
- Bettio L. E. B.; Gil-Mohapel J.; Rodrigues A. L. S. Guanosine and its role in neuropathologies. Purinergic Signalling 2016, 12, 411–426. 10.1007/s11302-016-9509-4. [DOI] [PMC free article] [PubMed] [Google Scholar]
- Di Liberto V.; Mudò G.; Garozzo R.; Frinchi M.; Fernandez-Dueñas V.; Di Iorio P.; Ciccarelli R.; Caciagli F.; Condorelli D. F.; Ciruela F. The guanine-based purinergic system: the tale of an orphan neuromodulation. Front. Pharmacol. 2016, 7, 158. 10.3389/fphar.2016.00158. [DOI] [PMC free article] [PubMed] [Google Scholar]
- Klampfl C. W.; Himmelsbach M.; Buchberger W.; Klein H. Determination of purines and pyrimidines in beer samples by capillary zone electrophoresis. Anal. Chim. Acta 2002, 454, 185–191. 10.1016/s0003-2670(01)01570-7. [DOI] [Google Scholar]
- Yang F.-Q.; Ge L.; Yong J. W. H.; Tan S. N.; Li S.-P. Determination of nucleosides and nucleobases in different species of Cordyceps by capillary electrophoresis–mass spectrometry. J. Pharmaceut. Biomed. Anal. 2009, 50, 307–314. 10.1016/j.jpba.2009.04.027. [DOI] [PubMed] [Google Scholar]
- Fan H.; Yang F. Q.; Li S. P. Determination of purine and pyrimidine bases in natural and cultured Cordyceps using optimum acid hydrolysis followed by high performance liquid chromatography. J. Pharmaceut. Biomed. Anal. 2007, 45, 141–144. 10.1016/j.jpba.2007.02.032. [DOI] [PubMed] [Google Scholar]
- Pang S.; Zhang Y.; Wu C.; Feng S. Fluorescent carbon dots sensor for highly sensitive detection of guanine. Sens. Actuators, B 2016, 222, 857–863. 10.1016/j.snb.2015.09.037. [DOI] [Google Scholar]
- Glavin D. P.; Cleaves H. J.; Buch A.; Schubert M.; Aubrey A.; Bada J. L.; Mahaffy P. R. Sublimation extraction coupled with gas chromatography-mass spectrometry: a new technique for future in situ analyses of purines and pyrimidines on Mars. Planet. Space Sci. 2006, 54, 1584–1591. 10.1016/j.pss.2005.12.023. [DOI] [Google Scholar]
- Yamada T.; Shirasaka K.; Takano A.; Kawai M. Adsorption of cytosine, thymine, guanine and adenine on Cu(110) studied by infrared reflection absorption spectroscopy. Surf. Sci. 2004, 561, 233–247. 10.1016/j.susc.2004.05.095. [DOI] [Google Scholar]
- Saiki R.; Gelfand D.; Stoffel S.; Scharf S.; Higuchi R.; Horn G.; Mullis K.; Erlich H. Primer-directed enzymatic amplification of DNA with a thermostable DNA polymerase. Science 1988, 239, 487–491. 10.1126/science.2448875. [DOI] [PubMed] [Google Scholar]
- Sassolas A.; Leca-Bouvier B. D.; Blum L. J. DNA biosensors and microarrays. Chem. Rev. 2008, 108, 109–139. 10.1021/cr0684467. [DOI] [PubMed] [Google Scholar]
- Wang Z.; Gerstein M.; Snyder M. RNA-Seq: a revolutionary tool for transcriptomics. Nat. Rev. Genet. 2009, 10, 57–63. 10.1038/nrg2484. [DOI] [PMC free article] [PubMed] [Google Scholar]
- Pareek C. S.; Smoczynski R.; Tretyn A. Sequencing technologies and genome sequencing. J. Appl. Genet. 2011, 52, 413–435. 10.1007/s13353-011-0057-x. [DOI] [PMC free article] [PubMed] [Google Scholar]
- Kaisti M. Detection principles of biological and chemical FET sensors. Biosens. Bioelectron. 2017, 98, 437–448. 10.1016/j.bios.2017.07.010. [DOI] [PubMed] [Google Scholar]
- Abbaspour A.; Noori A. Electrochemical studies on the oxidation of guanine and adenine at cyclodextrin modified electrodes. Analyst 2008, 133, 1664–1672. 10.1039/b806920d. [DOI] [PubMed] [Google Scholar]
- Ng K. L.; Khor S. M. Graphite-based nanocomposite electrochemical sensor for multiplex detection of adenine, guanine, thymine, and cytosine: A biomedical prospect for studying DNA damage. Anal. Chem. 2017, 89, 10004–10012. 10.1021/acs.analchem.7b02432. [DOI] [PubMed] [Google Scholar]
- Drummond T. G.; Hill M. G.; Barton J. K. Electrochemical DNA sensors. Nat. Biotechnol. 2003, 21, 1192–1199. 10.1038/nbt873. [DOI] [PubMed] [Google Scholar]
- Stepanova V.; Smolko V.; Gorbatchuk V.; Stoikov I.; Evtugyn G.; Hianik T. DNA-Polylactide Modified Biosensor for Electrochemical Determination of the DNA-Drugs and Aptamer-Aflatoxin M1 Interactions. Sensors 2019, 19, 4962. 10.3390/s19224962. [DOI] [PMC free article] [PubMed] [Google Scholar]
- McCreery R. L. Advanced carbon electrode materials for molecular electrochemistry. Chem. Rev. 2008, 108, 2646–2687. 10.1021/cr068076m. [DOI] [PubMed] [Google Scholar]
- Yang C.; Jacobs C. B.; Nguyen M. D.; Ganesana M.; Zestos A. G.; Ivanov I. N.; Puretzky A. A.; Rouleau C. M.; Geohegan D. B.; Venton B. J. Carbon nanotubes grown on metal microelectrodes for the detection of dopamine. Anal. Chem. 2015, 88, 645–652. 10.1021/acs.analchem.5b01257. [DOI] [PMC free article] [PubMed] [Google Scholar]
- Zestos A. G. Carbon Nanoelectrodes for the Electrochemical Detection of Neurotransmitters. Int. J. Electrochem. 2018, 2018, 3679627. 10.1155/2018/3679627. [DOI] [PMC free article] [PubMed] [Google Scholar]
- Cao Q.; Rogers J. A. Ultrathin Films of Single-Walled Carbon Nanotubes for Electronics and Sensors: A Review of Fundamental and Applied Aspects. Adv. Mater. 2009, 21, 29–53. 10.1002/adma.200801995. [DOI] [Google Scholar]
- Yun Y.; Dong Z.; Shanov V.; Heineman W. R.; Halsall H. B.; Bhattacharya A.; Conforti L.; Narayan R. K.; Ball W. S.; Schulz M. J. Nanotube electrodes and biosensors. Nano Today 2007, 2, 30–37. 10.1016/s1748-0132(07)70171-8. [DOI] [Google Scholar]
- Palecek E.; Bartosik M. Electrochemistry of nucleic acids. Chem. Rev. 2012, 112, 3427–3481. 10.1021/cr200303p. [DOI] [PubMed] [Google Scholar]
- Jacobs C. B.; Peairs M. J.; Venton B. J. Review: Carbon nanotube based electrochemical sensors for biomolecules. Anal. Chim. Acta 2010, 662, 105–127. 10.1016/j.aca.2010.01.009. [DOI] [PubMed] [Google Scholar]
- Huffman M. L.; Venton B. J. Carbon-fiber microelectrodes for in vivo applications. Analyst 2009, 134, 18–24. 10.1039/b807563h. [DOI] [PMC free article] [PubMed] [Google Scholar]
- Raju D.; Mendoza A.; Wonnenberg P.; Mohanaraj S.; Sarbanes M.; Truong C.; Zestos A. G. Polymer modified carbon fiber-microelectrodes and waveform modifications enhance neurotransmitter metabolite detection. Anal. Methods 2019, 11, 1620–1630. 10.1039/c8ay02737d. [DOI] [PMC free article] [PubMed] [Google Scholar]
- Bath B. D.; Michael D. J.; Trafton B. J.; Joseph J. D.; Runnels P. L.; Wightman R. M. Subsecond adsorption and desorption of dopamine at carbon-fiber microelectrodes. Anal. Chem. 2000, 72, 5994–6002. 10.1021/ac000849y. [DOI] [PubMed] [Google Scholar]
- Harreither W.; Trouillon R.; Poulin P.; Neri W.; Ewing A. G.; Safina G. Carbon nanotube fiber microelectrodes show a higher resistance to dopamine fouling. Anal. Chem. 2013, 85, 7447–7453. 10.1021/ac401399s. [DOI] [PMC free article] [PubMed] [Google Scholar]
- Zestos A. G.; Jacobs C. B.; Trikantzopoulos E.; Ross A. E.; Venton B. J. Polyethylenimine Carbon Nanotube Fiber Electrodes for Enhanced Detection of Neurotransmitters. Anal. Chem. 2014, 86, 8568–8575. 10.1021/ac5003273. [DOI] [PMC free article] [PubMed] [Google Scholar]
- Jacobs C. B.; Ivanov I. N.; Nguyen M. D.; Zestos A. G.; Venton B. J. High temporal resolution measurements of dopamine with carbon nanotube yarn microelectrodes. Anal. Chem. 2014, 86, 5721–5727. 10.1021/ac404050t. [DOI] [PMC free article] [PubMed] [Google Scholar]
- Zestos A. G.; Yang C.; Jacobs C. B.; Hensley D.; Venton B. J. Carbon nanospikes grown on metal wires as microelectrode sensors for dopamine. Analyst 2015, 140, 7283–7292. 10.1039/c5an01467k. [DOI] [PMC free article] [PubMed] [Google Scholar]
- Robinson D. L.; Venton B. J.; Heien M. L. A. V.; Wightman R. M. Detecting subsecond dopamine release with fast-scan cyclic voltammetry in vivo. Clin. Chem. 2003, 49, 1763–1773. 10.1373/49.10.1763. [DOI] [PubMed] [Google Scholar]
- Saylor R. A.; Hersey M.; West A.; Buchanan A. M.; Berger S. N.; Nijhout H. F.; Reed M. C.; Best J.; Hashemi P. In vivo hippocampal serotonin dynamics in male and female mice: determining effects of acute Escitalopram using fast scan cyclic voltammetry. Front. Neurosci. 2019, 13, 362. 10.3389/fnins.2019.00362. [DOI] [PMC free article] [PubMed] [Google Scholar]
- Lim G. N.; Ross A. E. Purine Functional Group Type and Placement Modulate the Interaction with Carbon-Fiber Microelectrodes. ACS Sens. 2019, 4, 479–487. 10.1021/acssensors.8b01504. [DOI] [PubMed] [Google Scholar]
- Kile B. M.; Walsh P. L.; McElligott Z. A.; Bucher E. S.; Guillot T. S.; Salahpour A.; Caron M. G.; Wightman R. M. Optimizing the temporal resolution of fast-scan cyclic voltammetry. ACS Chem. Neurosci. 2012, 3, 285–292. 10.1021/cn200119u. [DOI] [PMC free article] [PubMed] [Google Scholar]
- Ewing A. G.; Wightman R. M. Monitoring the stimulated release of dopamine with in vivo voltammetry. II: Clearance of released dopamine from extracellular fluid. J. Neurochem. 1984, 43, 570–577. 10.1111/j.1471-4159.1984.tb00936.x. [DOI] [PubMed] [Google Scholar]
- Hashemi P.; Dankoski E. C.; Petrovic J.; Keithley R. B.; Wightman R. M. Voltammetric detection of 5-hydroxytryptamine release in the rat brain. Anal. Chem. 2009, 81, 9462–9471. 10.1021/ac9018846. [DOI] [PMC free article] [PubMed] [Google Scholar]
- Nguyen M. D.; Venton B. J. Fast-scan cyclic voltammetry for the characterization of rapid adenosine release. Comput. Struct. Biotechnol. J. 2015, 13, 47–54. 10.1016/j.csbj.2014.12.006. [DOI] [PMC free article] [PubMed] [Google Scholar]
- Cryan M. T.; Ross A. E. Subsecond detection of guanosine using fast-scan cyclic voltammetry. Analyst 2019, 144, 249–257. 10.1039/c8an01547c. [DOI] [PubMed] [Google Scholar]
- Oliveira-Brett A. M.; Piedade J. A. P.; Silva L. A.; Diculescu V. C. Voltammetric determination of all DNA nucleotides. Anal. Biochem. 2004, 332, 321–329. 10.1016/j.ab.2004.06.021. [DOI] [PubMed] [Google Scholar]
- Stempkowska I.; Ligaj M.; Jasnowska J.; Langer J.; Filipiak M. Electrochemical response of oligonucleotides on carbon paste electrode. Bioelectrochemistry 2007, 70, 488–494. 10.1016/j.bioelechem.2006.07.012. [DOI] [PubMed] [Google Scholar]
- Cryan M. T.; Ross A. E. Scalene Waveform for Codetection of Guanosine and Adenosine Using Fast-Scan Cyclic Voltammetry. Anal. Chem. 2019, 91, 5987–5993. 10.1021/acs.analchem.9b00450. [DOI] [PubMed] [Google Scholar]
- Li H.; Wang X.; Wang Z.; Zhao W. Simultaneous determination of guanine, adenine, thymine and cytosine with a simple electrochemical method. J. Solid State Electrochem. 2016, 20, 2223–2230. 10.1007/s10008-016-3227-2. [DOI] [Google Scholar]
- Swamy B. E. K.; Venton B. J. Subsecond detection of physiological adenosine concentrations using fast-scan cyclic voltammetry. Anal. Chem. 2007, 79, 744–750. 10.1021/ac061820i. [DOI] [PubMed] [Google Scholar]
- Jankowska-Śliwińska J.; Dawgul M.; Kruk J.; Pijanowska D. G. Comparison of electrochemical determination of purines and pyrimidines by means of carbon, graphite and gold paste electrodes. Int. J. Electrochem. Sci. 2017, 12, 2329–2343. 10.20964/2017.03.16. [DOI] [Google Scholar]
- Meunier C. J.; Mitchell E. C.; Roberts J. G.; Toups J. V.; McCarty G. S.; Sombers L. A. Electrochemical selectivity achieved using a double voltammetric waveform and partial least squares regression: differentiating endogenous hydrogen peroxide fluctuations from shifts in pH. Anal. Chem. 2018, 90, 1767–1776. 10.1021/acs.analchem.7b03717. [DOI] [PMC free article] [PubMed] [Google Scholar]
- Takmakov P.; Zachek M. K.; Keithley R. B.; Bucher E. S.; McCarty G. S.; Wightman R. M. Characterization of local pH changes in brain using fast-scan cyclic voltammetry with carbon microelectrodes. Anal. Chem. 2010, 82, 9892–9900. 10.1021/ac102399n. [DOI] [PMC free article] [PubMed] [Google Scholar]
- Makos M. A.; Omiatek D. M.; Ewing A. G.; Heien M. L. Development and characterization of a voltammetric carbon-fiber microelectrode pH sensor. Langmuir 2010, 26, 10386–10391. 10.1021/la100134r. [DOI] [PMC free article] [PubMed] [Google Scholar]
- Anraku M.; Chuang V. T. G.; Maruyama T.; Otagiri M. Redox properties of serum albumin. Biochim. Biophys. Acta, Gen. Subj. 2013, 1830, 5465–5472. 10.1016/j.bbagen.2013.04.036. [DOI] [PubMed] [Google Scholar]
- Roche M.; Rondeau P.; Singh N. R.; Tarnus E.; Bourdon E. The antioxidant properties of serum albumin. FEBS Lett. 2008, 582, 1783–1787. 10.1016/j.febslet.2008.04.057. [DOI] [PubMed] [Google Scholar]
- Sønderby P.; Bukrinski J. T.; Hebditch M.; Peters G. H. J.; Curtis R. A.; Harris P. Self-interaction of human serum albumin: a formulation perspective. ACS Omega 2018, 3, 16105–16117. 10.1021/acsomega.8b02245. [DOI] [PMC free article] [PubMed] [Google Scholar]
- Becconi O.; Ahlstrand E.; Salis A.; Friedman R. Protein-ion Interactions: Simulations of Bovine Serum Albumin in Physiological Solutions of NaCl, KCl and LiCl. Isr. J. Chem. 2017, 57, 403–412. 10.1002/ijch.201600119. [DOI] [Google Scholar]
- Blauwkamp T. A.; Thair S.; Rosen M. J.; Blair L.; Lindner M. S.; Vilfan I. D.; Kawli T.; Christians F. C.; Venkatasubrahmanyam S.; Wall G. D.; Cheung A.; Rogers Z. N.; Meshulam-Simon G.; Huijse L.; Balakrishnan S.; Quinn J. V.; Hollemon D.; Hong D. K.; Vaughn M. L.; Kertesz M.; Bercovici S.; Wilber J. C.; Yang S. and clinical validation of a microbial cell-free DNA sequencing test for infectious disease. Nat. Microbiol. 2019, 4, 663–674. 10.1038/s41564-018-0349-6. [DOI] [PubMed] [Google Scholar]
- Abril M. K.; Barnett A. S.; Wegermann K.; Fountain E.; Strand A.; Heyman B. M.; Blough B. A.; Swaminathan A. C.; Sharma-Kuinkel B.; Ruffin F.. Diagnosis of Capnocytophaga canimorsus sepsis by whole-genome next-generation sequencing, Open forum infectious diseases; Oxford University Press, 2016. [DOI] [PMC free article] [PubMed] [Google Scholar]
- Hong D. K.; Blauwkamp T. A.; Kertesz M.; Bercovici S.; Truong C.; Banaei N. Liquid biopsy for infectious diseases: sequencing of cell-free plasma to detect pathogen DNA in patients with invasive fungal disease. Diagn. Microbiol. Infect. Dis. 2018, 92, 210–213. 10.1016/j.diagmicrobio.2018.06.009. [DOI] [PubMed] [Google Scholar]
- Lass-Flörl C.; Mutschlechner W.; Aigner M.; Grif K.; Marth C.; Girschikofsky M.; Grander W.; Greil R.; Russ G.; Cerkl P.; Eller M.; Kropshofer G.; Eschertzhuber S.; Kathrein H.; Schmid S.; Beer R.; Lorenz I.; Theurl I.; Nachbaur D. of PCR in diagnosis of invasive fungal infections: real-life data from a multicenter study. J. Clin. Microbiol. 2013, 51, 863–868. 10.1128/jcm.02965-12. [DOI] [PMC free article] [PubMed] [Google Scholar]
- Stewart C. M.; Kothari P. D.; Mouliere F.; Mair R.; Somnay S.; Benayed R.; Zehir A.; Weigelt B.; Dawson S.-J.; Arcila M. E.; Berger M. F.; Tsui D. W. The value of cell-free DNA for molecular pathology. J. Pathol. 2018, 244, 616–627. 10.1002/path.5048. [DOI] [PMC free article] [PubMed] [Google Scholar]
- Pös O.; Biró O.; Szemes T.; Nagy B. Circulating cell-free nucleic acids: characteristics and applications. Eur. J. Hum. Genet. 2018, 26, 937–945. 10.1038/s41431-018-0132-4. [DOI] [PMC free article] [PubMed] [Google Scholar]
- Poulsen H. E.; Weimann A.; Henriksen T.; Kjær L. K.; Larsen E. L.; Carlsson E. R.; Christensen C. K.; Brandslund I.; Fenger M. Oxidatively generated modifications to nucleic acids in vivo: Measurement in urine and plasma. Free Radical Biol. Med. 2019, 145, 336–341. 10.1016/j.freeradbiomed.2019.10.001. [DOI] [PubMed] [Google Scholar]
- Weinstein D. J.; Allen S. E.; Lau M. C.; Erasmus M.; Asalone K. C.; Walters-Conte K.; Deikus G.; Sebra R.; Borgonie G.; van Heerden E. The genome of a subterrestrial nematode reveals adaptations to heat. Nat. Commun. 2019, 10, 5268. 10.1038/s41467-019-13245-8. [DOI] [PMC free article] [PubMed] [Google Scholar]
- Conte D. Jr.; MacNeil L. T.; Walhout A. J.; Mello C. C. RNA Interference in Caenorhabditis elegans. Curr. Protoc. Mol. Biol. 2015, 109, 26.3.1–26.3.30. 10.1002/0471142727.mb2603s109. [DOI] [PMC free article] [PubMed] [Google Scholar]
- Mohanaraj S.; Wonnenberg P.; Cohen B.; Zhao H.; Hartings M. R.; Zou S.; Fox D. M.; Zestos A. G. Gold Nanoparticle Modified Carbon Fiber Microelectrodes for Enhanced Neurochemical Detection. Journal of Visualized Experiments 2019, 147, e59552. [DOI] [PMC free article] [PubMed] [Google Scholar]
- Mendoza A.; Asrat T.; Liu F.; Wonnenberg P.; Zestos A. G. Carbon Nanotube Yarn Microelectrodes Promote High Temporal Measurements of Serotonin Using Fast Scan Cyclic Voltammetry. Sensors 2020, 20 (4), 1173. 10.3390/s20041173. [DOI] [PMC free article] [PubMed] [Google Scholar]
Associated Data
This section collects any data citations, data availability statements, or supplementary materials included in this article.