

Abstract

Global circulation and liquid back mixing adversely affect the continuous production of a multistage internal airlift loop reactor. A contraction-expansion guide vane (CEGV) is proposed and combined with a two-stage internal loop airlift reactor (TSILALR) to suppress the liquid back mixing between stages. A computational fluid dynamics (CFD) simulation is conducted to evaluate the performance of the CEGV in the TSILALR. The bubble size distribution and turbulent flow properties in the TSILALR are considered in the CFD simulation by using the population balance model and RNG k-ε turbulence model. The CFD model is validated against the experimental results. The deviations in the gas holdup and mean bubble diameter between the simulation and experimental results are less than 8% and 6%, respectively. The streamlines, flow pattern, bubble size distribution, and axial liquid velocity in the TSILALRs with and without the CEGV at superficial velocities of 0.04 and 0.08 m/s are obtained by CFD simulation. It has been shown that the CEGV generated local circulation flows at each stage instead of a global circulation flow in the TSILALR. The average global gas holdup in the TSILALR with a CEGV increased up to 1.98 times. The global gas holdup increased from 0.045 to 0.101 and the average axial velocity in the riser decreased from 0.314 to 0.241 m/s when the width of the CEGV increased from 50 to 75 mm at the superficial gas velocity of 0.08 m/s.
1. Introduction
An internal loop airlift reactor (ILALR) is a type of pneumatically agitated vessel that is widely used in several applications such as chemical, petrochemical, bioprocessing, and water treatment processes.1−5 The advantages of the ILALR are its large capacity, simple structure without moving parts, easy operation, efficient mixing, and long residence time.6−8 Hydrodynamic properties such as gas holdup, liquid circulating velocity, and bubble size distribution (BSD) are necessary for the design and scale-up of the ILALRs.6,9 For example, gas holdup is a key factor affecting the mass transfer performance of ILALRs. A high gas holdup indicates a superior mixing capacity and high gas–liquid mass transfer rate in ILALRs. Therefore, various high-efficient ILALRs were developed from the perspective of increasing the gas holdup.10−13The hydrodynamics of the ILALRs have been studied mainly via experiment12,14−19 and computational fluid dynamics (CFD) simulation.20−27 In the experimental studies, gas holdup, mixing time, bubble size, residence time distribution, and liquid circulating velocity can be measured by invasive7 or non-invasive methods.17,18 In recent times, because of the development of computing techniques, CFD is extensively used to provide the details of the hydrodynamics inside the ILALR.
In the early studies, CFD simulation was performed without considering the variation in bubble size. However, it has been recognized that the bubble size in a bubble swarm varies significantly in a heterogeneous flow regime. The hydrodynamic properties of small bubbles are different from those of large bubbles. The results obtained from the CFD simulation with a constant bubble size were probably different from the real hydrodynamics of ILALRs. Therefore, it is essential to consider the size of different bubbles in CFD models. Krishna et al.28 assumed that, in a heterogeneous flow, there are two distinct classes of bubbles: small bubbles and large bubbles. They proposed a three-phase CFD model for simulating the behaviors of liquid, small bubbles, and large bubbles. Their simulation accurately predicted the BSD and hydrodynamic characteristics. Kostoglou et al.29 and Colella et al.30 combined the population balance model (PBM) with the CFD model. The PBM used several bubble classes to consider the breakup and coalescence of bubbles in the gas–liquid two-phase system. Wang et al.31−33 and Chen et al.23 successfully predicted the hydrodynamic behaviors (such as gas holdup, liquid velocity, flow regime, and bubble size distribution) and mass transfer characteristics in a bubble column using a CFD–PBM model. Silva et al.34 conducted a CFD–PBM simulation of an external loop airlift. They predicted the influence of circulation flows on gas holdup and mean bubble diameter. Yang et al.35 modified the PBM with a pressure correction factor to consider the effect of operating pressure. The simulation results are in good agreement with the experimental data of the bubble column operating at elevated pressures. Yang et al.36 considered the variation in bubble shapes while solving the PBM in the CFD simulation of gas–liquid two-phase flows in bubble columns. The relative error in the predicted gas holdup distribution was reduced by approximately 10%, and the modified CFD–PBM model had the advantage of estimating the total mass transfer coefficient. Xing et al.37 and Guo et al.38 investigated the effect of liquid viscosity on the hydrodynamic behavior in a bubble column using the CFD–PBM model. They indicated that the CFD–PBM model could describe the relationship between the total gas holdup and volume fractions of small and large bubbles with liquid viscosity in both homogeneous and heterogeneous regimes. Zhang et al.39 investigated the effect of the parameters of the class method (minimum bubble diameter and maximum bubble diameter) using the CFD–PBM model. They indicated that the local mean diameter increased with an increase in the minimum and maximum bubble diameters. Jourdan et al.20 and Liao et al.21 conducted a critical literature review on the development of the PBM and its applications in gas–liquid flow.
In recent years, many researchers have studied ILALRs from single-stage to multistage levels. Instead of single-stage ILALRs, multistage ILALRs have been proposed owing to their higher efficiency. It has been proved that multistage ILALRs have a higher gas holdup and mass transfer rate than single-stage ILALRs.40,41 Chen et al.42 found that, compared with the single-stage ILALR, the multistage ILALRs could reduce the fluid flow resistance, increase the liquid circulating velocity, and improve the mass transfer performance significantly. Tao et al.43 experimentally investigated the hydrodynamics and mass transfer of gas–liquid–solid slurry flow in a multistage ILALR. They indicated that only when the operating parameters such as superficial gas velocity and the height of the stage clearance are carefully designed, the multistage ILALRs can be operated normally. However, the multistage ILALRs have the disadvantage of intense liquid back mixing between stages in the case of a high superficial gas velocity. Yu et al.44 investigated the interstage internals of a perforated plate in multistage ILALRs. They indicated that, with a perforated plate, the interstage liquid back mixing decreased with an increase in the superficial gas velocity. Yu et al.45,46 used a novel interstage internal, which was a combination of a perforated plate and several tubes. They indicated that, compared with the traditional perforated plate internal, the novel internal showed better performance in terms of operational flexibility.
For continuous production by a two-stage ILALR (shown in Figure 1), a complete mixing is accomplished at every stage, and a plug flow is formed between the two stages. To realize the ideal flow pattern for continuous production by the ILALR, the internals should be designed to suppress global circulation and generate local circulation at each stage. Although it has been shown that the hydrodynamics can be adjusted by the internals, there have been relatively fewer studies that concentrated on the development of internals for multistage ILALRs. In this study, a two-stage internal loop airlift reactor (TSILALR) with a contraction-expansion guide vane (CEGV) was proposed. The CEGV has a simple structure and can be conveniently used with multistage ILALRs. The hydrodynamic characteristics of the gas–liquid system in the TSILALRs were described within the Eulerian framework of commercial software Ansys Fluent 18. The hydrodynamics properties of the TSILALR, such as gas holdup, BSD, bubble circulation regime, and liquid circulating velocity were obtained. The effects of the CEGV on the hydrodynamics were also investigated. The rest of the paper is organized as follows. In Section 2, the geometry of the TSILALR with a CEGV is illustrated. The CFD model including Eulerian multiphase model, turbulence model, and PBM, and the numerical settings are presented in Section 3. Section 3.4 shows a comparison of the simulation results with the experimental results. Section 4 presents the simulation results of velocity field, streamlines, gas holdup, BSD, axial liquid velocity, and bubble circulation regime of the TSILALR with a CEGV. The effects of the CEGV on the hydrodynamics of the TSILALR are discussed. Finally, the conclusions are presented in Section 5.
Figure 1.

Schematic of continuous production by multistage ILALRs.
2. Geometry of the TSILALR with a CEGV
As shown in Figure 2, the TSILALR consists of a cylindrical column, two draft tubes, a CEGV, and a gas distributor. The diameter and height of the column are 200 and 1200 mm, respectively. The draft tubes with a diameter of 100 mm and a height of 250 mm are installed inside the column. The guide vane divides the TSILALR into the first (lower) and second (upper) stages. The first draft tube (i.e., the first stage) is located 80 mm above the bottom of the TSILALR. The bottom of the second draft tube (i.e., the second stage) is located 160 mm above the top of the first draft tube. A perforated plate is used as the gas distributor and is located at the bottom of the TSILALR. The center of the CEGV is located 410 mm above the bottom of the TSILALR. The height of the CEGV is 50 mm, and the width of the CEGV, W, is in the range of 50–75 mm. The initial static liquid height is 1000 mm. Gas is introduced into the TSILALR through the gas distributor, and it leaves the TSILALR through the outlet.
Figure 2.
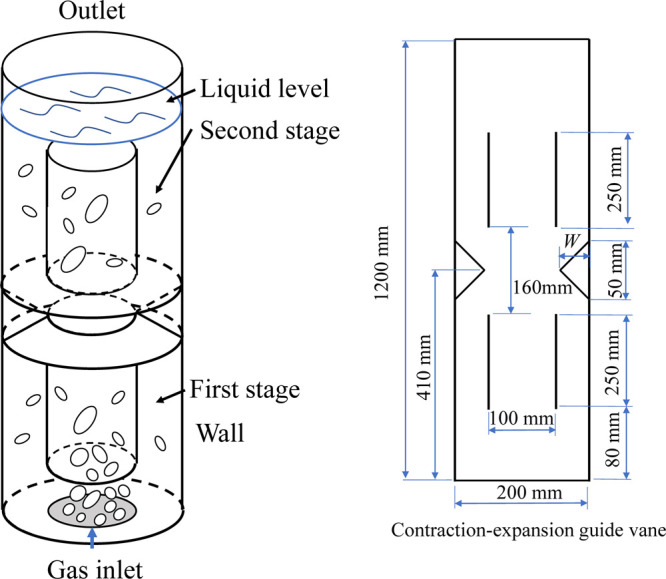
Geometry of two-stage ILALR with contraction-expansion guide vane.
3. Computational Fluid Dynamics Model
3.1. Eulerian Multiphase Model
In the present work, the hydrodynamic characteristics of the TSILALR were simulated within the Eulerian framework. The continuity equation is expressed as follows:
| 1 |
where αk, ρk, and uk are the volume fraction, density, and velocity vector, respectively, of the kth phase.
The momentum conservation equation is given by
| 2 |
where τkm and τkRe are the viscous stress and turbulence stress, respectively, of the kth phase.
The viscous stress, τkm, can be written as
| 3 |
where μk is the molecular viscosity of the kth phase.
The turbulence stress, τkRe, can be written as
| 4 |
where μkt is the turbulent viscosity.
Fk is the interphase momentum exchange term, which includes the virtual mass force FVM, drag force FD, transverse lift force FL, and turbulent dispersion force FTL. Researchers have illustrated that the magnitude of the drag force is much larger than that of the other forces. Moreover, calculations of lift force and turbulent dispersion force have been found to increase the computational cost, but the result did not change significantly when these forces are ignored.23,47 Therefore, based on the results reported by Sokolicin and Eigenberger48 and Shi et al.,36 only the virtual mass force and drag force were considered in the following calculation.
For the gas phase:
| 5 |
For the liquid phase:
| 6 |
Drag force was calculated using the model of Tomiyama et al.,49 which is widely used in the air–water system:31,35,50
| 7 |
where CD0 is the drag coefficient of a single bubble, and CDi is the drag coefficient of the bubble with diameter dbi, and fi is the volume fraction of the bubble with diameter dbi in the gas phase:
| 8 |
where Rei = dbi|ul – ug|ρl/μl; the Eotvos number Eoi of a bubble with diameter dbi is given by
| 9 |
where σ is the surface tension.
To consider the effects of the small bubble swarm, the drag coefficient was corrected as follows:51
| 10 |
where Eosmall is the Eotvos number of small bubbles:
| 11 |
where db,small is the local mean diameter of small bubbles with a diameter less than 4 mm.51
The virtual mass force is expressed by50
| 12 |
where the virtual mass force coefficient, CVM, was set to 0.25.
3.2. Turbulence Model
The RNG turbulence model was developed for swirling flows and a broader scale of turbulence.47 The RNG turbulence model has been widely used to simulate the hydrodynamics in bubble columns with an air–water system.52−54 Therefore, the per-phase RNG turbulence model was applied in this study. The turbulent viscosity for the kth phase, μkt, was calculated as
| 13 |
where kk and εk are the turbulent kinetic energy and turbulent energy dissipation rate, respectively, of the kth phase, which are obtained from the following transport equations:
| 14 |
| 15 |
where Gk,k represents the turbulence kinetic energy generated by the mean velocity gradients:
| 16 |
where Sk is the modulus of the mean rate-of-strain tensor and Πk is the turbulence kinetic energy generated by buoyancy:
| 17 |
where Kgl is the interphase turbulent drag coefficient:
| 18 |
Rε,k is a specific feature in the RNG formulation:
 |
19 |
The coefficient ηk is defined as follows:
| 20 |
Sk is given by
| 21 |
where Sk,ij is the mean strain rate, defined as follows:
| 22 |
The drift velocity udr is given by
| 23 |
The model constants are Cμ = 0.085, C1ε = 1.42, C2ε = 1.68, C3ε = 1.2, β = 0.012, and η0 = 4.38; σg and σl are the turbulent Schmidt numbers of the gas and liquid phases, respectively, which are equal to 0.75.
3.3. Population Balance Model
In a heterogeneous regime, the bubble size varies over a wide range, depending on the operating conditions and physical properties of the fluid. The PBM was coupled with the multiphase model to calculate the bubble size distribution. The PBM can be expressed as follows:
 |
24 |
where n is the bubble number density, f(X,v,t) is the number density function, X is the spatial position of the bubble, ν is the bubble volume, and t is the time. The first term on the right-hand side is the birth rate of bubbles of volume ν due to coalescence of bubbles of volume ν′ and ν – ν′, the second term is the death rate of bubbles of volume v due to coalescence with other bubbles, the third term is the birth rate of bubbles of volume v due to breakup of bubbles whose volume is greater than ν, and the fourth term is the death rate of bubbles of volume ν due to breakup of the bubbles.
The Luo bubble breakup model55 and Luo coalescence model56 were used to mimic the breakup and coalescence of the bubbles, respectively. Bubble breakup caused by bubble turbulence and instability of large bubbles and bubble coalescence caused by bubble collision were considered.33
The Luo coalescence probability is given by
| 25 |
where θij and Pc are the collision rate of the bubbles per unit volume and the coalescence probability, respectively.
θij is given by
| 26 |
where  is the characteristic velocity of the collision
of bubbles with diameters of dbi and dbj:
is the characteristic velocity of the collision
of bubbles with diameters of dbi and dbj:
| 27 |
| 28 |
Pc is given by
| 29 |
where ξ is the dimensionless eddy size (ξ = λ/dbi) and λ is the size of the eddies:
| 30 |
The Luo breakup probability is expressed as
| 31 |
where fBV is the volume fraction of the parent bubble that constitutes one daughter bubble; the model constants are CB = 0.9238 and β′ = 2.047.57
The discrete approach58 was used to solve the population balance equations. As presented in Table 1, nine successive bubble classes with diameters in the range of 0.4–16.13 mm, which were determined by experimental measurements, were used in the population balance equations. The minimum diameter of the bubbles was 0.4 mm. The volume ratio between successive bubble classes was 2.
Table 1. Bubble Classes in the PBM.
| class index | bubble diameter (mm) |
|---|---|
| 1 | 0.40 |
| 2 | 0.63 |
| 3 | 1.01 |
| 4 | 1.60 |
| 5 | 2.54 |
| 6 | 4.03 |
| 7 | 6.40 |
| 8 | 10.16 |
| 9 | 16.13 |
3.4. Numerical Settings and Boundary Conditions
Three-dimensional (3D) unsteady state simulation of air–water flow was performed in this study. The density and viscosity of water are 998.2 kg·m–3 and 0.001 Pa·s, respectively; the density and viscosity of air are 1.225 kg·m–3 and 1.789 × 10⁻⁵ Pa·s, respectively. The gas inlet was considered as a perforated plate with 13 holes of 0.5 mm in diameter. The inlet boundary was set as the velocity inlet, where the gas velocity was calculated using the gas inlet model proposed by Shi et al.,59 and the volume fraction of gas was set as 100%. The diameter of the bubbles at the inlet was assumed to be uniform and was calculated using Miyahara’s correlation.60 The inlet boundary conditions for the turbulent kinetic energy (kin) and dissipation rate (εin) were calculated as follows:
| 32 |
where DC is the hydraulic diameter of the perforated plate.
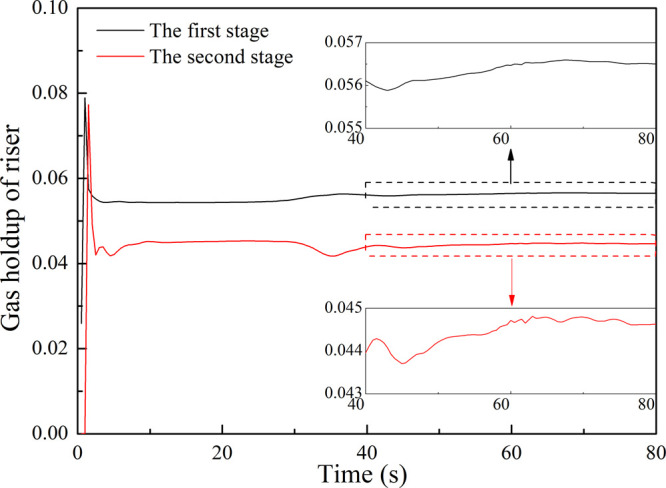
The outlet boundary was set as the pressure outlet with atmospheric pressure P = P0. A no-slip condition was used on the wall of the TSILALR. The time step was 1 × 10⁻³ s. Convergence of the numerical simulation was assumed when the normalized residuals for all the quantities were less than 1 × 10⁻⁴. The phase coupled SIMPLE scheme was used for pressure–velocity coupling. The second-order upwind scheme was used for the pressure equations, and the first-order upwind scheme was used for the other equations. Figures 3 and 4 show the variations in the simulated average gas holdup and axial velocity, respectively, of the riser with time in the TSILALR without a CEGV at Vg = 0.04 m·s–1. The gas holdup and axial velocity fluctuated drastically at the beginning of the simulation. A quasi-steady state was achieved after 40 s. Therefore, the averaged value between 40 and 80 s was considered as the final result in the following discussion.
Figure 3.
Variation in simulated gas holdup of riser with time at Vg = 0.04 m·s–1.
Figure 4.

Variation in simulated axial velocity of riser with time at Vg = 0.04 m·s–1.
4. Validation of the CFD Model
4.1. Experimental Setup
To validate the 3D CFD simulation, experiments were conducted to measure the gas holdup and bubble size. The schematic of the experimental setup is shown in Figure 5. A quasi-2D single-stage ILALR of 200 mm in width, 1200 mm in height, and 60 mm in depth was fabricated. A perforated plate with five holes of 0.5 mm in diameter was used as the gas distributor. For easy observation of the bubble behavior, the quasi-2D ILALR was made of poly(methyl methacrylate). Tap water (at 25 ± 0.5 °C and atmospheric pressure) and air were used as continuous and dispersed phases, respectively. Air was supplied by an air pump, and the gas flow rate was regulated by a gas rotameter. Air was introduced through the gas distributor. U-tube manometers were connected with pressure measuring ports located at the top and bottom of the ILALR to indicate the pressures in the riser and downcomer.
Figure 5.

Schematic of experimental setup for validation of the CFD model.
4.2. Grid Independence Test
The grid independence test was conducted at Vg = 0.01 m·s–1. The pressure drop and gas holdup in the ILALR with a CEGV (W = 50 mm) were selected to check the grid independence. Table 2 presents the simulated results with different grid resolutions. When the grid number exceeded 84,700, the relative errors in the pressure drop and gas holdup were less than 0.5% and 3%, respectively. The computational cost for grid #5 was the highest among all the grids. Therefore, the computational domain was discretized using 84,700 grids in the following simulation.
Table 2. Results of Grid Independence Test.
| no. | grid number | pressure drop (Pa) | relative error | gas holdup | relative error |
|---|---|---|---|---|---|
| grid #1 | 13,690 | 2235.15 | 2.7% | 0.064 | 9% |
| grid #2 | 30,225 | 2174.41 | 2.1% | 0.058 | –3% |
| grid #3 | 44,520 | 2128.03 | 1.4% | 0.060 | 16% |
| grid #4 | 84,700 | 2097.12 | 0.5% | 0.050 | 3% |
| grid #5 | 145,040 | 2087.33 | 0.048 |
4.3. Comparison of Results of Experiment and Simulation
4.3.1. Gas Holdup
The experimental value of gas holdup can be calculated from the pressures as follows:
| 33 |
where dhM is the manometer reading and dz is the distance between the two probes.
The uncertainty of the gas holdup is caused by the reading of dhM. The accuracy of the manometer is ±1 mm. Thus, the error in the measurement of gas holdup is ± (0.69–2.8)%.
Figure 6 shows a comparison of the results for gas holdup obtained from the simulation and experiment. For each operating condition, the experiment was repeated five times. The experimental values of gas holdup obtained during five runs were averaged and are shown in Figure 6. Error bars indicate standard deviation (SD) of five runs. The SDs of the experimental gas holdup at the riser and downcomer were in the range of 0.0014–0.0020 and 0.0021–0.0036, respectively. In both the riser and the downcomer, the simulated and experimental values of gas holdup increased with increase in the superficial gas velocity. When Vg increased from 0.005 to 0.020 m·s–1, the experimental and simulated values of αg of the riser increased to 4.90 times and 18.7 times, respectively. In the downcomer, the experimental and simulated values of αg increased to 5.97 times and 18.28 times, respectively. The differences in the simulated and experimental values of αg of the riser and downcomer were less than 8% and 7%, respectively. The differences may be because some interphase forces such as the lift force were ignored. Nevertheless, the difference is not significant, and the CFD–PBM model can describe the variation trend of αg in the ILALR.
Figure 6.

Comparison of experimental and simulated gas holdup with different superficial gas velocities at the (a) riser and (b) downcomer.
4.3.2. Local Mean Diameter of Bubbles
The local mean bubble diameter was measured using a photographic method. The imaging system consists of a high-speed digital camera, lamp, and diffuser plate. A high-speed CMOS camera (Photron FASTCAM SA4) was used to capture the images of the bubbles. The camera was equipped with a 105 mm, f 1:2.8D lens (Nikon AF Micro-Nikkor) to provide a view field of 70 × 70 mm. The images were recorded at a frame rate of 2000 Hz with a resolution of 1024 × 1024 pixels. The lamp provided contrast light for illuminating the bubble contours. The diffuser plate was placed between the lamp and the ILALR to obtain uniform illumination. To obtain a steady flow, the ILALR was operated with a continuous supply of air for at least 10 min prior to the experiment. The captured bubble contours are shown in Figure 7. There are 300–400 bubbles of different sizes in one image. The bubbles can be considered as oblate ellipsoidal, whose equivalent bubble diameter (di) is characterized by the major axis (E) and minor axis (e). The Sauter mean diameter of the bubbles, dst, was calculated as follows:
| 34 |
where di = (E2e)1/3. For each operating condition, the measurement of bubble size was repeated five times. The values of dst obtained during the five runs were averaged and are shown as the final result in Figure 8. The uncertainty of the equivalent bubble diameter is caused by the identification of the bubble contour. The accuracy of the post-processing of bubble image is ±1 pixel (±0.068 mm). Thus, the error in the post-processing of bubble image is ±(2.8–3.1)%.
Figure 7.

Post-processing of bubble image: (a) original image and (b) processed image.
Figure 8.

Comparison of experimental and simulated local mean bubble diameter in different axial heights.
A comparison of the simulated and experimental values of dst in the riser at Vg = 0.01 m·s–1 at different axial positions is shown in Figure 8. The value of dst at the entrance of the riser was underestimated by the simulation. The deviation at the entrance was approximately 6%. This deviation may be caused by the difference in the actual bubble diameter and that calculated by Miyahara’s correlation.60 The CFD result gradually approached the experimental value as the axial height increased. In particular, the simulated and experimental values of dst near the exit of the riser were almost the same.
5. Results and Discussion
5.1. Flow Fields
As shown in Figure 9a, the fluid circulated along the first and second stages in the TSILALR without a CEGV. A global circulation from the first stage to the second stage and back to the first stage was observed, because of which back mixing between the first and second stages occurred. Figure 9b illustrates that, in the TSILALR with a CEGV, water from the first-stage riser entered the first-stage downcomer, and water from the second-stage downcomer entered the second-stage riser. Visually, two local circulation flows occurred simultaneously in the first and second stages.
Figure 9.

Simulated streamlines in the TSILALR (a) without a CEGV and (b) with a CEGV (W = 75 mm).
Figures 10 and 11 show the axial and radial velocities, respectively, in the TSILALR with and without a CEGV at Vg = 0.08 m·s–1. It can be seen that the differences in the axial velocity distribution in different azimuthal directions are not significant. The axial velocity distributions in different azimuthal directions are provided in Appendix A. In the TSILALR without a CEGV, the water in the first-stage riser had an upward velocity. However, the radial velocity was so small that the water from the first-stage riser directly entered the second-stage riser, then flowed down along the second-stage and first-stage downcomers, and finally returned to the first-stage riser. The global circulation around the first and second stages promoted fluid mixing between the first and the second stages. However, it eliminated the concentration gradient of the product, which adversely affects the continuous production. Global circulation occurred owing to the absence of flow resistance against the inertial force of the upward flowing fluid in the first-stage riser. Conversely, in the TSILALR with a CEGV, the radial velocity around the CEGV was relatively large. The rising water in the first-stage riser was guided to the first-stage downcomer instead of the second-stage riser, which suppressed the global circulation flow significantly. Therefore, because of the additional drag force by the CEGV, the first-stage and second-stage local circulation flows occurred simultaneously in the TSILALR instead of a global circulation around the first and second stages.
Figure 10.

Axial velocity in the TSILALR (a) without a CEGV and (b) with a CEGV (W = 75 mm).
Figure 11.

Radial velocity in the TSILALR (a) without a CEGV and (b) with a CEGV (W = 75 mm).
As shown in Figure 12, in the TSILALR without a CEGV, the turbulence kinetic energy (TKE) in the first stage was relatively small, while that in the second stage was large. A higher TKE indicates superior fluid mixing.61 The average TKE in the case without a CEGV indicated an intense mixing in the second stage, but the mixing in the first stage was insufficient. In contrast, mixing in each stage was almost realized by the local circulation in the TSILALR with a CEGV. As presented in Table 3, the average value of TKE in the first stage increased significantly in the case with a CEGV, while that in the second stage decreased. The average value of TKE in the first stage was close to that in the second stage, which indicated that the mixing performance in the two stages was similar.
Figure 12.

Turbulence kinetic energy (TKE) of the TSILALR at Vg = 0.08 m·s–1 (a) without a CEGV; (b) with a CEGV (W = 50 mm); (c) with a CEGV (W = 62 mm); (d) with a CEGV (W = 75 mm).
Table 3. Average TKE of the TSILALR at Vg = 0.08 m·s–1.
| W (mm) | TKE of the first stage (m2·s–2) | TKE of the second stage (m2·s–2) |
|---|---|---|
| without a CEGV | 0.0053 | 0.037 |
| 50 | 0.015 | 0.019 |
| 62 | 0.019 | 0.014 |
| 75 | 0.017 | 0.014 |
5.2. Gas Holdup and Bubble Circulation Regime
Figure 13 shows the variation in the global gas holdup with superficial gas velocity in the TSILALR without a CEGV. The gas holdup increased linearly when Vg increased from 0.01 to 0.06 m·s–1. With a further increase in Vg, the slope increased. The flow regime transition can be identified from the variation in αg with Vg. The homogeneous regime changed to the heterogeneous regime when the slope of αg with respect to Vg changed significantly.33 To evaluate the performance of the CEGV in both homogeneous and heterogeneous regimes, two different superficial gas velocities of 0.04 and 0.08 m·s–1 corresponding to homogeneous and heterogeneous regimes, respectively, were adopted in this work.
Figure 13.

Variation in global gas holdup with superficial gas velocity.
Three different bubble circulation regimes can be identified from the bubble penetration depth h according to the following criteria:41
-
(a)
h = 0: bubble-free regime (BFR)
-
(b)
0 < h < Hd: transition regime (TR)
-
(c)
h = Hd: complete bubble circulation regime (CBCR)
Here, Hd is the height of the draft tube.
The depth of bubble penetration into the downcomer can be estimated from Figures 14 and 15. As shown in Figure 14a, in the TSILALR without a CEGV, the bubble circulation regime of the first and second stages was BFR at Vg = 0.04 m·s–1. In Figure 14b, when Vg increased to 0.08 m·s–1, the first stage remained BFR, and the second stage entered CBCR. As shown in Figure 15, with a CEGV (W = 75 mm), the second stage was BFR at Vg = 0.04 and 0.08 m·s–1. The first stage was TR at Vg = 0.04 m·s–1; when Vg increased to 0.08 m·s–1, the first stage remained TR, but the bubble penetration depth increased. As explained by van Benthum et al.,62 in TR, the bubbles in the downcomer are static, and thus the liquid circulating velocity is equal to the slip velocity of the bubbles. As the superficial gas velocity increases, more bubbles enter the downcomer, and the balance between the liquid circulating velocity and the velocity of the bubbles is disturbed. Subsequently, a new balance is quickly established, and the gas holdup in the downcomer increases.
Figure 14.

Gas holdup of the TSILALR without a CEGV at (a) Vg = 0.04 m·s–1 and (b) Vg = 0.08 m·s–1.
Figure 15.

Gas holdup of the TSILALR with a CEGV (W = 75 mm) at (a) Vg = 0.04 m·s–1 and (b) Vg = 0.08 m·s–1.
The drag force caused by the CEGV changed the flow direction of the liquid. This promoted the formation of local circulation in the first and second stages. At Vg = 0.08 m·s–1, more bubbles entered the first-stage downcomer by local circulation, and the first stage was TR. Figure 16 illustrates that the width of the CEGV also has an effect on the transition of bubble flow regime. The first stage was TR under all operating conditions with W in the range of 50–75 mm. The second stage changed from TR to BFR when W increased. With the increase in W, more bubbles entered the first-stage downcomer, and the number of bubbles entering the second-stage riser decreased. Consequently, fewer bubbles entered the second-stage downcomer, which was demonstrated by the transition from TR to BFR in the second stage.
Figure 16.

Gas holdup of TSILALRs with a CEGV at Vg = 0.08 m·s–1: (a) W = 75 mm; (b) W = 62 mm; (c) W = 50 mm.
The difference in the gas holdup values in the riser and downcomer determines the difference in the densities in the riser and downcomer. In Table 4, five cases are presented to show the relationship between the superficial gas velocity, width of the CEGV, and the difference in gas holdup. As indicated in cases #3 and #4, the difference in gas holdup in the first stage decreased as Vg increased. Conversely, Δαg in the second stage increased with an increase in Vg. This was caused by the difference in the bubble circulation regime. In cases #3 and #4, the first stage was TR, whereas the second stage was BFR. In the BFR, bubbles did not enter the downcomer. With the increase in Vg, the gas holdup in the riser increased, while that in the downcomer did not change. Therefore, the difference in the gas holdup increased. In TR, the bubbles were dragged to the downcomer by the circulating fluid. With the increase in Vg, the gas holdup values in the riser and downcomer increased. The increase in the amplitude of αg in the downcomer was larger than that in the riser, which resulted in a decrease in the difference in gas holdup. The gas holdup values in the riser and downcomer in different cases are presented in Appendix B.
Table 4. Difference in Gas Holdup Values (Δαg) in the Riser and Downcomer.
| no. | Vg (m·s–1) | W (mm) | Δαg in the first stage | Δαg in the second stage |
|---|---|---|---|---|
| #1 | 0.08 | 50 | 0.021 | 0.060 |
| #2 | 0.08 | 62 | 0.052 | 0.050 |
| #3 | 0.04 | 75 | 0.038 | 0.042 |
| #4 | 0.08 | 75 | 0.0071 | 0.064 |
| #5 | 0.08 | without a CEGV | 0.071 | 0.024 |
Comparing cases #4 and #5, it can be seen that with a CEGV, Δαg decreased in the first stage and increased in the second stage. This was because, with the CEGV, the first stage changed from BFR to TR, and the second stage changed from CBCR to BFR. Some of the bubbles were detained in the first stage by the CEGV, resulting in an increase in αg in the first stage and a decrease in αg in the second stage. The increase in the amplitude of αg in the first-stage riser was smaller than that in the first-stage downcomer; thus, Δαg in the first stage decreased; conversely, in the second stage, αg in the downcomer decreased to approximately zero, and the decrease in the amplitude in the riser was smaller than that in the downcomer; thus, Δαg increased.
As indicated in cases #1, #2, and #4, at the same Vg, the variation in Δαg with respect to W was different for the first and second stages. With the increase in W, Δαg in the first stage increased first and then decreased; at the second stage, Δαg decreased first and then increased. This was because, with the increase in W, the first stage changed from BFR to TR, whereas the second stage changed from TR to BFR. In BFR, Δαg increased with an increase in W, whereas in TR, Δαg decreased.
As shown in Figures 17 and 18, the axial liquid velocity is affected by the width of the CEGV. In the figure, the lines with different colors correspond to different cases. For example, W-75 indicates that the width of the CEGV is 75 mm. Compared with the TSILALR without a CEGV, the axial liquid velocity decreased owing to the increase in the flow resistance caused by the CEGV. The axial liquid velocity decreased with an increase in W. The width of the CEGV influenced both the flow resistance and the difference in gas holdup. Although Δαg increased with the increase in W in BFR, which is beneficial to the increase in axial liquid velocity, the flow resistance increased simultaneously, and finally, the axial liquid velocity decreased. The effect of the flow resistance on the axial liquid velocity exceeded that of the difference in gas holdup.
Figure 17.

Axial liquid velocity of TSILALRs at Vg = 0.08 m·s–1: (a) first stage and (b) second stage.
Figure 18.

Variation in axial liquid velocity with axial height at Vg = 0.08 m·s–1: (a) riser and (b) downcomer.
Figure 18 shows the axial liquid velocity distribution in the riser and downcomer. In the riser, the axial liquid velocity in the first stage was less than that in the second stage, and it changed slightly along the axial position in the first and second stages. In the downcomer, without a CEGV, the variation in axial liquid velocity with axial position was similar to that in the riser. With a CEGV, the axial liquid velocity in the first-stage downcomer decreased first and then increased sharply with the increase in axial position. The bubble circulation regime changed from BFR to TR; thus, some bubbles entered the downcomer. The bubbles in the downcomer occupied a certain volume, and the cross-sectional area of the flow passage of the liquid phase decreased, which resulted in a sharp increase in the axial velocity. In the second-stage downcomer, the axial liquid velocity changed slightly along the axial position.
5.3. Bubble Size Distribution
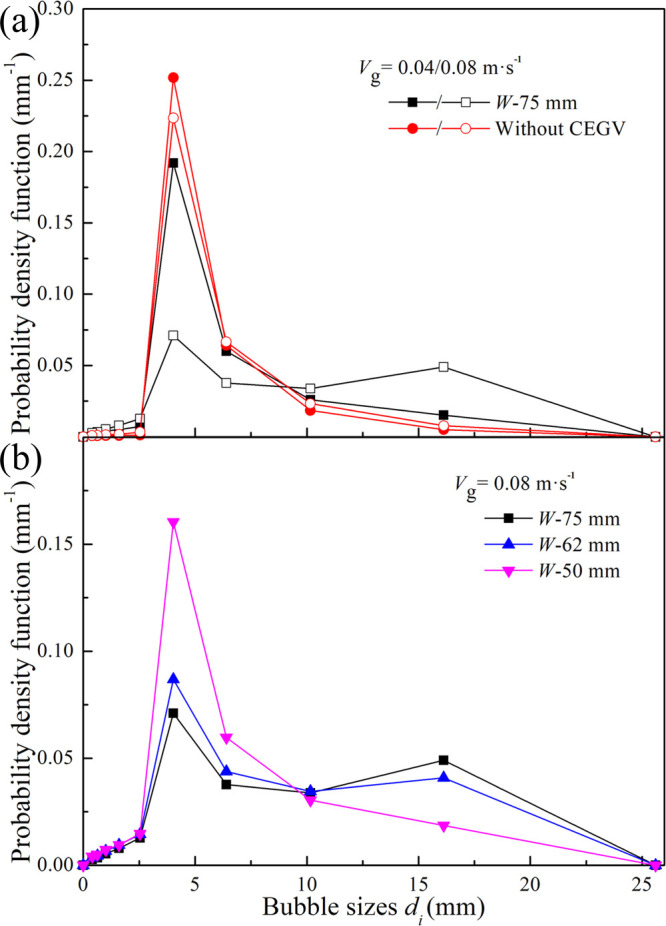
BSD is one of the main factors determining the hydrodynamic and mass transfer characteristics. Figures 19 and 20 show the local BSDs in the first and second stages of TSILALRs at different superficial gas velocities. At each stage, when Vg increased from 0.04 to 0.08 m·s–1, the fraction of large bubbles increased. As can be seen from Figure 21, with the increase in Vg, the number of large bubbles in the entire TSILALR increased, and the global BSD became wider. In homogeneous flow, the global BSD was relatively narrow, whereas in heterogeneous flow, it was very wide. The simulation results showed that, when Vg increased from 0.04 to 0.08 m·s–1, the width of BSD increased significantly, which indicated that the flow regime had changed. The transition of the flow regime indicated by the variation in BSD was consistent with the flow regime prediction in Section 4.2. In addition to superficial gas velocity, the BSD varied with the width of the CEGV. The BSD was wider, and large bubbles were dominant in the TSILALR with a CEGV. This was because the probability of coalescence of small bubbles increased when fluid flowed through the CEGV with a narrow flow passage, and as a result, the fraction of small bubbles decreased and that of large bubbles increased. In the first stage, a bimodal BSD appeared when W increased from 50 to 62 mm. In the second stage, the bimodal BSD disappeared as W increased. This is because the small bubbles were detained in the first stage because of the low rising velocity, and the large bubbles with high rising velocity entered the second stage. In the entire TSILALR, a bimodal BSD appeared when W increased from 50 to 62 mm. This is because, with the increase in W, the high gas holdup zone increased (see Figure 16), and the probability of bubble coalescence increased; thus, the number of large bubbles increased, while that of small bubbles decreased.
Figure 19.
Local BSDs of the first stage in TSILALRs: (a) with and without a CEGV at different Vg values and (b) with various CEGVs.
Figure 20.

Local BSDs of the second stage in TSILALRs: (a) with and without a CEGV at different Vg values and (b) with various CEGVs.
Figure 21.

Global BSDs of TSILALRs: (a) with and without a CEGV at different values of Vg and (b) with various CEGVs.
6. Conclusions
A CEGV was combined with a TSILALR to generate local circulation in each stage. The Euler multiphase model coupled with the PBM and RNG turbulence models was applied to predict the flow field, gas holdup, bubble circulation regime, and BSD in the TSILALRs. Experiments were conducted to validate the CFD model. The simulated values of gas holdup and local mean bubble diameter were in good agreement with the experimental values.
The simulation results indicated that the CEGV has a remarkable effect on the hydrodynamics of the TSILALR. First, two local circulations were generated in the TSILALR with a CEGV; the upward flowing fluid in the first-stage riser was guided to the first-stage downcomer by the CEGV. Similarly, in the second stage, the downward flowing fluid in the downcomer was forced to return to the riser. Owing to the local circulation, the mixing performance of the first stage improved. In a TSILALR without a CEGV, only a global circulation occurred around the first and second stages. Second, compared with the TSILALR without a CEGV, the average gas holdup values in the first and second stages in the TSILALR with a CEGV increased at the same Vg. The first stage changed to TR under all operating conditions, while the second stage remained as BFR at a low Vg, and changed to TR with increase in Vg. Third, the average value of the axial velocity in the riser decreased with the presence of the CEGV. With the increase in W, the average value of the axial velocity in the riser decreased from 0.314 to 0.241 m·s–1. Fourth, the BSD became wider with the presence of the CEGV. Moreover, with the increase in W, there was a bimodal BSD in the first stage, and the second stage became unimodal.
Acknowledgments
The authors would like to thank the financial support by the National Natural Science Foundation of China (nos. 21706182 and 21706187) and Tianjin enterprise science and technology commissioner project (19JCTPJC57500).
Glossary
Notation
- CD0
drag coefficient of single bubble (dimensionless)
- DC
hydraulic diameter of the perforated plate (m)
- dst
Sauter mean diameter (mm)
- db
bubble diameter (mm)
- Eo
Eotvos number (dimensionless)
- fi
volume fraction of the bubble with diameter dbi in the gas phase (dimensionless)
- g
gravity acceleration (m·s–2)
- Kgl
interphase turbulent drag coefficient (dimensionless)
- k
turbulent kinetic energy (m2·s–2)
- n
bubble number density (m–3)
- Pc
coalescence probability (dimensionless)
- Re
bubble Reynolds number (dimensionless)
- t
time (s)
- u
velocity vector (m·s–1)
- uij®
characteristic velocity of the collision of bubbles with diameter of dbi and dbj (m·s–1)
- Vg
superficial gas velocity (m·s–1)
- W
the width of contraction-expansion guide vane (mm)
Abbreviation
- BFR
bubble-free regime
- CBCR
complete bubble circulation regime
- CFD
computational fluid dynamics
- CEGV
contraction-expansion guide vane
- TSILALR
two-stage internal loop airlift reactor
- ILALR
internal loop airlift reactor
- PBM
population balance model
- TKE
turbulence kinetic energy (m2·s–2)
- TR
transition regime
Greek Letters
- αg
gas holdup (dimensionless)
- ε
turbulence dissipation rate (m2·s–3)
- μ
molecular dynamic viscosity (mPa·s)
- ρ
density (kg·m–3)
- σ
surface tension (N·m–1)
- θ
collision rate of the bubbles per unit volume (m–3·s–1)
- Ωb
breakup probability (dimensionless)
- Ωc
coalescence probability (dimensionless)
Subscripts
- i
the index of the bubble class
Appendix
A. Simulated Axial Velocity Distribution in Different Azimuthal Directions
The axial velocity distributions in different azimuthal directions are provided (Figure A1 and Table A1).
Figure A1.

Axial velocity in ILALRs without a CEGV in the azimuthal direction of (a) θ = 0°, (b) θ = 45°, (c) θ = 90°, and (d) θ = 135°.
Table A1. Average Axial Velocity in Different Azimuthal Directions.
| θ (°) | 0 | 45 | 90 | 135 |
|---|---|---|---|---|
| average axial velocity (m·s–1) | 0.215 | 0.210 | 0.215 | 0.248 |
B. Simulated Gas Holdups of the Riser and Downcomer in Various TSILALRs
The gas holdup values in the riser and downcomer in different cases are presented in Table A2.
Table A2. Gas Holdup of the Riser and Downcomer at the First and Second Stages in TSILALRs.
| no. | #1 | #2 | #3 | #4 | #5 |
|---|---|---|---|---|---|
| Vg (m·s–1) | 0.08 | 0.08 | 0.04 | 0.08 | 0.08 |
| W (mm) | 50 | 62 | 75 | 75 | without a CEGV |
| αg of the first-stage riser | 0.151 | 0.084 | 0.059 | 0.192 | 0.071 |
| αg of the first-stage downcomer | 0.130 | 0.032 | 0.021 | 0.185 | 0 |
| αg of the second-stage riser | 0.070 | 0.082 | 0.044 | 0.064 | 0.068 |
| αg of the second-stage downcomer | 0.010 | 0.032 | 0.002 | 0 | 0.044 |
The authors declare no competing financial interest.
References
- Roy S.; Joshi J. B. CFD study of mixing characteristics of bubble column and external loop airlift reactor. Asia-Pac. J. Chem. Eng. 2008, 3, 97–105. 10.1002/apj.122. [DOI] [Google Scholar]
- S̆imc̆ik M.; Mota A.; Ruzicka M. C.; Vicente A.; Teixeira J. CFD simulation and experimental measurement of gas holdup and liquid interstitial velocity in internal loop airlift reactor. Chem. Eng. Sci. 2011, 66, 3268–3279. 10.1016/j.ces.2011.01.059. [DOI] [Google Scholar]
- Rosa E. A. R.; Bianchini L. F.; da Silva Ramos R. C. P.; Arantes A. B.; da Silva R. F.; Glassey J. Hydrodynamics of split-rectangle-internal loop airlift bioreactor with variations in riser and downcomer cross-sectional areas based on the golden ratio. J. Chem. Technol. Biotechnol. 2019, 94, 1323–1329. 10.1002/jctb.5890. [DOI] [Google Scholar]
- Sabri L. S.; Sultan A. J.; Al-Dahhan M. H. Investigating the cross-sectional gas holdup distribution in a split internal-loop photobioreactor during microalgae culturing using a sophisticated computed tomography (CT) technique. Chem. Eng. Res. Des. 2019, 149, 13–33. 10.1016/j.cherd.2019.06.017. [DOI] [Google Scholar]
- Moraveji M. K.; Pasand M. M.; Davarnejad R.; Chisti Y. Effects of surfactants on hydrodynamics and mass transfer in a split-cylinder airlift reactor. Can. J. Chem. Eng. 2012, 90, 93–99. 10.1002/cjce.20516. [DOI] [Google Scholar]
- Prończuk M.; Bizon K. Investigation of the liquid mixing characteristic of an external-loop hybrid fluidized-bed airlift reactor. Chem. Eng. Sci. 2019, 210, 115231–115242. 10.1016/j.ces.2019.115231. [DOI] [Google Scholar]
- Fernandes B. D.; Mota A.; Ferreira A.; Dragone G.; Teixeira J. A.; Vicente A. A. Characterization of split cylinder airlift photobioreactors for efficient microalgae cultivation. Chem. Eng. Sci. 2014, 117, 445–454. 10.1016/j.ces.2014.06.043. [DOI] [Google Scholar]
- Luo H. P.; Al-Dahhan M. H. Airlift column photobioreactors for Porphyridium sp. culturing: part I. effects of hydrodynamics and reactor geometry. Biotechnol. Bioeng. 2012, 109, 932–941. 10.1002/bit.24361. [DOI] [PubMed] [Google Scholar]
- Luo H. P.; Al-Dahhan M. H. Airlift column photobioreactors for Porphyridium sp. culturing: Part II. verification of dynamic growth rate model for reactor performance evaluation. Biotechnol. Bioeng. 2012, 109, 942–949. 10.1002/bit.24362. [DOI] [PubMed] [Google Scholar]
- Li X.; Chen Y.; Zheng Z.; Gao M.; Wang Z.; Zhang K.; Liu H.; Zhan X. Power-saving airlift bioreactor with helical sieve plates: Developmental and performance studies. Chem. Eng. Res. Des. 2020, 158, 1–11. 10.1016/j.cherd.2020.03.014. [DOI] [Google Scholar]
- Luo L.; Yuan J.; Xie P.; Sun J.; Guo W. Hydrodynamics and mass transfer characteristics in an internal loop airlift reactor with sieve plates. Chem. Eng. Res. Des. 2013, 91, 2377–2388. 10.1016/j.cherd.2013.06.002. [DOI] [Google Scholar]
- Zhang X.; Guo K.; Qi W.; Zhang T.; Liu C. Gas holdup, bubble behaviour, and mass transfer characteristics in a two-stage internal loop airlift reactor with different screens. Can. J. Chem. Eng. 2017, 95, 1202–1212. 10.1002/cjce.22767. [DOI] [Google Scholar]
- Zheng Z.; Chen Y.; Zhan X.; Gao M.; Wang Z. Mass transfer intensification in a novel airlift reactor assembly with helical sieve plates. Chem. Eng. J. 2018, 342, 61–70. 10.1016/j.cej.2018.01.039. [DOI] [Google Scholar]
- Ojha A.; Al-Dahhan M. Local gas holdup and bubble dynamics investigation during microalgae culturing in a split airlift photobioreactor. Chem. Eng. Sci. 2018, 175, 185–198. 10.1016/j.ces.2017.08.026. [DOI] [Google Scholar]
- Albdiri A. D. Z.; Ojha A.; Al-Dahhan M. Study of Local Gas Holdup and Specific Interfacial Area in a Split-Column Airlift Bioreactor Using Sphosticated 4-Point Optical Probe for Culturing Microlgae/Cyanobacteria. Chem. Eng. Commun. 2014, 202, 892–898. [Google Scholar]
- Ojha A.; Al Dahhan M. Investigation of local gas holdup and bubble dynamics using four-point optical probe technique in a split-cylinder airlift reactor. Int. J. Multiphase Flow 2018, 102, 1–15. 10.1016/j.ijmultiphaseflow.2017.12.001. [DOI] [Google Scholar]
- Luo H.-P.; Al-Dahhan M. H. Local gas holdup in a draft tube airlift bioreactor. Chem. Eng. Sci. 2010, 65, 4503–4510. 10.1016/j.ces.2010.04.037. [DOI] [Google Scholar]
- Luo H.-P.; Al-Dahhan M. H. Local characteristics of hydrodynamics in draft tube airlift bioreactor. Chem. Eng. Sci. 2008, 63, 3057–3068. 10.1016/j.ces.2008.03.015. [DOI] [Google Scholar]
- Yang T.; Geng S.; Yang C.; Huang Q. Hydrodynamics and mass transfer in an internal airlift slurry reactor for process intensification. Chem. Eng. Sci. 2018, 184, 126–133. 10.1016/j.ces.2018.03.040. [DOI] [Google Scholar]
- Jourdan N.; Neveux T.; Potier O.; Kanniche M.; Wicks J.; Nopens I.; Rehman U.; Le Moullec Y. Compartmental Modelling in chemical engineering: A critical review. Chem. Eng. Sci. 2019, 210, 115196–115206. 10.1016/j.ces.2019.115196. [DOI] [Google Scholar]
- Liao Y.; Lucas D. A literature review of theoretical models for drop and bubble breakup in turbulent dispersions. Chem. Eng. Sci. 2009, 64, 3389–3406. 10.1016/j.ces.2009.04.026. [DOI] [Google Scholar]
- Luo H.-P.; Al-Dahhan M. H. Verification and validation of CFD simulations for local flow dynamics in a draft tube airlift bioreactor. Chem. Eng. Sci. 2011, 66, 907–923. 10.1016/j.ces.2010.11.038. [DOI] [Google Scholar]
- Chen P.; Sanyal J.; Duduković M. P. Numerical simulation of bubble columns flows: effect of different breakup and coalescence closures. Chem. Eng. Sci. 2005, 60, 1085–1101. 10.1016/j.ces.2004.09.070. [DOI] [Google Scholar]
- Xu T.; Jiang X.; Yang N.; Zhu J. CFD simulation of internal-loop airlift reactor using EMMS drag model. Particuology. 2015, 19, 124–132. 10.1016/j.partic.2014.04.016. [DOI] [Google Scholar]
- Hibiki T.; Ishii M. Interfacial area concentration in steady fully-developed bubbly flow. Int. J. Heat Mass Transfer 2001, 44, 3443–3461. 10.1016/S0017-9310(00)00365-3. [DOI] [Google Scholar]
- Wadaugsorn K.; Limtrakul S.; Vatanatham T.; Ramachandran P. A. Hydrodynamic behaviors and mixing characteristics in an internal loop airlift reactor based on CFD simulation. Chem. Eng. Res. Des. 2016, 113, 125–139. 10.1016/j.cherd.2016.07.017. [DOI] [Google Scholar]
- Huang Q.; Zhang W.; Yang C. Modeling transport phenomena and reactions in a pilot slurry airlift loop reactor for direct coal liquefaction. Chem. Eng. Sci. 2015, 135, 441–451. 10.1016/j.ces.2015.01.003. [DOI] [Google Scholar]
- Krishna R.; van Baten J. M.; Urseanu M. I. Three-phase Eulerian simulations of bubble column reactors operating in the churn-turbulent regime: a scale up strategy. Chem. Eng. Sci. 2000, 55, 3275–3286. 10.1016/S0009-2509(99)00582-5. [DOI] [Google Scholar]
- Kostoglou M.; Dovas S.; Karabelas A. J. On the steady state-size distribution of dispersions in breakage processes. Chem. Eng. Sci. 1997, 52, 1285–1299. 10.1016/S0009-2509(96)00488-5. [DOI] [Google Scholar]
- Colella D.; Vinci D.; Bagatin R.; Masi M.; ABu Bakr E. A study on coalescence and breakage mechanisms in three different bubble columns. Chem. Eng. Sci. 1999, 54, 4767–4777. 10.1016/S0009-2509(99)00193-1. [DOI] [Google Scholar]
- Wang T.; Wang J. Numerical simulations of gas–liquid mass transfer in bubble columns with a CFD–PBM coupled model. Chem. Eng. Sci. 2007, 62, 7107–7118. 10.1016/j.ces.2007.08.033. [DOI] [Google Scholar]
- Wang T.; Wang J.; Jin Y. A CFD-PBM coupled model for gas-liquid flows. AIChE J. 2006, 52, 125–140. 10.1002/aic.10611. [DOI] [Google Scholar]
- Wang T.; Wang J.; Jin Y. Theoretical prediction of flow regime transition in bubble columns by the population balance model. Chem. Eng. Sci. 2005, 60, 6199–6209. 10.1016/j.ces.2005.04.027. [DOI] [Google Scholar]
- Silva M. K.; d’Ávila M. A.; Mori M. CFD modelling of a bubble column with an external loop in the heterogeneous regime. Can. J. Chem. Eng. 2011, 89, 671–681. 10.1002/cjce.20417. [DOI] [Google Scholar]
- Yang G.; Guo K.; Wang T. Numerical simulation of the bubble column at elevated pressure with a CFD-PBM coupled model. Chem. Eng. Sci. 2017, 170, 251–262. 10.1016/j.ces.2017.01.013. [DOI] [Google Scholar]
- Shi W.; Yang J.; Li G.; Zong Y.; Yang X. Computational Fluid Dynamics–Population Balance Modeling of Gas–Liquid Two-Phase Flow in Bubble Column Reactors With an Improved Breakup Kernel Accounting for Bubble Shape Variations. Heat Transfer Eng. 2019, 1414–1430. [Google Scholar]
- Xing C.; Wang T.; Wang J. Experimental study and numerical simulation with a coupled CFD–PBM model of the effect of liquid viscosity in a bubble column. Chem. Eng. Sci. 2013, 95, 313–322. 10.1016/j.ces.2013.03.022. [DOI] [Google Scholar]
- Guo K.; Wang T.; Liu Y.; Wang J. CFD-PBM simulations of a bubble column with different liquid properties. Chem. Eng. J. 2017, 329, 116–127. 10.1016/j.cej.2017.04.071. [DOI] [Google Scholar]
- Zhang X.-B.; Yan W.-C.; Luo Z.-H. Numerical simulation of local bubble size distribution in bubble columns operated at heterogeneous regime. Chem. Eng. Sci. 2020, 116266. 10.1016/j.ces.2020.116266. [DOI] [Google Scholar]
- Mohanty K.; Das D.; Biswas M. N. Hydrodynamics of a novel multi-stage external loop airlift reactor. Chem. Eng. Sci. 2006, 61, 4617–4624. 10.1016/j.ces.2006.02.017. [DOI] [Google Scholar]
- Li D.; Guo K.; Li J.; Huang Y.; Zhou J.; Liu H.; Liu C. Hydrodynamics and bubble behaviour in a three-phase two-stage internal loop airlift reactor. Chin. J. Chem. Eng. 2018, 26, 1359–1369. 10.1016/j.cjche.2018.03.020. [DOI] [Google Scholar]
- Chen Z. B.; He Z. W.; Tang C. C.; Hu D. X.; Cui Y. B.; Wang A. J.; Zhang Y.; Yan L. L.; Ren N. Q. Performance and model of a novel multi-sparger multi-stage airlift loop membrane bioreactor to treat high-strength 7-ACA pharmaceutical wastewater: effect of hydraulic retention time, temperature and pH. Bioresour. Technol. 2014, 167, 241–250. 10.1016/j.biortech.2014.05.108. [DOI] [PubMed] [Google Scholar]
- Tao J.; Huang J.; Geng S.; Gao F.; He T.; Huang Q. Experimental investigation of hydrodynamics and mass transfer in a slurry multistage internal airlift loop reactor. Chem. Eng. J. 2020, 386, 122769–122778. 10.1016/j.cej.2019.122769. [DOI] [Google Scholar]
- Yu W.; Wang T.; Liu M.; Wang Z. Liquid backmixing and particle distribution in a novel multistage internal-loop airlift slurry reactor. Ind. Eng. Chem. Res. 2008, 47, 3974–3982. 10.1021/ie071100h. [DOI] [Google Scholar]
- Yu W.; Wang T.; Liu M.; Song F. Investigation of Operation Regimes in a Multistage Internal-Loop Airlift Reactor. Ind. Eng. Chem. Res. 2010, 49, 11752–11759. 10.1021/ie100746z. [DOI] [Google Scholar]
- Yu W.; Wang T. F.; Song F. F.; Wang Z. W. Investigation of the Gas Layer Height in a Multistage Internal-Loop Airlift Reactor. Ind. Eng. Chem. Res. 2009, 48, 9278–9285. 10.1021/ie9002156. [DOI] [Google Scholar]
- Laborde-Boutet C.; Larachi F.; Dromard N.; Delsart O.; Schweich D. CFD simulation of bubble column flows: Investigations on turbulence models in RANS approach. Chem. Eng. Sci. 2009, 64, 4399–4413. 10.1016/j.ces.2009.07.009. [DOI] [Google Scholar]
- Sokolichin A.; Eigenberger G. Gas-liquid flow in bubble columns and loop reactors Part I. Detailed modelling and numerical simulation. Chem. Eng. Sci. 1994, 49, 5735–5746. 10.1016/0009-2509(94)00289-4. [DOI] [Google Scholar]
- Tomiyama A.; Kataoka I.; Zun I.; Sakaguchi T. Drag Coefficients of Single Bubbles under Normal and Micro Gravity Conditions. JSME Int. J., Ser. B 1998, 41, 472–479. 10.1299/jsmeb.41.472. [DOI] [Google Scholar]
- Yang G.; Zhang H.; Luo J.; Wang T. Drag force of bubble swarms and numerical simulations of a bubble column with a CFD-PBM coupled model. Chem. Eng. Sci. 2018, 192, 714–724. 10.1016/j.ces.2018.07.012. [DOI] [Google Scholar]
- Roghair I.; Van Sint Annaland M.; Kuipers H. J. A. M. Drag force and clustering in bubble swarms. AIChE J. 2013, 59, 1791–1800. 10.1002/aic.13949. [DOI] [Google Scholar]
- Zhang X.-B.; Zheng R.-Q.; Luo Z.-H. CFD-PBM simulation of bubble columns: Effect of parameters in the class method for solving PBEs. Chem. Eng. Sci. 2020, 226, 115853–115867. 10.1016/j.ces.2020.115853. [DOI] [Google Scholar]
- Huang Q.; Yang C.; Yu G.; Mao Z.-S. CFD simulation of hydrodynamics and mass transfer in an internal airlift loop reactor using a steady two-fluid model. Chem. Eng. Sci. 2010, 65, 5527–5536. 10.1016/j.ces.2010.07.021. [DOI] [Google Scholar]
- Jiang X.; Yang N.; Yang B. Computational fluid dynamics simulation of hydrodynamics in the riser of an external loop airlift reactor. Particuology. 2016, 27, 95–101. 10.1016/j.partic.2015.05.011. [DOI] [Google Scholar]
- Luo H.; Svendsen H. F. Theoretical model for drop and bubble breakup in turbulent dispersions. AIChE J. 1996, 42, 1225–1233. 10.1002/aic.690420505. [DOI] [Google Scholar]
- Luo H., Coalescence, Breakup and Liquid Circulation in Bubble Column Reactors, PhD, Norwegian institute of technology, Norwegian, 1993.
- Chen P.; Dudukovi M. P.; Sanyal J. Three-dimensional simulation of bubble column flows with bubble coalescence and breakup. AIChE J. 2005, 51, 696–712. 10.1002/aic.10381. [DOI] [Google Scholar]
- Hounslow M. J.; Ryall R. L.; Marshall V. R. A discretized population balance for nucleation, growth, and aggregation. AIChE J. 1988, 34, 1821–1832. 10.1002/aic.690341108. [DOI] [Google Scholar]
- Shi W.; Yang N.; Yang X. A kinetic inlet model for CFD simulation of large-scale bubble columns. Chem. Eng. Sci. 2017, 158, 108–116. 10.1016/j.ces.2016.10.005. [DOI] [Google Scholar]
- Miyahara T.; Matsuba Y.; Takahashi T. Size of Bubbles Generated from Perforated Plates. Int. J. Chem. Eng. 1983, 23, 13–17. [Google Scholar]
- Xu L.; Liu R.; Wang F.; Liu C. Z. Development of a draft-tube airlift bioreactor for Botryococcus braunii with an optimized inner structure using computational fluid dynamics. Bioresour. Technol. 2012, 119, 300–305. 10.1016/j.biortech.2012.05.123. [DOI] [PubMed] [Google Scholar]
- van Benthum W. A. J.; van der Lans R. G. J. M.; van Loosdrecht M. C. M.; Heijnen J. J. Bubble recirculation regimes in an internal-loop airlift reactor. Chem. Eng. Sci. 1999, 54, 3995–4006. 10.1016/S0009-2509(99)00097-4. [DOI] [Google Scholar]