Abstract
The electroencephalography (EEG) has become increasingly valuable outside of its traditional use in neurology for neuropsychiatric diagnosis, neurological evaluation of traumatic brain injury, neurotherapy, gaming, neurofeedback, mindfulness and cognitive enhancement training. The trend to increase the number of EEG electrodes, the development of novel analytical methods and the availability of large datasets has created a data analysis challenge to find the “signal of interest” that conveys the most information about ongoing cognitive effort. Accordingly, we compare three common types of neural synchrony measures that are applied to EEG - power analysis, phase locking and phase-amplitude coupling to assess which analytical measure provides the best separation between EEG signals that were recorded while healthy subjects performed eight cognitive tasks - Hopkins Verbal Learning Test and its delayed version, Stroop Test, Symbol Digit Modality Test, Controlled Oral Word Association Test, Trail Marking Test, Digit Span Test and Benton Visual Retention Test. We find that of the three analytical methods, phase-amplitude coupling, specifically theta (4–7 Hz) – high gamma (70–90 Hz) obtained from frontal and parietal EEG electrodes provides both the largest separation between EEG during cognitive tasks and also the highest classification accuracy between pairs of tasks. We also find that phase-locking analysis provides the most distinct clustering of tasks based on their utilization of long-term memory. Finally, we show that phase-amplitude coupling is the least sensitive to contamination by intense jaw-clenching muscle artifact.
Index Terms: electroencephalography, cognition, synchrony, cognition, muscle artifact
I. Introduction
Electroencephalography (EEG) is receiving increased interest because it is a readily accessible non-invasive tool for assessing brain function with extraordinary temporal resolution that is practically on the scale of milliseconds [1]. The use of EEG is now extending from the traditional application in neurological diagnosis to psychiatric diagnosis [2], neurological evaluation of traumatic brain injury [3], neurotherapy [4] and brain-machine interface applications [5]. During the last two decades, EEG devices have reduced substantially in their size and cost, mainly due to the availability of commercial multichannel analog front-end integrated circuits, which have significantly reduced the skill, time, and cost needed to develop a new EEG device [6]. New headsets with new types of electrodes, coupled with innovations in analog and digital electronic design have also converged to substantially simplify the EEG setup which has also contributed to making high quality EEG technology more accessible for both clinical and experimental applications [7], [8]. Indeed, there has been a recent proliferation of inexpensive EEG devices and systems designed for non-clinical use and a simple internet search will turn up many claims that EEG is capable of assessing and tracking brain function for widely-varying applications that include gaming, neurofeedback for pain, trauma, and wellness management, also management of cannabis use, mindfulness and cognitive enhancement training, to cite a few [9]–[11].
Advances in EEG hardware also require advancements in EEG analysis tools and algorithms, which too is experiencing substantial growth, much of it pioneered in the use of novel analyses of intracranial local field potential signals that underlie the scalp EEG [12]–[14]. Despite the advances, answers to one of the most fundamental and crucial questions remain uncertain – what are the signals of interest in the EEG for classifying diverse cognitive efforts; should classification and decoding focus on information theory measures, spectral power, synchrony, or some combination? Whatever the answer, it will dictate what EEG electrodes, active electronic hardware, and operating characteristics are to be used for EEG data collection as well as dictate which EEG analyses convey the most information about the functional state of the brain. Intuitively, one might argue that more is better and therefore the highest number of electrodes combined with the most sophisticated data analysis will provide the most information. Despite the intuitive appeal of “more is better,” it is not generally true as there are also several drawbacks with this approach. First, a large number of recording channels increases the dimensionality a.k.a. the “curse of dimensionality” [15] of the data and therefore introduces problems with dimensionality reduction and feature selection [16]. There is no point in increasing the number of data samples if the information is redundant. Second, more electrodes require more time to setup, as well as might require more complex data fidelity monitoring such as impedance checking. Third, portable systems and personal computing systems rely on battery power and therefore heavy processing can significantly reduce battery life, and the practical duration of EEG recordings if data logging and the bandwidth of data collection capacity are issues, when real-time analysis and/or portable applications are the target. Finally, EEG has traditionally ignored fast frequencies in the 30–100 Hz gamma band and in fact signals above 70 Hz are standardly filtered out by the hardware and so not collected because muscle activity generates contaminating signals in this frequency range [17], whereas intrinsic gamma band brain signals carry substantial information about fundamental neural dynamics [18] and internally generated cognitive events [19], [20]. It is consequently of substantial importance to investigate gamma frequency components of the EEG that are decisively not of muscle or other extra-cerebral origin.
What indeed are the signals of interest in the EEG? Here we investigate this question as it pertains to the brain states that generate distinct cognitive abilities. Previously, EEG classification of brain states using spectral properties was used to identify alertness [21] and mental fatigue [22]. Theta and alpha oscillations recorded from scalp have been positively correlated with ability to encode new information and long-term semantic memory performance, respectively [23]. Furthermore, activity in the theta band was associated with working memory maintenance, where theta power parametrically increases with number of items held in the working memory [24], [for review see 25]. Increased gamma band activity compared to baseline was observed in expectancy, learning, reading and subtraction tasks [26].
Instead of blindly searching for the best analytical method for EEG classification from the myriads of available choices, we decided to follow a theory-driven approach and instead focused on specific measures of synchrony, which are directly linked to theories of brain function and cortical computation. The “communication by coherence” hypothesis [27] proposes that neural synchrony allows flexible cortical organization and communication by precise temporal synchronization of spiking of excitatory neurons. This form of synchronization can be observed both locally as increased oscillatory activity and globally as an increase in long-range phase synchronization of neural oscillations [28]. A special case of synchrony –cross-frequency coupling, which occurs between slow and fast neural oscillations has been proposed to play a role in the segmentation of information where fast oscillations, modulated by the phase of slow oscillations provide “time slots” for different types of neuronal representations involved in neural computation [29]. Following those theoretical frameworks, we investigated the discriminative ability of three classes of synchrony measures: 1) the power in the traditionally-defined frequency bands, corresponding to local synchronization, 2) the band-specific phase synchronization between electrode sites, corresponding to long-range synchronization and 3) the cross-frequency coupling between the phases of slower oscillations and the amplitude of faster oscillations at each electrode site. The goal of the current investigation is to determine what signals in the EEG best discriminate the different tasks, presumed to depend on different states of brain function.
II. Materials and Methods
A. Subjects and Experimental Design
The studies were approved by the NYU Institutional Review Board, and written informed consent was obtained from all the volunteer subjects. There were 92 subjects recruited from the NYU student population. The average age was 22.2 ± 4.0 years and 56 subjects were female. The EEGs were acquired as a part of a study of the effect of exercise on cognitive functions and the behavioral results have been published [30]. The present study examined EEG recordings from the subjects in the pre-intervention condition. Each subject was asked to perform standard neuropsychological tests while EEG was recorded in otherwise constant conditions, generating a database of EEGs collected during distinctive cognitive tasks. The key assumption was that because the different cognitive tasks require different brain functions the EEG features during the different tasks would differ. The extent to which information in the EEG can distinguish which EEG was from which task provides a basis upon which to judge what information from the EEG is most useful for discriminating the task. The beginning and end of each cognitive task was recorded as an key-press event and stored together with the EEG data. EEG was acquired using a commercial, easy-to-use FDA-approved wireless, wearable, 24-channel EEG system (microEEG®, Bio-Signal Group Corp., MA, USA; [7], [8] connected to the Electro-cap (Eaton, Ohio, USA) headset with 16 recorded electrodes in standard 10–20 electrode placement, without extraocular electrodes (Fig. 1A). EEG was sampled at 250 Hz, transmitted to a laptop computer using a Bluetooth wireless protocol and stored for offline analysis. All signals were referenced to the Cz electrode with system ground connected to the Fpz electrode. Impedance was continuously monitored during data acquisition, and lowered as necessary. Each recording lasted 50 minutes on average.
Fig. 1.
Fundamental data collection and analysis. (A) Example EEG traces from 16 scalp electrodes while a subject was sitting still with eyes closed (BASE, black) or performing the Hopkins Verbal Learning Test (HVLT, red). (B) Example power spectrum (O1 electrode) is shown for BASE (black) and HVLT (red) with the five bands of interest outlined in blue (theta, alpha, beta, low gamma and high gamma). (C) Example PLV (between O1–O2 electrode pair) with five bands of interest outlined in blue. (D) Example PAC comodulogram (O1 electrode) computed for the full range of frequencies with the five combinations of slow and fast frequencies used for PAC estimation (left: alpha-low gamma, alpha-high gamma; right: theta-beta, theta-low gamma, theta-high gamma; white rectangles). Note the overlap in the beta and low gamma frequency ranges for PAC analysis, which occur because the amplitude filters are 20 Hz wide and beta is defined as 15–35 Hz and low gamma as 30–50 Hz.
EEG was preprocessed using a custom artifact rejection algorithm, which excluded segments of the signal with extremely low variance (slow-changing signals during impedance measurements) or extremely high variance (high amplitude artifacts caused by movement or excessive muscle activity). The variance threshold was set manually based on the visual observation of EEG signals. Ocular artifacts were identified using two methods based on independent component analysis (ICA). The component rejection method used manual identification of ICA activations with the strongest ocular artifacts and excluded these components before projecting the data back to the original space. The epoch rejection method used ICA activations only to identify moments of ocular artifacts using a manually set threshold, we then excluded those time segments from the analyzed data. For all analyses, EEG features were independently z-score normalized, to exclude amplitude differences due to variation between individuals and electrode placement.
B. Neuropsychological Tests
We recorded the scalp EEG from healthy undergraduate volunteers as they performed a series of neuropsychological tests, selected to assess a range of functions believed to be critically reliant on activity of either the prefrontal cortex or the hippocampus. The EEG of each subject was recorded in either a standard conference room or classroom, while the subject performed eight cognitive tasks as well as during a baseline recording. Each subject performed the tasks in the same order. Standard precautions to limit external noise sources and disturbances were taken although the goal was to simulate a real-world environment, rather than tightly controlled laboratory settings. During the baseline recording, the subjects were sitting still with eyes closed. In the Hopkins Verbal Learning Test [HVLT; 31] of verbal short-term memory, subjects had to recall and say as many words they can after the list of words was read to them. In the delayed version of the HVLT task (DHVLT), to assess short-term verbal memory recall across a delay, approximately 20 min later, at the end of the testing session, the subjects had to recall as many words as possible from the original HVLT list. During the Stroop Test [ST; 32] of cognitive control, subjects first had to read a list of words printed on paper in black ink. Next, the subjects went through a list of “XXXX’s” and reported each color. Finally, they went through a list of words printed in colored ink but were only to report the color of the letters and ignore the meaning of the word. In the Symbol Digit Modality Test [SDT; 33] to assess overall cognitive function including divided visual attention, the subject has to rapidly learn and match symbol-number pairs by drawing on paper. In the Controlled Oral Word Association Test [COWAT; 34] to assess verbal fluency, the subject is given a letter and told to say as many words as possible that start with the letter. In the Trail Marking Test [TMT; 35] that assesses mental flexibility and executive function, the subject uses a pen to connect randomly placed numbers on a paper with a line so they would form a monotonically increasing sequence (numeric and alphanumeric versions were used). In the Digit Span Test [DST; 36] that assesses short-term memory, the subject is told to repeat lists of numbers both in a forward and then backward direction. In the Benton Visual Retention Test [MODBENT; 37] to assess visual perception and memory, the subject must select using a computer mouse which out of four figure designs best matches the one s/he had seen before. All neuropsychological tests were administered during comparable periods of time (HVLT: 153 ± 92s, ST: 241 ± 39s, SDT: 192 ± 37s, COWAT: 251 ± 25s, TMT: 203 ± 63s, DST: 242 ± 60s, DHVLT: 97 ± 22, MODBENT 967 ± 107s) with baseline being recorded for 678 ± 384s.
C. Measures of EEG Synchrony for Classification
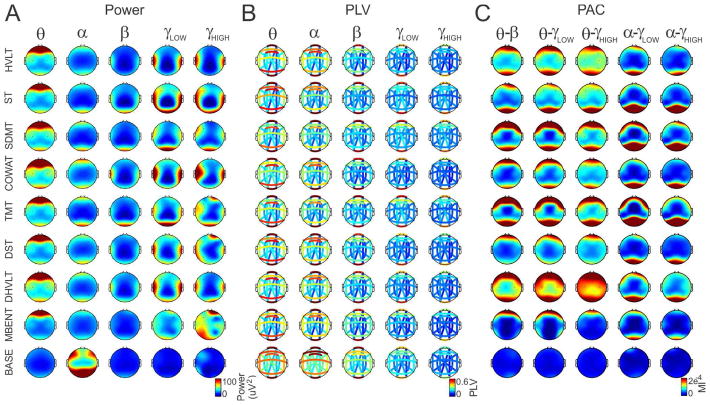
EEG was quantified using three measures of synchrony. The power spectrum (Fig. 1B), is perhaps the most standard EEG analysis and measures local amplitude synchrony resulting from local synchronized post-synaptic potentials. Instantaneous power was computed by convolving the EEG signal with a group of complex Morlet wavelets [38] in the range of 2–100 Hz with step of 1 Hz and squaring the result. The Morlet wavelet is defined as , with f0 denoting the center frequency and σt and σ f denoting standard deviation in the time and frequency domains, respectively, where σf = 1/2πσt. Normalization factor ensures that the total wavelet energy is 1, and practically [38]. POWER estimates were then averaged for each of 16 EEG channels in 5 bands of interest – theta (4–7 Hz) [23], alpha (9–12 Hz) [23], beta (15–25 Hz) [39], low gamma (30–50 Hz) and high gamma (70–90 Hz) [40] leading to a total of 80 power estimates for each subject and cognitive task (Fig. 2A).
Fig. 2.
The task-specific EEG dataset. Across-subject averages of activity vectors during eight cognitive tasks and baseline. (A) Power was computed at 16 electrode sites and 5 EEG bands (theta, alpha, beta, low gamma and high gamma). (B) PLV was calculated for 16 pairs of electrodes and 5 EEG bands (theta, alpha, beta, low gamma and high gamma). (C) PAC was computed for 16 electrodes and 5 cross-frequency interactions (theta-beta, theta-low gamma, theta-high gamma, alpha-low gamma and alpha-high gamma).
Phase locking value (PLV; Fig. 1C) [41] is a measure of non-local phase synchrony independent of amplitude synchrony. PLV was computed between a pair of electrodes to estimate inter-area phase synchrony. Here we estimated PLV between three classes of electrode pairs – intra-hemispheric synchrony (F7–T5, F3–P3, F4–P4, F8–T6, Fp1-O1, Fp2-O2), symmetric inter-hemispheric synchrony (Fp1-Fp2, F7–F8, F3–F4, T3–T4, T5–T6, O1–O2) and asymmetric inter-hemispheric synchrony (Fp1-O2, Fp2-O1, F7–T6, F8–T5). Instantaneous phase was computed by filtering a pair of EEG signals using band-pass FIR filters designed using Matlab ‘fdesign’ function using Kaiser window with 3-Hz bandwidth, 40 dB attenuation and 2 Hz transition band in the range 4–91 Hz and taking an argument of a Hilbert-transformed band-pass filtered signal. The PLV value was calculated as , where t corresponds to time samples, j is the imaginary unit, T is the total length of the signal in samples, and φ1 (t) – φ2 (t) corresponds to the instantaneous phase difference between the two signals. The band-specific phase locking value was then extracted for theta using the 4–7 Hz band, alpha using the 9–12 Hz band, beta by averaging PLV values of 3 Hz wide bands within the range 15–30 Hz, low gamma by averaging PLV values in the 30–48 Hz range and high gamma by averaging PLV values in the 70–91 Hz range. The combination of 16 measures of synchrony and 5 bands of interest also lead to 80 PLV estimates for each subject and cognitive task (Fig. 2B).
Weighted phase lag index (WPLI) [13] was used as an alternative measure of phase synchrony because of its lower sensitivity to volume conduction. We used FieldTrip [42] implementation of debiased WPLI using 5-second long window and 9 tapers. Obtained WPLI estimates were averaged across same bands as used for PLV.
Phase-amplitude coupling (PAC; Fig. 1D) [12], [43] is a measure of synchronization between the phase of low frequency oscillations (theta or alpha) and the amplitude of high frequency oscillations (beta, low gamma or high gamma). PAC provides an estimate of local cross-frequency synchrony between frequency bands that are believed to have distinctive biophysical origins [18]. Phases of low frequency oscillations were extracted using two band-pass FIR filters with 3-Hz bandwidth either at the theta (4–7 Hz) or alpha (9–12 Hz) bands followed by the Hilbert transform. Amplitudes of high frequency oscillations were computed using three band-pass FIR filters with 20-Hz bandwidth either in beta (15–35 Hz), low gamma (30–50 Hz) or high gamma (70–90 Hz) followed by the Hilbert transform. All FIR filters were designed using Matlab ‘fdesign’ function using Kaiser window with 40 dB attenuation and 2 Hz transition band. The use of narrow-band filters for estimating modulatory phase and wide-band filters for estimating the modulated amplitude is crucial for unbiased PAC estimation [14]. The measure of PAC, the modulation index (MI), was computed as the Kullback-Leibler divergence (KLD) between the phase-amplitude distribution obtained from band-pass filtered signals and a uniform distribution [12]. PAC was estimated for all 16 electrodes and 5 combinations of bands (theta-beta, theta-low gamma, theta-high gamma, alpha-low gamma, alpha-high gamma; Fig. 1D), leading to the total of 80 PAC estimates for each subject and cognitive task (Fig. 2C).
Support vector machine classification was performed using the LIBSVM library [44]. In order to set parameters for the support vector machine, we used a parametric grid search combined with 5-fold cross-validation applied to the entire dataset (POWER + PLV + PAC features). The accuracy of classification was then tested separately for each pair of tasks and for each individual analysis type (POWER, PLV and PAC) as well as for their combination (POWER+PLV+PAC). Each classifier was first trained on a randomly selected 75% sample of the data and then tested on the remaining 25% of the data in order to estimate classification accuracy. Training and classification was repeated 10 times and the accuracy results were averaged.
Principal component and clustering analyses were performed using JMP (Cary, NC, USA) statistical software. All other analyses were performed using custom written Matlab (Natick, MA, USA) software.
III. Results
A. PAC Provides the Largest Discrimination Between Tasks
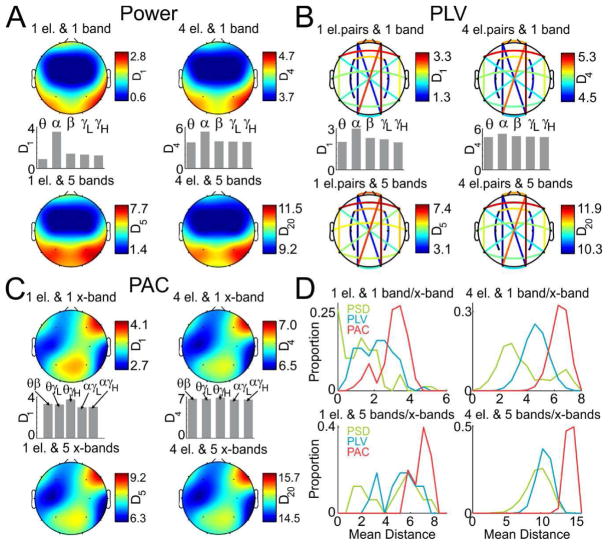
We first asked which combinations of electrodes or electrode pairs, EEG bands or x-bands (cross-frequency bands used in PAC estimation, e.g. theta-beta) and analytical measures provide the largest overall discrimination of all tasks. Because numerous commercial applications are limited to the use of minimal EEG electrode montages and limited computing power for real-time feedback, we examined the discriminative power of small numbers of electrodes or electrode pairs (used in PLV estimates, e.g. O1–O2) and frequency bands or x-bands. We selected all possible combinations of 1 electrode/electrode pair and 1 band/x-band, 1 electrode/electrode pair and 5 bands/x-bands, 4 electrodes/electrode pairs and 1 band/x-band and 4 electrodes/electrode pairs and 5 bands/x-bands and computed the average Euclidean distance between all tasks for the power (Fig. 2A), PLV (Fig. 2B) and PAC (Fig. 2C) analytical measures. These results are presented as a heat map interpolated over a head schematic for power and PAC measures and color connections of electrode pairs in order to demonstrate which electrodes/electrode pairs provide for the largest discrimination. For combinations where only 1 band/x-band was selected, we also computed the average Euclidean distance for each band to see which band provides the largest discrimination. Additionally, we present distances between tasks as histograms for all electrode and bands/x-bands combinations (Fig. 3D). A summary of the electrodes/electrode pairs and bands that provide the best discrimination for a given analysis is provided in Table 1.
Fig. 3.
Discrimination using minimal montages and frequency bands. (A) Average Euclidean distance computed between the EEGs during all pairs of tasks using only the power data for all combinations of 1 electrode and 1 band (top, left), 1 electrode and 5 bands (bottom, left), 4 electrodes and 1 band (top, right) and 4 electrodes and 5 bands (bottom, right). The average distance for 5 bands of interest is shown for both options where only 1 band is selected. (B) Same as A, but for PLV (electrode pairs are used in PLV analysis instead of individual electrodes). (C) Same as B, but for PAC (cross-frequency bands x-bands are used in PAC analysis instead of regular frequency bands). (D) Histograms of distances between pairs of tasks for all combinations of electrodes and bands/x-bands.
TABLE I.
Summary of Electrodes/Electrode Pairs and Bands/x-Bands With the Best Discrimination. Summary of the Best 4 Electrodes/Electrode Pairs That Provide the Best Overall Discrimination of All Tasks When 1 Electrode and 1 Band/x-Band, 1 Electrode/Electrode Pair and 5 Bands/x-Bands, 4 Electrodes/Electrode Pairs and 1 Band/x-Band and 4 Electrodes/Electrode Pairs and 5 Bands/x-Bands Are Selected Using the Power, PLV and PAC Measures. For Combinations Where Only a Single Band/x-Band Was Used we Also Provided in Parenthesis the Frequency Band/x-Band, Which Provided the Largest Average Discrimination
| 1 electrode 1 band/x-band | 1 electrode 5 bands/x-bands | 4 electrodes 1 band/x-band | 4 electrodes 5 bands/x-bands | |
|---|---|---|---|---|
| POWER | T6, T4, T5, 01 (α) | T6, P4, T5, P3 | T6, T5, T4, P4 (α) | T6, P4, T5, P3 |
| PLV | Fp2-02, F7–F8, Fp2-01, Fp1-Fp2 (α) | Fp2-02, F7–F8, Fp2-01, Fp1-Fp2 | Fp2-02, F7–F8, Fp2-01, Fp1-Fp2 (α) | Fp2-02, F7–F8, Fp2-01, Fp1-Fp2 |
| PAC | F8, F4, P4, F7 (θ-γH) | F8, F4, P4, F7 | F8, F4, P4, F7 (θ-γH] | F8, F4, P4, F7 |
POWER (Fig. 2A, 3A) provides the lowest inter-task discrimination of the three analytical measures. When one electrode and one band are selected for the power analysis (Fig. 3A, top left), the largest discrimination is obtained with the temporal (T6, T4 and T5) and occipital (O1) electrodes in the alpha band (Fig. 3A middle, left). When a single electrode but all five bands are selected for the power analysis (Fig. 3A bottom, left), the best discrimination is provided by a symmetric combination of temporal (T6 and T5) and parietal (P4 and P3) electrodes. When four electrodes and one band are selected (Fig. 3A top, right), the largest discrimination is provided by the temporal (T6, T5 and T4) and parietal (P4) electrodes in the alpha band (Fig. 3A middle, right). For four electrodes and all five bands, the largest discrimination is provided by the symmetric combinations of the temporal (T6 and T5) and parietal (P4 and P3) electrodes.
Of the three analytical measures, PLV analysis (Fig. 2B, 3B) provides for medium discrimination. When one pair of electrodes and one band are selected for the PLV analysis (Fig. 3B top, left), the best discrimination is provided by the intrahemispheric Fp2-O2 and inter-hemispheric F7–F8, Fp2-O1 and Fp1-Fp2 electrode pairs in the alpha band (Fig. 3B middle, left). This pattern was the same for 1 electrode pair and 5 bands (Fig. 3B bottom, left) as well as for 4 electrode pairs and 1 band (Fig. 3B top, right) and 4 electrode pairs and 5 bands (Fig. 3B bottom, right) although dominance of the alpha band for the selection of 4 electrode pairs and 1 band was less apparent (Fig. 3B middle, right).
Of the three analytical measures, PAC (Fig. 2C, 3C) provides for the maximal discrimination. For 1 electrode and 1 x-band (Fig. 3C top, left), the best discrimination is provided by the F8, F4, P4 and F7 electrodes in the theta-high gamma x-band (Fig. 3C middle, left). The same pattern can be seen when 1 electrode and all five x-bands are selected (Fig. 3C bottom, left) as well as when 4 electrodes and one x-band (Fig. 3C top, right) and four electrodes and all five x-bands (Fig. 3C bottom, right) are selected although dominance of the theta-high gamma band for the selection of 4 electrodes and 1 x-band was less apparent (Fig. 3C middle, right).
B. PAC Provides the Largest Overall Task Classification Accuracy
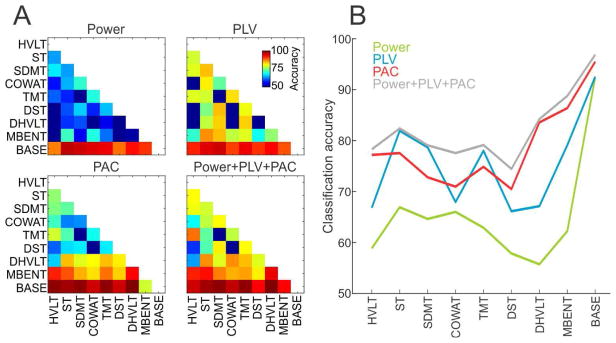
We next tested how well the individual tasks can be classified based on a selected set of measures (POWER, PLV or PAC) or their aggregate (Fig. 4). For this analysis, we used the full 80-D datasets with all bands of interests and the full set of electrodes. The best overall prediction accuracy (82.3 %) was obtained by the aggregate dataset where all three measures (POWER+PLV+PAC) were combined into a 240-D dataset (Fig. 4A bottom, right). PAC showed the second highest overall accuracy (78.8%; Fig. 4A bottom, left). In contrast, POWER showed the lowest overall accuracy (65.3%; Fig. 4A top, left) with PLV somewhere in the middle (75.4%; Fig. 4A top, right). Not surprisingly, the accuracy of classification of the baseline task from other tasks was highest for all datasets, reaching 95%. The PLV dataset provided for better classification accuracy than PAC in the ST, SDMT and TMT tasks (Fig. 4B).
Fig. 4.
Task classification accuracy. (A) Classification accuracy between pairs of tasks when using only the POWER dataset (top, left), PLV dataset (top, right), PAC dataset (bottom, left) and the combined POWER + PLV + PAC dataset (bottom, right). (B) The average classification accuracy for all tasks for POWER dataset (green), PLV dataset (blue), PAC dataset (red) and combined dataset (gray).
C. Tasks Form Distinct Clusters in Principal Component Space
Next we asked if the tasks could be organized into subgroups based on the features we extracted from the EEG. We started by taking the full 240-D dataset (POWER + PLV + PAC) and performed principal component analysis (PCA). Averages of task-specific vectors formed three distinct clusters when plot in the principal component space (Fig. 5A). Baseline appeared isolated from the rest of tasks, which formed two clusters. The first cluster was formed from the TMS, SDMT and ST tasks and the second cluster was formed by the MODBENT, DST, HVLT, COWAT and DHVLT tasks. While distinctiveness of the Baseline task is not surprising, separation into two other clusters is intriguing because all tasks in the cluster formed by the MODBENT, DST, HVLT, COWAT and DHVLT procedures are mnemonic tasks, while the other three tasks are not. We then computed PCA for separate POWER, PLV and PCA datasets and plotted averages of the task-specific activity vectors in the principal component space separately for each dataset (Fig. 5B–D). While clustering of tasks in the POWER (Fig. 5B) and PAC (Fig. 5D) dataset was not very obvious, tasks formed very clear clustering in the PLV (Fig. 5C) dataset while the PAC dataset provided the largest discrimination of individual tasks.
Fig. 5.
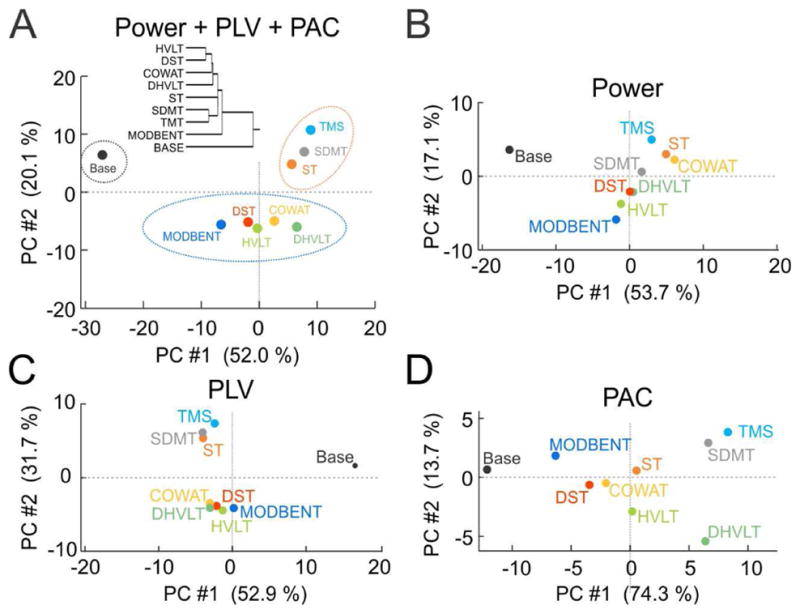
Task-specific EEG measures form clusters in PCA space. (A) Clustering of tasks in the PCA space of the combined (POWER + PLV+ PAC) dataset with dendrogram in the inset. Explained variance of first (horizontal axis) and second (vertical axis) components shown in axis labels. (B) Clustering of tasks in the PCA space for POWER dataset. (C) Clustering of tasks in the PCA space for PLV dataset. (D) Clustering of tasks in the PCA space for PAC dataset.
D. Rejection of Ocular Artifacts and Improved Phase Synchrony Measure Does Not Improve Classification
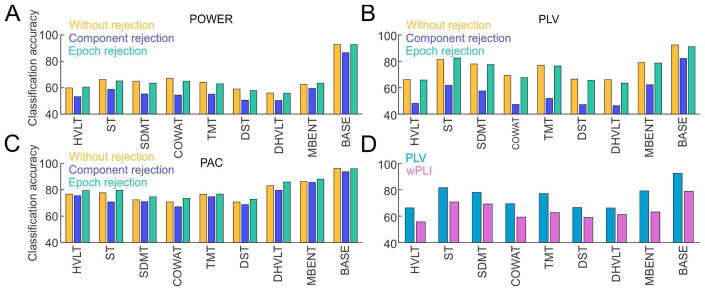
We next tested the possible impact of ocular artifacts on the classification accuracy (Fig. 6). We used two ICA-based methods for rejection of ocular artifacts. The component rejection method (see Materials and methods for more details), provided lower classification accuracy; it was lower for every task in all three datasets (27/27 test of proportions z = 5.19, p = 10−7). By inspection, the largest impact was on PLV dataset (Fig. 6B). This was likely caused by the disruption of phase synchronization that occurred when asymmetrical amounts of components were removed from pairs of signals used in PLV analysis. The epoch rejection method led to comparable classification accuracy as without applying any ocular artifact rejection.
Fig. 6.
Ocular artifacts and phase estimation methods. (A) Classification accuracy of POWER dataset without ocular artifact rejection (yellow), with ICA-based component rejection method (blue) and ICA-based epoch rejection method (green). (B) Same as A but for PLV dataset. (C) Same as A but for PAC dataset. (D) Classification accuracy using phase locking value (PLV, blue) and weighted phase lag index (WPLI, purple).
We then tested a potentially improved measure for phase synchrony with lower sensitivity to volume conduction, namely the weighted phase lag index (WPLI, see Materials and methods for more details). The classification accuracy using WPLI was significantly lower than using PLV; it was lower for every task (9/9 test of proportions z = 3.0, p = 0.004; Fig. 6D).
E. PAC Is the Least Contaminated With Muscle Artifact
Because the frequency content of muscle artifacts overlaps with high-frequency EEG bands (β, γ) and because muscle activity is expected to be the highest in tasks that especially involve speech, we decided to explore the effect of exaggerated muscle activity on POWER, PLV and PAC estimates. We took advantage of a published EEG dataset [45] recorded in two conditions, first when the subject was sitting relaxed with his or her eyes closed and second, when the subject was actively clenching his or her jaws with eyes closed. The power and the modulation index, respectively, were estimated from individual electrodes while PLV estimates were computed between contralateral electrode pairs (Fp1-Fp2, O1–O2, F7–F8, T7–T8, P7–P8, C3–C4, F3–F4, P3–P4). All estimates were computed from 30-s periods of rest or jaw clenching and the ratio between jaw clenching and rest were computed. The power ratio was log-transformed. The same algorithms were used as in the first part of the study (Fig. 1).
In the case of POWER (Fig. 7A), the ratios were progressively more biased by jaw clenching with increasing frequency. The largest bias was present at the frontal and temporal electrodes, which lie directly above the temporalis muscle. Signal power at the fronto-polar, parietal and occipital electrodes were mostly in the beta and gamma bands. In the case of PLV (Fig. 7B), which was estimated between symmetric inter-hemispheric pairs of electrodes, all estimates except those estimated from parietal and occipital electrodes were strongly biased in the gamma band. Finally, PAC (Fig. 7C), which was estimated as the modulation index between the theta-low gamma, theta-high gamma, alpha-low gamma and alpha-high gamma bands showed strong bias at frontal and temporal electrodes, with low bias present at fronto-polar, parietal and occipital electrodes. Stronger than anticipated bias in the modulation index at the frontal and temporal electrodes was most likely caused by the broadband profile of the EMG activity, which extended from the gamma band well into the alpha and even the theta bands (see Fig. 7A).
Fig. 7.
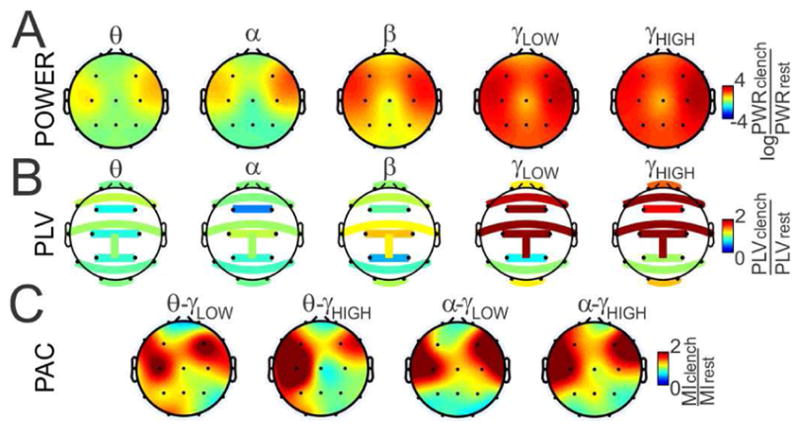
Sensitivity to muscle artifact. (A) Log ratio of power estimated during jaw clenching to power estimated during rest for five bands of interest. (B) Ratio of PLV estimated between contralateral electrode pairs during jaw clenching and rest for five bands of interest. (C) Ratio of MI estimated during jaw clenching and rest for theta-low gamma, theta-high gamma, alpha-low gamma and alpha-high gamma.
IV. Discussion
We compared three types of synchrony measures (Fig. 1, 2) in their ability to discriminate EEG signals recorded during eight cognitive tasks and rest. The band-specific power estimate provided the lowest discrimination between tasks (Fig. 3) while PAC provided the highest discrimination with PLV between the two. It should be noted that PAC and PLV measures aggregate more information than the power measure, because they analyze signal relationships between two electrodes (PLV) or between two frequency bands (PAC). The best discrimination using power estimates was obtained from the temporal and parietal electrodes with a clear dominance of the alpha band (Table 1). PLV provided the best discrimination with combinations of fronto-polar and occipital, frontal and fronto-polar electrode pairs with noticeable alpha band dominance. PAC provided the largest discrimination using the frontal and parietal electrodes with theta-high gamma dominance. In summary, these findings suggest that each synchrony measure points to different electrode locations for highest discrimination although some overlaps can be found for frontal (F7, F8; PLV and PAC), parietal (P4; POWER and PAC) and occipital (O1, POWER and PLV) electrodes. Notably, when modifying the number of selected electrodes/electrode pairs and bands/x-bands, PLV and PAC measures showed an extremely consistent selection of these features pointing to the robustness of the signal providing the discrimination at these electrodes. Finally, we demonstrate that by using relationships to oscillations that are comfortably in the frequency range of brain oscillations such as theta without contamination by muscle artifact, it is possible to utilize information from gamma frequency oscillations for characterizing and discriminating between states of EEG.
Similar results were obtained when we estimated task discrimination by computing the classification accuracy between pairs of tasks (Fig. 4). Here, the combined dataset (POWER + PLV + PAC) provided the highest overall classification accuracy, followed by PAC and PLV with the POWER dataset providing the lowest accuracy. Interestingly, PLV provided higher classification accuracy in executive function tasks that do not require long-term memory (ST – Stroop test, SDMT – symbol digit modalities, TMT – trail marking test) but presumably especially requires coordination between distant brain areas.
The tasks that showed the best classification accuracy from EEG signals (Fig. 4) also appeared as distinct clusters when high-dimensional EEG feature vectors were plotted in the PCA space (Fig. 5). The baseline condition appeared as a clearly separated cluster with a second cluster formed by the EEGs during the Stroop (ST), symbol digit modalities (SDMT) and trail marking tests (TMT). A third cluster was formed by the EEGs during the remaining tasks, which all require active use of long-term memory. When considering each of the synchrony measures separately, PLV provided the highest intergroup discrimination (Fig. 5D) while PAC provided the highest inter-task discrimination (Fig. 5E). While the distinctiveness of the baseline condition is not surprising, the separation of the task-associated EEG patterns into two other clusters is intriguing because they separate based on the requirement for memory rather than on the basis of functional anatomy. Specifically, all tasks in the MODBENT, DST, HVLT, COWAT and DHVLT cluster make demands on memory but components of only two of these tasks (MODBENT, DHVLT) are known to depend on hippocampus function [46]. In contrast, all the tasks in the other cluster tax executive functions including attention and cognitive flexibility (TMT), visuomotor processing (SDMT) and attention and cognitive control/response inhibition (ST). It is also notable that the two task clusters were most clearly separated by the PLV measure, specifically by the second principal component, which might point to the long-range inter-areal brain synchrony that may be required for performing these tasks effectively. Consistent with this view, in a study that analyzed processing speed in the symbol-digit modalities test it was found that increased speed resulted in an increased level and number of functional networks as well as increased connectivity within the fronto-parietal and fronto-occipital networks that are presumably required for effective information transfer between the distant frontal and parietal cortices [47]. A different study demonstrated a relationship between performance in the trail making test (TMT) and anatomical coupling between prefrontal cortex and distributed cortical regions [48]. Several other studies reported lower performance on the symbol digit modalities test (SDMT) is associated with decreased long-range synchrony in the sensorimotor and dorsal attention networks in Huntington disease and multiple sclerosis [49], [50]. On the other hand, PAC analysis appeared to distinguish the hippocampus-dependent tasks (MODBENT and DHVLT) from the remaining tasks, which might point to the role of cross-frequency coupling in memory processes [51], [52] and the mechanistic role of PAC in hippocampus information processing, although these signals in the scalp EEG cannot be localized to anatomical sources.
The present goal was to determine whether and to what extent it is possible to use signals in the EEG to classify what task the subject was doing during the EEG. While the results suggest that, at least in principle, it may be possible to use the EEG itself to define and characterize states or modes of brain function, it remains to be demonstrated that the brain signals in the EEG are alone sufficient for the discrimination, because signals of other origins like ocular and muscular signals that are differentially biased across the tasks could have contributed signals to the EEG that were used for the discriminations.
One shortcoming of the present study was the lack of control over the duration of each task as well as a precise timing of the individual presentations of cognitive tasks synchronized with EEG recording. It is therefore possible that some of the observed effects can in principle be explained by differences in stimulus properties during each cognitive task. While we acknowledge this limitation, we also want to stress that the major conclusion of the study was that PAC appears most informative in task separation and classification accuracy and it is least sensitive to intense muscle artifacts. In those comparisons, PAC was compared against PLV and POWER measures using the same data, therefore with the same differences between tasks. Related to the previous limitation, are differences in responding to different task by means of speaking (HVLT, dHVLT, DST, COWAT, ST) or writing (SDT, TMT) as well as no output (Baseline). Indeed, SDT and TMT tasks formed similar clusters (Fig. 5), although the same cluster was also shared with the ST task, which was performed without written output, indicating that the clustering cannot be merely due to the writing component.
Finally, we analyzed each synchrony measure’s sensitivity to muscle artifacts because this is especially important for EEG mobile applications that are impractical in an EEG laboratory. Estimates of structural power showed a strong positive bias with muscle activity >10 Hz at all electrodes with PLV showing a positive bias >20 Hz at all sites except the parietal electrodes. PAC showed very low bias in the fronto-polar, parietal and occipital electrodes and wide-band bias at frontal and temporal electrodes. While as expected, the lowest impact of muscle activity on the PAC measure was demonstrated here, we did not expect such a strong impact on PAC estimated from the frontal and temporal electrodes (electrodes closest to the temporalis muscle). This contamination is clearly caused by biasing not only the high-frequency amplitude but also the low-frequency phase (compare Fig. 7C and Fig. 7A). One possible explanation for the strong bias of PAC in the high frequency range might be sharp EEG waveshapes, which might be decomposed into broad-band spectral power appearing as PAC in the high frequency range [53]. It is important to note that while muscle activity is generally considered to be ‘noise’ in the EEG recordings, it along with ocular and other artifacts can still potentially provide important information for task discrimination.
Because it was possible to discriminate amongst the tasks that were being performed during the EEG recordings, the findings and analyses presented here point to the possibility that cognitive states can themselves be discriminated from information in the standard scalp EEG, and that significant discriminative information is in the inter-relations between EEG signals at distinct electrode sites and distinct frequency bands, that include the often excluded gamma band. Based on this information, future efforts to design applications and diagnostics based on EEG should be motivated in their search for optimal discriminative measures of brain functional states, to explore these and additional inter-relations such as cross-site PAC where the frequency for phase would be obtained from one electrode and the frequency for amplitude obtained from another electrode.
V. Conclusions
We conclude that standard scalp EEG, in application settings outside of the laboratory, can provide sufficient information to discriminate amongst internally-distinct cognitive behaviors, and that estimates of neural synchrony in cross-frequency and cross-electrode measures such as PAC and PLV provide more discriminative information than estimates of power.
Acknowledgments
We thank Dr. Ahmet Omurtag for valuable discussions of the manuscript and for providing access to the data used in the EMG analyses. This work was supported by NYU Dean for Science Funds. AAF is supported by NIH grants R01MH099128, R01MH084038.
Biographies
Dino Dvorak received a M.Sc. degree in Biomedical engineering from the Czech Technical University in Prague, Czech Republic in 2001 and a Ph.D. degree in Biomedical engineering from State University of New York, Downstate Medical Center in Brooklyn, New York in 2015. Dino then joined Dr. Fenton’s Neurobiology of Cognition Laboratory at New York University as a postdoctoral associate. He investigates the role of brain rhythms in normal brain function and cognitive disorders such as schizophrenia and autism using advanced computational methods for functional brain imaging, data processing and biomedical instrumentation.

Andrea Shang received a B.Sc. degree in Psychology, History and German Studies at Smith College in Northampton, Massachusetts in 2010. Andrea is currently enrolled in a Ph.D. program in Behavioral and Systems Neuroscience at Rutgers University in New Brunswick, New Jersey.
Samah Baki received his MD at the American University of Beirut in 2006 and his internship in emergency medicine at State University of New York (SUNY) in 2008. Samah leads NIH-funded clinical trials that utilize neurologists at SUNY to interpret EEGs recorded from patients in multiple New York area neonatal intensive care units. With colleagues at SUNY, he discovered a drug pair that was unusually potent in treating cognitive deficits after traumatic brain injury. The US Army recognized it as one of the most outstanding research projects funded by the Congressionally Directed Medical Research Programs (CDMRP) in fiscal year 2007.

Wendy Suzuki received her B.Sc. in physiology and human anatomy at the U.C., Berkeley in 1987 and her Ph.D. in Neuroscience from U.C., San Diego in 1993.
Wendy Suzuki is a Professor of Neural Science and Psychology at New York University. She is best known for her studies on the anatomy, physiology and function of the brain areas critical for long-term memory. More recently she has started to examine the neuro-behavioral, physiological and neurochemical effects of physical aerobic activity on a wide range of brain and cognitive functions in people. She is also an award-winning teacher, scholar and author.

André A. Fenton received a B.Sc. degree in Biology from McGill University, Montréal, Canada in 1990 and a Ph.D. degree in Neural and Behavioral Science from the State University of New York, Downstate Medical Center, Brooklyn, New York in 1998. André is a Professor of Neural Science at New York University. His research focus is molecular, neural, behavioral, and computational aspects of memory. He studies how brains store experiences as memories, and how expressing knowledge activates relevant information without activating what is irrelevant. André founded Bio-Signal Group Corp., which commercialized an FDA-cleared platform for EEGs anywhere, anytime, for everyone.
Footnotes
Disclosure
SAB is an employee of Bio-Signal Group Corp., and is a shareholder along with AAF and DD.
Contributor Information
Dino Dvorak, Email: dd1348@nyu.edu, New York University, Center for Neural Science, New York, NY, 10003 USA.
Andrea Shang, Email: andrea.shang@rutgers.edu, New York University, New York, NY, 10003, USA. She is now with Rutgers University, Department of Psychology, Behavioral and Systems Neuroscience, New Brunswick, NJ, 08854, USA.
Samah Abdel-Baki, Email: sbaki@biosignalgroup.com, Bio-Signal Group Corp., Acton, MA, 01720, USA.
Wendy Suzuki, Email: ws21@nyu.edu, New York University, Center for Neural Science, New York, NY, 10003 USA.
André A. Fenton, Email: afenton@nyu.edu, New York University, Center for Neural Science, New York, NY, 10003 USA
References
- 1.Niedermeyer E, Schomer DL, Lopes da Silva FH. Niedermeyer’s electroencephalography: basic principles, clinical applications, and related fields. 6. Philadelphia: Wolters Kluwer/Lippincott Williams & Wilkins Health; 2011. [Google Scholar]
- 2.McLoughlin G, Makeig S, Tsuang MT. In search of biomarkers in psychiatry: EEG-based measures of brain function. Am J Med Genet B Neuropsychiatr Genet. 2014 Mar;165B(2):111–21. doi: 10.1002/ajmg.b.32208. [DOI] [PubMed] [Google Scholar]
- 3.Nuwer MR, Hovda DA, Schrader LM, Vespa PM. Routine and quantitative EEG in mild traumatic brain injury. Clin Neurophysiol. 2005 Sep;116(9):2001–25. doi: 10.1016/j.clinph.2005.05.008. [DOI] [PubMed] [Google Scholar]
- 4.Nash JK. Treatment of attention deficit hyperactivity disorder with neurotherapy. Clin Electroencephalogr. 2000 Jan;31(1):30–7. doi: 10.1177/155005940003100109. [DOI] [PubMed] [Google Scholar]
- 5.Nicolas-Alonso LF, Gomez-Gil J. Brain computer interfaces, a review. Sensors (Basel) 2012;12(2):1211–79. doi: 10.3390/s120201211. [DOI] [PMC free article] [PubMed] [Google Scholar]
- 6.Harrison RR. A versatile integrated circuit for the acquisition of biopotentials (in English). Proceedings of the Ieee 2007 Custom Integrated Circuits Conference; 2007. pp. 115–122. [Google Scholar]
- 7.Grant AC, et al. Diagnostic accuracy of microEEG: a miniature, wireless EEG device. Epilepsy Behav. 2014 May;34:81–5. doi: 10.1016/j.yebeh.2014.03.015. [DOI] [PMC free article] [PubMed] [Google Scholar]
- 8.Omurtag A, et al. Technical and clinical analysis of microEEG: a miniature wireless EEG device designed to record high-quality EEG in the emergency department. Int J Emerg Med. 2012 Sep 24;5(1):35. doi: 10.1186/1865-1380-5-35. [DOI] [PMC free article] [PubMed] [Google Scholar]
- 9.Belkacem AN, et al. Real-Time Control of a Video Game Using Eye Movements and Two Temporal EEG Sensors. Comput Intell Neurosci. 2015;2015:653639. doi: 10.1155/2015/653639. [DOI] [PMC free article] [PubMed] [Google Scholar]
- 10.Rogers JM, Johnstone SJ, Aminov A, Donnelly J, Wilson PH. Test-retest reliability of a single-channel, wireless EEG system. Int J Psychophysiol. 2016 Aug;106:87–96. doi: 10.1016/j.ijpsycho.2016.06.006. [DOI] [PubMed] [Google Scholar]
- 11.Tong J, Zhang P, Xiao R, Ding L. The portable P300 dialing system based on tablet and Emotiv Epoc headset. Conf Proc IEEE Eng Med Biol Soc. 2015 Aug;2015:566–9. doi: 10.1109/EMBC.2015.7318425. [DOI] [PubMed] [Google Scholar]
- 12.Tort AB, Komorowski R, Eichenbaum H, Kopell N. Measuring phase-amplitude coupling between neuronal oscillations of different frequencies,” (in eng) J Neurophysiol. 2010 Aug;104(2):1195–210. doi: 10.1152/jn.00106.2010. [DOI] [PMC free article] [PubMed] [Google Scholar]
- 13.Vinck M, Oostenveld R, van Wingerden M, Battaglia F, Pennartz CM. An improved index of phase-synchronization for electrophysiological data in the presence of volume-conduction, noise and sample-size bias. Neuroimage. 2011 Apr 15;55(4):1548–65. doi: 10.1016/j.neuroimage.2011.01.055. [DOI] [PubMed] [Google Scholar]
- 14.Dvorak D, Fenton AA. Toward a proper estimation of phase-amplitude coupling in neural oscillations. J Neurosci Methods. 2014 Mar 30;225:42–56. doi: 10.1016/j.jneumeth.2014.01.002. [DOI] [PMC free article] [PubMed] [Google Scholar]
- 15.BR . Dynamic programming. Princeton University Press; 1957. 9780691079516. [Google Scholar]
- 16.Makeig BA, Jung ST-P, Sejnowski TJ, editors. Independent Component Analysis of Electroencephalographic Data. Advances in Neural Information Processing Systems. 1996;8:145–151. [Google Scholar]
- 17.Whitham EM, et al. Scalp electrical recording during paralysis: quantitative evidence that EEG frequencies above 20 Hz are contaminated by EMG. Clin Neurophysiol. 2007 Aug;118(8):1877–88. doi: 10.1016/j.clinph.2007.04.027. [DOI] [PubMed] [Google Scholar]
- 18.Buzsaki G, Anastassiou CA, Koch C. The origin of extracellular fields and currents–EEG, ECoG, LFP and spikes. Nat Rev Neurosci. 2012 Jun;13(6):407–20. doi: 10.1038/nrn3241. [DOI] [PMC free article] [PubMed] [Google Scholar]
- 19.Radwan B, Dvorak D, Fenton AA. Impaired cognitive discrimination and discoordination of coupled theta-gamma oscillations in Fmr1 knockout mice. Neurobiol Dis. 2016 Apr;88:125–38. doi: 10.1016/j.nbd.2016.01.003. [DOI] [PMC free article] [PubMed] [Google Scholar]
- 20.Buzsaki G. Neural syntax: cell assemblies, synapsembles, and readers. Neuron. 2010 Nov 04;68(3):362–85. doi: 10.1016/j.neuron.2010.09.023. [DOI] [PMC free article] [PubMed] [Google Scholar]
- 21.Jung TP, Makeig S, Stensmo M, Sejnowski TJ. Estimating alertness from the EEG power spectrum. IEEE Trans Biomed Eng. 1997 Jan;44(1):60–9. doi: 10.1109/10.553713. [DOI] [PubMed] [Google Scholar]
- 22.Trejo LJ, et al. EEG-Based Estimation of Mental Fatigue: Convergent Evidence for a Three-State Model. In: Schmorrow DD, Reeves LM, editors. Foundations of Augmented Cognition: Third International Conference, FAC 2007, Held as Part of HCI International 2007; Beijing, China. July 22–27, 2007; Berlin, Heidelberg: Springer Berlin Heidelberg; 2007. pp. 201–211. Proceedings. [Google Scholar]
- 23.Klimesch W. EEG alpha and theta oscillations reflect cognitive and memory performance: a review and analysis. Brain Res Brain Res Rev. 1999 Apr;29(2–3):169–95. doi: 10.1016/s0165-0173(98)00056-3. [DOI] [PubMed] [Google Scholar]
- 24.Jensen O, Tesche CD. Frontal theta activity in humans increases with memory load in a working memory task. Eur J Neurosci. 2002 Apr;15(8):1395–9. doi: 10.1046/j.1460-9568.2002.01975.x. [DOI] [PubMed] [Google Scholar]
- 25.Amin HU, Malik AS, Badruddin N, Chooi WT. Brain activation during cognitive tasks: An overview of EEG and fMRI studies. 2012 IEEE-EMBS Conference on Biomedical Engineering and Sciences; 2012; pp. 950–953. [Google Scholar]
- 26.Fitzgibbon SP, Pope KJ, Mackenzie L, Clark CR, Willoughby JO. Cognitive tasks augment gamma EEG power. Clin Neurophysiol. 2004 Aug;115(8):1802–9. doi: 10.1016/j.clinph.2004.03.009. [DOI] [PubMed] [Google Scholar]
- 27.Fries P. A mechanism for cognitive dynamics: neuronal communication through neuronal coherence,” (in eng) Trends Cogn Sci. 2005 Oct;9(10):474–80. doi: 10.1016/j.tics.2005.08.011. [DOI] [PubMed] [Google Scholar]
- 28.Le Van Quyen M. The brainweb of cross-scale interactions. New Ideas Psychol. 2011;29(2):57–63. [Google Scholar]
- 29.Lisman JE, Idiart MA. Storage of 7 +/− 2 short-term memories in oscillatory subcycles,” (in eng) Science. 1995 Mar 10;267(5203):1512–5. doi: 10.1126/science.7878473. [DOI] [PubMed] [Google Scholar]
- 30.Basso JC, Shang A, Elman M, Karmouta R, Suzuki WA. Acute Exercise Improves Prefrontal Cortex but not Hippocampal Function in Healthy Adults. J Int Neuropsychol Soc. 2015 Nov;21(10):791–801. doi: 10.1017/S135561771500106X. [DOI] [PubMed] [Google Scholar]
- 31.Brandt J. The hopkins verbal learning test: Development of a new memory test with six equivalent forms. Clinical Neuropsychologist. 1991 Apr-Jan5(2):125–142. [Google Scholar]
- 32.Stroop JR. Ph D. George Peabody College for Teachers, George Peabody College for Teachers; Nashville, Tenn: 1935. Studies of interference in serial verbal reactions. [Google Scholar]
- 33.Smith A. The symbol-digit modalities test: a neuropsychologic test of learning and other cerebral disorders. In: Helmuth J, editor. Learning disorders. Special Child Publications; 1968. [Google Scholar]
- 34.Benton ALH, de SK, Sivan AB. Multilingual aplasia examination. 2. AJA Associates; Iowa City, IA: 1983. [Google Scholar]
- 35.Reitan RMWD. The Halstead–Reitan Neuropsychological Test Battery: Theory and clinical interpretation. 2. Neuropsychology Press; 1993. [Google Scholar]
- 36.Wechsler D. The Wechsler Intelligence Scale for Children. The Psychological Corporation; San Antonio, TX: 1949. [Google Scholar]
- 37.Benton AL. A visual retention test for clinical use. Arch Neurol Psychiatry. 1945 Sep;54:212–6. doi: 10.1001/archneurpsyc.1945.02300090051008. [DOI] [PubMed] [Google Scholar]
- 38.Tallon-Baudry C, Bertrand O, Delpuech C, Permier J. Oscillatory gamma-band (30–70 Hz) activity induced by a visual search task in humans,” (in eng) J Neurosci. 1997 Jan 15;17(2):722–34. doi: 10.1523/JNEUROSCI.17-02-00722.1997. [DOI] [PMC free article] [PubMed] [Google Scholar]
- 39.Roopun AK, et al. A beta2-frequency (20–30 Hz) oscillation in nonsynaptic networks of somatosensory cortex. Proc Natl Acad Sci U S A. 2006 Oct 17;103(42):15646–50. doi: 10.1073/pnas.0607443103. [DOI] [PMC free article] [PubMed] [Google Scholar]
- 40.Freeman WJ, Holmes MD, Burke BC, Vanhatalo S. Spatial spectra of scalp EEG and EMG from awake humans. Clin Neurophysiol. 2003 Jun;114(6):1053–68. doi: 10.1016/s1388-2457(03)00045-2. [DOI] [PubMed] [Google Scholar]
- 41.Lachaux JP, Rodriguez E, Martinerie J, Varela FJ. Measuring phase synchrony in brain signals,” (in eng) Hum Brain Mapp, Research Support, Non-U.S. Gov’t. 1999;8(4):194–208. doi: 10.1002/(SICI)1097-0193(1999)8:4<194::AID-HBM4>3.0.CO;2-C. [DOI] [PMC free article] [PubMed] [Google Scholar]
- 42.Oostenveld R, Fries P, Maris E, Schoffelen JM. FieldTrip: Open source software for advanced analysis of MEG, EEG, and invasive electrophysiological data. Comput Intell Neurosci. 2011;2011:156869. doi: 10.1155/2011/156869. [DOI] [PMC free article] [PubMed] [Google Scholar]
- 43.Canolty RT, et al. High gamma power is phase-locked to theta oscillations in human neocortex (in eng) Science. 2006 Sep 15;313(5793):1626–8. doi: 10.1126/science.1128115. [DOI] [PMC free article] [PubMed] [Google Scholar]
- 44.Chang CC, Lin CJ. LIBSVM: A library for support vector machines. ACM Trans Intell Syst Technol. 2011;2(3):1–27. [Google Scholar]
- 45.Keles BRHO, Omurtag A. Hemodynamic correlates of spontaneous neural activity measured by human whole-head resting state EEG+fNIRS. Neuroimage. 2016 doi: 10.1016/j.neuroimage.2016.05.058. [DOI] [PubMed] [Google Scholar]
- 46.Brickman AM, Stern Y, Small SA. Hippocampal subregions differentially associate with standardized memory tests. Hippocampus. 2011 Sep;21(9):923–8. doi: 10.1002/hipo.20840. [DOI] [PMC free article] [PubMed] [Google Scholar]
- 47.Forn C, Ripolles P, Cruz-Gomez AJ, Belenguer A, Gonzalez-Torre JA, Avila C. Task-load manipulation in the Symbol Digit Modalities Test: an alternative measure of information processing speed. Brain Cogn. 2013 Jul;82(2):152–60. doi: 10.1016/j.bandc.2013.04.003. [DOI] [PubMed] [Google Scholar]
- 48.Lee NR, Wallace GL, Raznahan A, Clasen LS, Giedd JN. Trail making test performance in youth varies as a function of anatomical coupling between the prefrontal cortex and distributed cortical regions. Front Psychol. 2014;5:496. doi: 10.3389/fpsyg.2014.00496. [DOI] [PMC free article] [PubMed] [Google Scholar]
- 49.Akbar N, et al. Brain activation patterns and cognitive processing speed in patients with pediatric-onset multiple sclerosis. J Clin Exp Neuropsychol. 2016;38(4):393–403. doi: 10.1080/13803395.2015.1119255. [DOI] [PubMed] [Google Scholar]
- 50.Poudel GR, Egan GF, Churchyard A, Chua P, Stout JC, Georgiou-Karistianis N. Abnormal synchrony of resting state networks in premanifest and symptomatic Huntington disease: the IMAGE-HD study. J Psychiatry Neurosci. 2014 Mar;39(2):87–96. doi: 10.1503/jpn.120226. [DOI] [PMC free article] [PubMed] [Google Scholar]
- 51.Axmacher N, Henseler MM, Jensen O, Weinreich I, Elger CE, Fell J. Cross-frequency coupling supports multi-item working memory in the human hippocampus,” (in eng) Proc Natl Acad Sci U S A. 2010 Feb 16;107(7):3228–33. doi: 10.1073/pnas.0911531107. Research Support, Non-U.S. Gov’t. [DOI] [PMC free article] [PubMed] [Google Scholar]
- 52.Heusser AC, Poeppel D, Ezzyat Y, Davachi L. Episodic sequence memory is supported by a theta-gamma phase code. Nat Neurosci. 2016 Oct;19(10):1374–80. doi: 10.1038/nn.4374. [DOI] [PMC free article] [PubMed] [Google Scholar]
- 53.Cole SR, Voytek B. Brain Oscillations and the Importance of Waveform Shape. Trends Cogn Sci. 2017 Feb;21(2):137–149. doi: 10.1016/j.tics.2016.12.008. [DOI] [PubMed] [Google Scholar]


