Abstract
We developed a novel method for QRS complex and P wave detection in the electrocardiogram (ECG) signal. The approach reconstructs two different signals for the purpose of QRS and P wave detection from the modes obtained by the complete ensemble empirical mode decomposition with adaptive noise, taking only those modes that best represent the signal dynamics. This approach eliminates the need for conventional filtering. We first detect QRS complex locations, followed by removal of QRS complexes from the reconstructed signal to enable P wave detection. We introduce a novel method of P wave detection from both the positive and negative amplitudes of the ECG signal and an adaptive P wave search approach to find the true P wave. Our detection method automatically identifies P waves without prior information. The proposed method was validated on two well-known annotated databases—the MIT BIH Arrythmia database (MITDB) and The QT database (QTDB). The QRS detection algorithm resulted in 99.96% sensitivity, 99.9% positive predictive value, and an error of 0.13% on all validation databases. The P wave detection method had better performance when compared to other well-known methods. The performance of our P wave detection on the QTDB showed a sensitivity of 99.96%, a positive predictive value of 99.47%, and the mean error in P peak detection was less than or equal to one sample (4 ms) on average.
Index Terms: Complete Ensemble Empirical Mode Decomposition with Adaptive Noise, CEEMDAN, ECG, QRS Complex, P wave, Signal Reconstruction
I. Introduction
Electrocardiogram (ECG) signals are widely used for detection and diagnosis of various cardiac arrhythmias. The main advantage of ECG measurement is its noninvasiveness. Automatic detection of different arrhythmias from ECG signals has been a major research focus for the last few decades. While various algorithms have been developed, there continues to be a need for more accurate methods for detecting the QRS complex, P wave, and T wave from ECG data. Proper detection of QRS complex locations enables accurate estimation of heart rates (HR) and identification of abnormalities in heart rhythms (e.g. atrial fibrillation (AF), premature ventricular contraction (PVC), and premature atrial contraction (PAC)).
One of the major cardiac arrhythmias is atrial fibrillation (AF), which causes more than 750,000 hospitalizations and contributes to 130,000 deaths each year [1], [2]. When AF occurs, it is characterized by irregular RR intervals and absence of P waves in the ECG. Using only the irregularity of RR intervals cannot accurately capture atrial fibrillation (AF) rhythm, especially in the presence of premature ventricular contraction (PVC) and premature atrial contraction (PAC) [3]. When PAC and PVC are present, discrimination of P waves can be used in conjunction with irregular RR intervals for even more accurate AF detection. Unfortunately, detection of a P waves is challenging due to the low amplitude and susceptibility of P waves to noise and motion artifact contamination, especially when ECG data are collected from wearable devices. Moreover, P wave morphology changes from subject to subject and depends on ECG lead placement. For example, P waves can be normal, inverted, or biphasic. Thus, automated detection of P waves is quite challenging, especially from wearable devices.
There have been several notable prior approaches to P wave detection. An adaptive filter-based technique is proposed in [4], which can be easily implemented and does not require a priori information about the ECG signal. Unfortunately, this technique requires a reference signal. A low pass differentiation technique is proposed in [5], an approach that is robust to waveform variation. However, this method is sensitive to noise and its arbitrary threshold value used in this method sometimes leads to P wave detection error. The pattern recognition-based approach in [6] is overly sensitive to noise and has insufficient accuracy for clinical use. Other approaches include a neural network with wavelet transform to detect recurrent patterns in the ECG in [7], an evolutionary optimization-based approach [8], and a Bayesian approach in association with Gibbs sampler [9]. Most of these methods are computationally intensive and they require a large computer memory size, limiting utility for some wearable device applications. The extended Kalman filter (EKF) approach proposed in [10] has been found to be quite effective in P wave detection. However, this approach needs to initialize parameters associated with the algorithm and they may vary depending on the type of ECG signals. A differential evolution (DE) optimization strategy proposed in [11] has shown a good accuracy in P wave detection. However, this method is computationally expensive and phase assignment method described in this paper depends on accurate detection of R peaks, which may lead to problem when there are ectopic beats in ECG (e.g. PAC/PVC). Real time ECG delineation proposed in [12], [13] can detect P wave with a reasonable accuracy but their performance degrade significantly with increased amount of noise.
Several methods have been proposed for QRS complex detection as well. These include wavelet transform methods [14]–[16], a derivative method [17], an adaptive filtering method [18], an empirical mode decomposition (EMD) method [19], a hidden Markov model approach [20], and a slope and amplitude method [21]. Many of these methods require prior information about the ECG and are not adaptive to fluctuations in the ECG amplitude. Some are computationally expensive, while many of them also require a training period. Most wavelet analysis is sensitive to intra-subject and inter-subject variations and fails to capture signal characteristics if waveforms do not match the chosen mother wavelet. Moreover, a simple EMD technique has a mode mixing problem.
In this paper we proposed an efficient method to detect QRS complexes and P waves using the complete ensemble empirical mode decomposition with adaptive noise (CEEMDAN) method. Two separate signals are reconstructed for the QRS complexes and P waves, respectively, from different modes obtained by CEEMDAN decomposition. The QRS complexes and P waves are then detected from their respective signals. We used two well-known manually annotated ECG databases for validation of our proposed method.
The rest of the paper is organized as follows: in the Materials and Methods section, we describe our algorithms for QRS complex and P-wave detection. The performance of our algorithms and comparison with other established algorithms are presented in the Results section and perspectives are provided in the Discussion section. Finally, a summary of our findings is provided in the Conclusions section.
II. Material and Methods
A. Description of Datasets
Two well-known datasets have been used in this study to develop and validate the proposed QRS complex and P wave detection method.
1). MIT BIH Arrhythmia Database:
The MIT-BIH arrythmia database consists of 48 half-hours long datasets of two channel ambulatory ECG recordings which are obtained from 47 different subjects [22]. Out of 47 subjects 25 were male aged 32 to 89 and 22 were female aged 22 to 89 (ECG records 201 and 202 came from the same male subject). The source of the ECGs included in MITDB is a set of over 4000 long-term Holter recordings that were obtained by the Beth Israel Hospital Arrhythmia Laboratory between 1975 and 1979, of which approximately 60 % were obtained from inpatients and rest were obtained from outpatients. 23 records of the database were chosen at random from this set with an intension to serve as a representative sample of the variety of waveforms and artifact that an arrhythmia detector might encounter in routine clinical use while remaining 25 records were selected from the same set to include complex ventricular, junctional, and supraventricular arrhythmias and conduction abnormalities. The recordings were digitized with a sampling frequency of 360 samples per second and resolution of 11 bits over a 11 mv range. Each recording contains two leads: modified limb lead II and one of V1, V2, V4 and V5 leads. For each of the recording there are two or more cardiologist’s annotations. Finally, disagreements among the annotations were resolved to obtain a computer- readable reference annotations for each beat (approximately 110000 beats) which is included with the database. This database has been widely used for validation of QRS detection algorithms [23].
2). The QT Database:
The QT Database includes ECGs which were chosen to represent a wide variety of QRS and ST-T morphologies. The QT Database contains 105 recordings which were primarily collected from some existing databases, including the MIT-BIH Arrhythmia Database, the European Society of Cardiology ST-T Database, and several other ECG databases collected at Boston’s Beth Israel Deaconess Medical Center [22], [24]. Some of the ECG records were also collected from holter recordings of patients who experienced sudden cardiac death during the recordings, and age-and-gender matched patients without diagnosed cardiac disease. All the recordings were sampled at 250 Hz. Each of the records has at least 30 beats annotated by cardiologists (ref1) who identified the beginning, peak and end of the P-wave, the beginning and end of the QRS-complex (the QRS fiducial mark, typically at the R wave peak, was given by an automated QRS detector), the peak and end of the T wave, and (if present) the peak and end of the U wave. The QTDB also includes an additional annotation performed by a second cardiologist (ref2) for 11 records out of total 105. The remaining 94 records have only a single set of expert annotations.
3). The MIT-BIH Noise Stress Test Database:
The MITBIH Noise Stress Test Database includes 12 half-hour ECG recordings and 3 half-hour recordings of noise in typical ambulatory ECG recordings[22], [25]. The noises include baseline wander, muscle artifact and electrode motion artifact which were made using physically active volunteers and standard ECG recorders, leads, and electrodes; the electrodes were placed on the limbs in positions in which subjects’ ECGs were not visible. Calibrated amounts of different levels of noise were added to the two clean ECG recordings (118,119) from the MIT-BIH Arrhythmia Database. Different levels of noise were added to each of the recordings to make 6 different signals with different Signal-to-noise ratios (SNRs) (24, 18, 12, 6, 0, and 6 dB). All the ECG signals were sampled with a sampling frequency of 360 samples per second. The database contains beat annotations for each of the files.
B. EMD
Huang et al. [26] proposed the Hilbert-Huang transform, which is a signal processing tool that consists of two parts: EMD and the Hilbert transform. The latter is used to create an analytical signal from real-valued data. In EMD, a signal x (t) is decomposed into a few intrinsic mode functions (IMFs). All the IMFs satisfy two conditions: (i) the number of extrema and number of zero crossings must be equal or differ by at most one, and (ii) the mean value of the upper and lower envelops of a time series is zero. The IMFs can be extracted using an iterative algorithm called the sifting algorithm. The process is as follows.
Set r (t) = x (t)
Find local maxima and minima of r(t)
Find upper and lower envelops U(t) and L(t), respectively
- Calculate mean value of upper and lower envelopes
- Subtract the mean μ from the residue signal r(t)
Update r(t), r (t) = r (t)− IMF(t) and go to step 2 and continue the process until the IMF satisfies conditions(i) and (ii).
This sifting process is continued until the stopping criteria is reached. The residue rK (t) after extraction of K IMFs becomes either an IMF or a monotonic function. Thus, the original signal x(t) can be reconstructed using all the IMFs and the final residue rK (t) is defined as follows:
| (1) |
where K is the number of IMFs.
C. Ceemdan Algorithm
One of the major problems of EMD is called ‘mode mixing.’ For example, in the presence of disparate amplitude oscillations in the original signal, similar oscillations are also observed in the different modes. In order to overcome this problem, a new method called the Ensemble Empirical Mode Decomposition (EEMD) was proposed in [27], where EMD is performed over an ensemble of the signal plus Gaussian white noise (GWN). However, EEMD suffers from other issues. For example, different realizations of the signal plus GWN may lead to a different number of modes and the reconstructed signal may also contain the residual noise.
These issues led to the development of the Complete Ensemble Empirical Mode Decomposition with Adaptive Noise (CEEMDAN) [28]. The CEEMDAN algorithm starts by assuming ηj (.) is the operator that produces the j-th mode obtained by EMD for a given signal. Then, the CEEMDAN algorithm is organized as follows:
- Decompose N realizations x (t) + β0wi(t) by EMD and calculate their first mode. Then the first IMF of CEEMDAN is given by
- Calculate the first residue r1(t) using
- Decompose realizations r1 (t) + β1η1(wi(t)) where i = 1, 2, 3, …, N and find their first mode. Then the second IMF can be computed as follows
- For k = 2, …, K calculate the k-th residue using
- Decompose realizations rk (t) + βkηk(wi(t)) i = 1, 2, 3, …, N and compute their first EMD mode to get the (k+1) th IMF as
Go back to step 4 for new k.
This above procedure is performed until the stopping criteria is achieved. With a total K number of modes and final residue rK (t), the original signal can be reconstructed as follows:
| (2) |
The βk parameter in CEEMDAN allows one to select a different signal-to-noise ratio (SNR) at each stage, so it can be adaptive. It has been suggested in [27] to use low amplitude noise for data dominated by high frequency signals and vice versa. It has been shown that CEEMDAN produces a smaller number of modes compared to EEMD.
D. Description of Algorithm
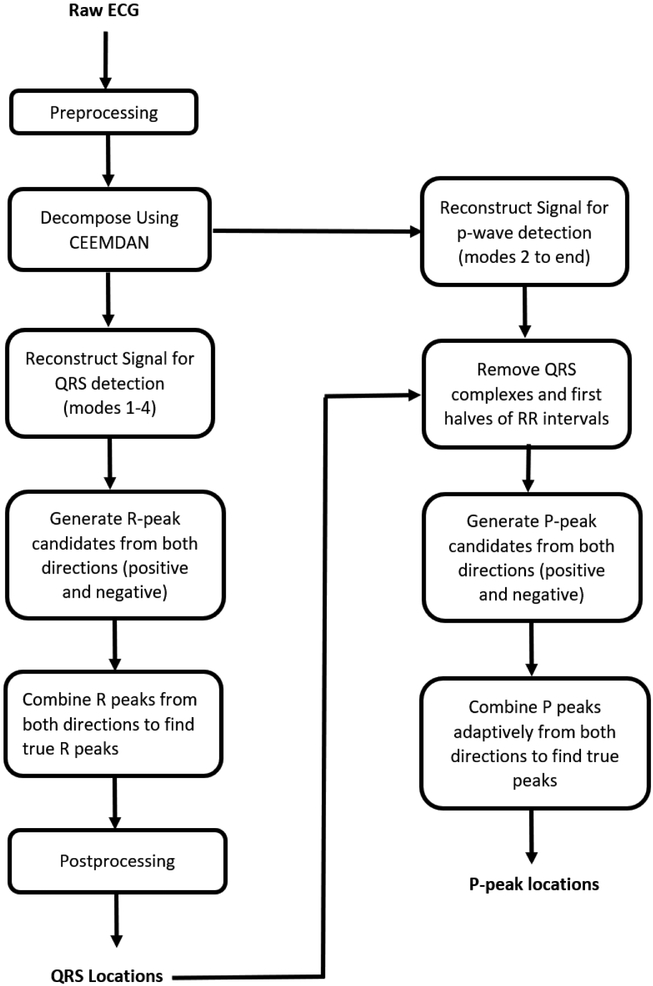
Fig. 1 shows a flowchart representation of the proposed methodology to detect QRS complexes and P waves. The different stages of the proposed methodology consist of: preprocessing, CEEMDAN decomposition, different signal reconstructions for QRS and P wave detection, QRS detection, QRS complex removal for P wave detection, P wave detection from both negative and positive sides of the signal, and adaptive combining of P waves detected from two sides to find the true P waves. The detailed descriptions of each step are given in the following subsections.
Fig. 1.
Schematic diagram of proposed methodology
1). Preprocessing:
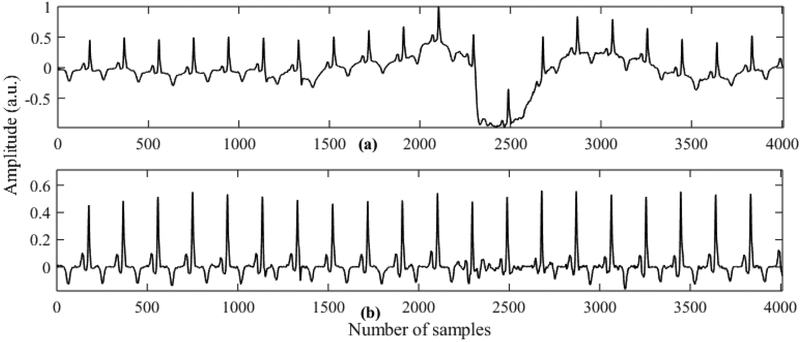
In this stage baseline drift is removed from the raw ECG and the signal is standardized to zero mean and unit standard deviation. For baseline drift removal we use two moving window median filters with window sizes of 200 ms and 600 ms. The ECG signal is passed through these two different moving window median filters and then the average of the two outputs is subtracted from the original signal. The moving window median filtering method has been found quite effective in removing baseline wander [29]. Fig. 2 shows ECG signals after performing median filtering on the subject (Sel32) from the QTDB database.
Fig. 2.
Output of preprocessing stage using subject sel32m (highly affected by baseline wandering). (a) ECG with baseline wander. (b) Preprocessed ECG signal
2). Decomposition of ECG Using Ceemdan:
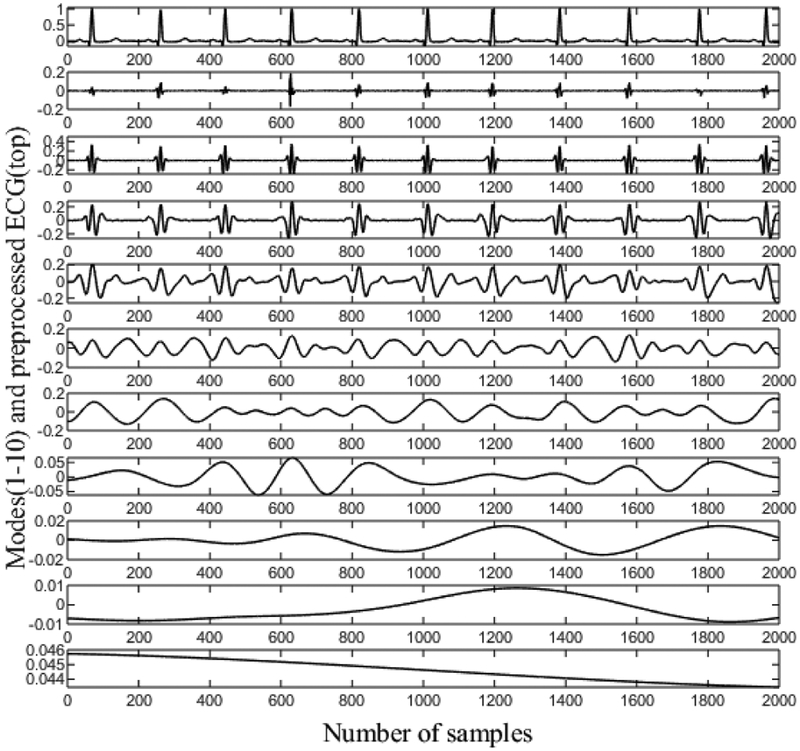
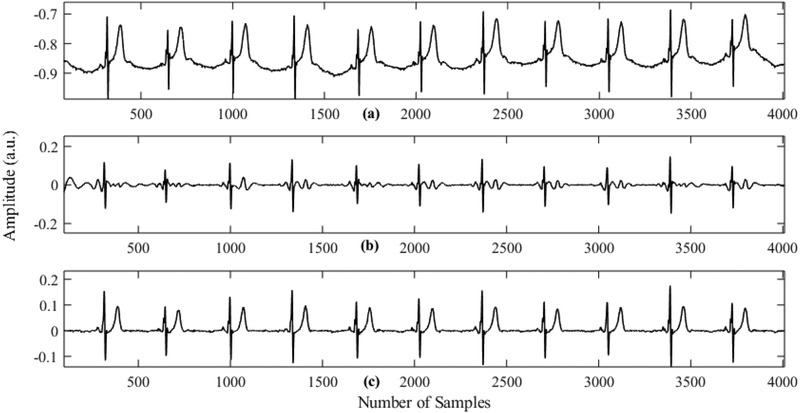
The preprocessed ECG signal is decomposed into a few modes using CEEMDAN. Fig. 3 shows an ECG signal for the subject Sel16273, and all the modes obtained using CEEMDAN decomposition. This figure clearly shows that the first few modes contain the high frequency components of the signal while the last few modes carry the low frequency information of the signal. Therefore, the first few modes are primarily used for QRS detection. It should be noted that the first mode (second row) mostly consists of noise. Thus, we use modes 2–5 to reconstruct the signal for QRS complex detection, and all the modes except the first mode are used to reconstruct the signal for subsequent P-wave detection. As the first mode of CEEMDAN carries the high frequency component and exhibits characteristics of high-frequency noise, reconstruction of the signal by leaving out the first mode improves the SNR significantly. Consequently, further filtering of the signal is not needed. Figs. 4(b) and 4(c) show reconstructed signals for QRS and P-wave detection, respectively. The reconstructed signal for the QRS complex contains mostly high frequency components that resemble QRS components. This kind of reconstruction is very advantageous for QRS detection, especially when large-amplitude T waves are present since T Waves can be falsely detected as QRS complexes by many algorithms. Fig. 4(b) shows the reconstructed signal for QRS complex detection. It should be noted that even though there are many long spiky T waves present in the original ECG, they are highly suppressed in the reconstructed signal. Fig. 4(c) shows the signal reconstruction for P-wave detection, which ignores the first mode in order to have a better SNR; thus, the P waves are more prominent than they are in the raw ECG signal. For this subject (Sele0110), the P waves are of low amplitude and are obscured in the raw ECG, but become more prominent after reconstruction.
Fig. 3.
CEEMDAN decomposition of preprocessed ECG. The first row is the ECG signal which is decomposed into modes.
Fig. 4.
Reconstructed signals for QRS and P wave detection for subject Sele0110. (a) Raw ECG signal. (b) Reconstructed signal for QRS complex detection. (c) Reconstructed signal for P wave detection
3). QRS Detection:
The reconstructed signal yR(t) from modes 2–5 of CEEMDAN decomposition is divided into two signals ypos(t) and yneg (t), i.e.
| (3) |
where
| (4) |
Similarly,
| (5) |
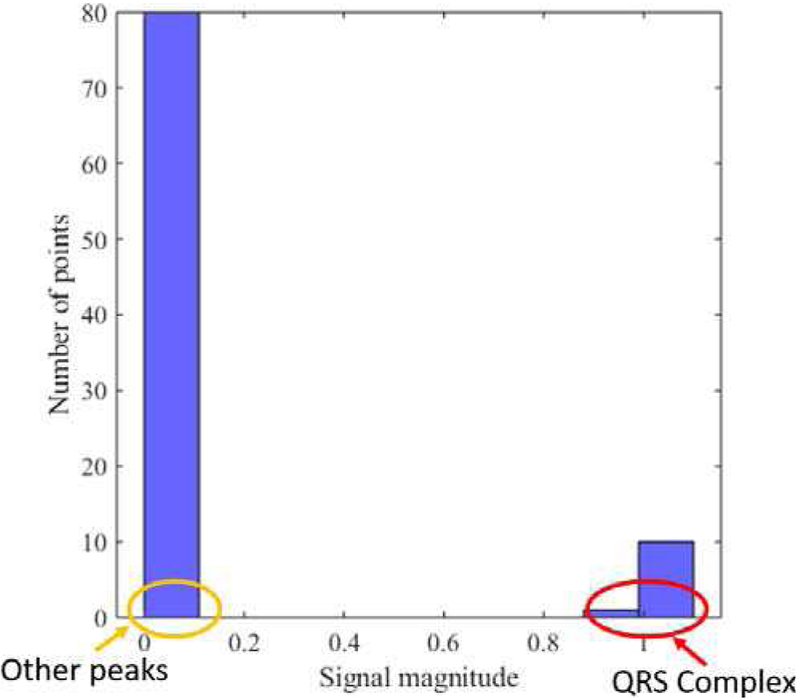
An automatic threshold is next computed for both signals ypos(t) and yneg(t) using a similar approach [16], where a histogram of local maxima is calculated for both signals.
Fig. 5 shows a histogram of local maxima for ypos(t). This figure shows that the QRS amplitude is the most prominent and separable from the other waveforms. From each histogram, a centroid is calculated using the following formula:
| (6) |
where, xi is the signal magnitude (either ypos (t) or yneg (t)) and yi is the distribution values of signals. Finally, the thresholds are defined as T1 = α1Cpos and T2 = α2CNeg, where Cpos and Cneg are the centroids of the histograms computed using the local maxima of ypos(t) and yneg (t), respectively. In our algorithm we chose α1 = α2 = 1 for QRS detection.
Fig. 5.
Histogram of local maxima of ypos for subject Sel16273
Once the thresholds are computed, we search for local maxima in both ypos(t) and yneg(t) that are greater than their respective thresholds. Thus, we generate R-peak candidates from both sides. Then, we combine R-peak candidates in a single array and sort in ascending order. Finally, we remove false R peaks by applying the following criteria:
If two consecutive R peaks are so close that the heart rate (HR) is above 250 bpm, we discard the one with lower amplitude and choose the one with greater amplitude as an R peak.
R peaks that are close and consequently lead to a HR of 150 to 250 bpm, are taken as true R peaks if and only if they satisfy the amplitude threshold of 60% of the mean of R-peak amplitudes.
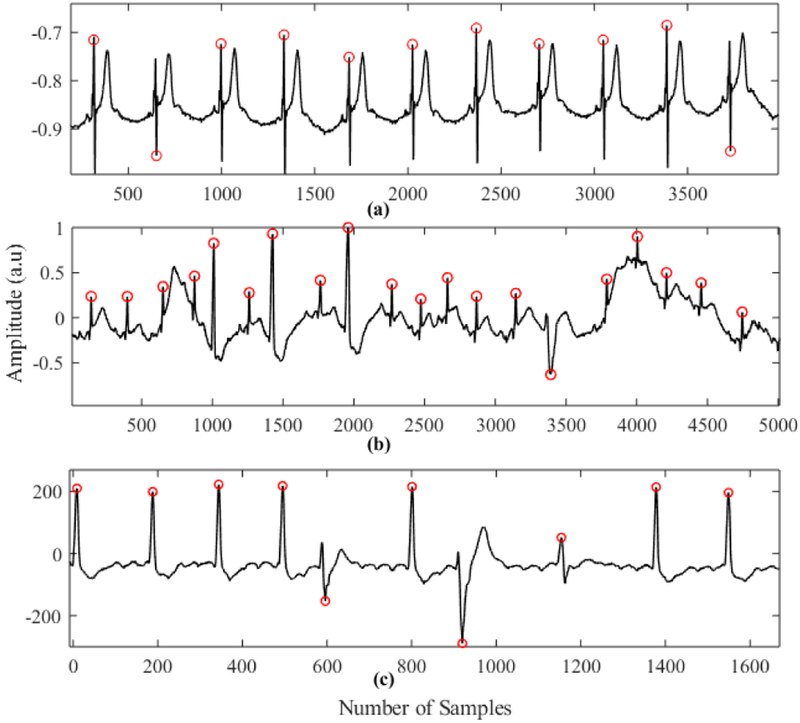
Fig. 6 shows some of the critical cases where our algorithm can successfully detect QRS complexes. Fig. 6(a) shows the case of a spiky long T wave, which sometimes causes false positives for many existing algorithms. Fig. 6 (b) and (c) show the case where there are inconsistent R peaks with low amplitude and high baseline wandering. In each of the cases, the proposed method detected R peaks without any false positives.
Fig. 6.
QRS complex detection on. (a) Subject Sele0110 (QTDB). (b) Subject 228m (MITDB). (c) Subject 210m (MITDB)
4). P Wave Detection:
As stated in the previous section, for P wave detection we reconstruct the signals by taking all modes from CEEMDAN except the first. This is because a P wave amplitude is usually low compared to a QRS complex and it is affected by the filtering procedure. After QRS locations have been determined, the QRS complexes and the first half of each RR interval are removed from the reconstructed signal for P wave detection.
Then we divide the signal into two separate signals which contain positive and negative portions of the original signal, respectively. Then we generate P peak candidates from both sides using a similar approach as the QRS detection in the previous section (except α1 = α2 = 0.5). Finally, we extract true P peak locations using an adaptive heuristic method which is described as follows:
Identify the P peak candidates within each RR interval from both positive and negative sides.
Calculate the PR interval for each candidate and find the deviation from the average PR interval of the previous M (in our case M = 10) P waves.
If, for any candidate, the deviation goes above a threshold (±20samples), it is discarded.
If more than one candidate satisfies the threshold, the one which has the smallest deviation is taken as the true P peak unless, for each of them, deviations are very low (e.g. ± 8samples). In the latter case, the one that has the smallest deviation from the average amplitude of the previous M P waves is taken as the true P peak.
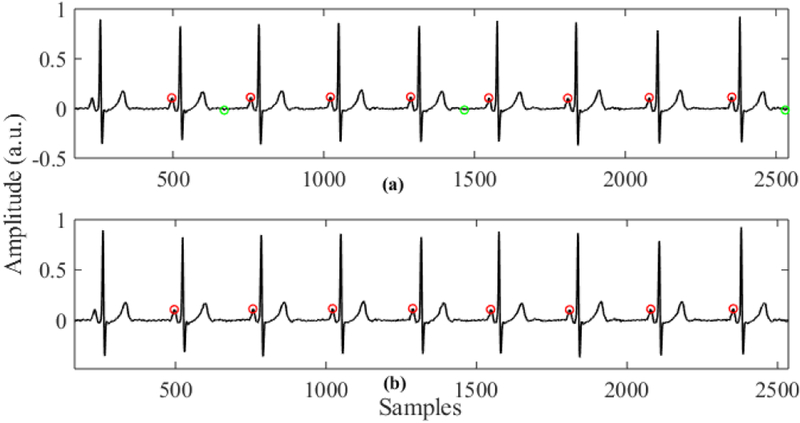
The main advantage of this P wave detection algorithm is that a P wave is detected from both sides (positive and negative) and then they are combined adaptively to find the true P wave. When we detect a P wave from the positive side, the negative amplitudes of the signal are not considered. Thus, if there is any spiky negative peak in the negative side of the signal, which is most likely due to noise, it will not affect the P wave detection, and similarly for the negative side. Finally, we combine P wave candidates adaptively so that the falsely detected peaks get filtered out in this process. Fig. 5 shows sample outputs of our P wave detection algorithm on the subject Sel16272. The red dots in the upper plot represent P peaks detected from the positive side and the green dots represent the P peak candidates detected from the negative side. Fig. 7 (b) shows the true P peaks that are detected after adaptive combining of the P wave candidates.
Fig. 7.
Example of P wave detection on subject Sel16272. (a) P peak candidates from positive and negative side (red and green dots respectively). (b) P peaks after adaptive true peak search.
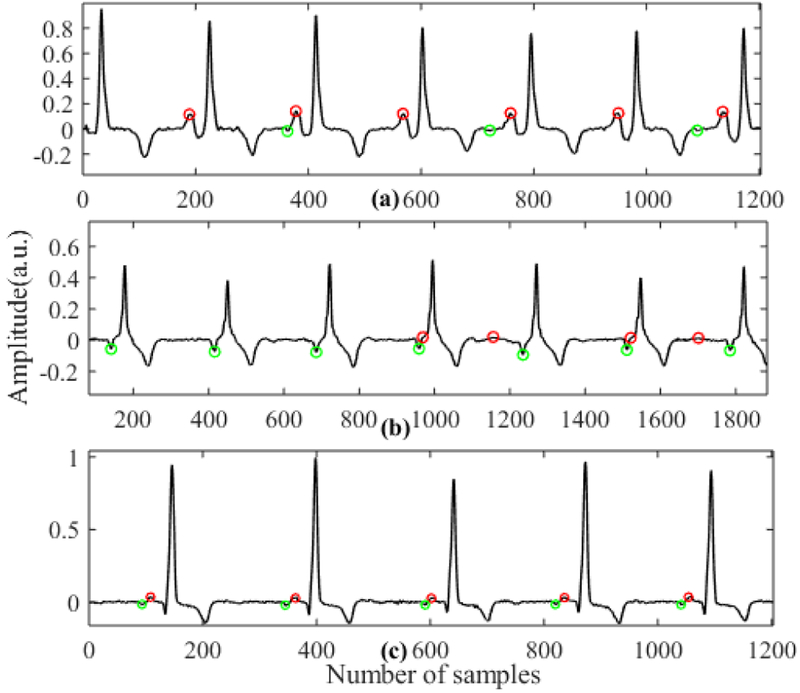
One other advantage of our algorithm is that we can automatically classify P wave types. For example, if the P waves are normal, we get consistent P peaks from the positive side, while for inverted P waves we get consistent P peaks from the negative side. In the case of biphasic P waves, we get P peaks from both sides. Fig. 6 shows P peak candidates in three different cases (normal, inverted and biphasic). Here, red and green dots represent P peaks detected from positive and negative sides, respectively. As we can see, when there are normal P peaks, we get consistent P peak candidates from the positive side (a) and when there are inverted P waves we get P peak candidates from the negative side (b). In the case of biphasic P waves we obtain consistent P peak candidates from both the positive and negative sides (c).
E. Validation
For validation of our algorithm we used the MIT-BIH arrhythmia database (MITDB) and the QT database (QTDB), which are both publicly available. We used the MITDB for QRS detection validation only and the QTDB for both QRS and P wave detection validation.
In order to make a fair comparison of our proposed method with the published methods, we only used the first channel of each recording for QRS detection. It should be noted that we excluded the ventricular flutter beats present in recording 207, as mentioned in other works [15]. For QRS complex detection in QTDB, we used 80 recordings (86,989 beats) and for P wave detection, we used 97 annotated recordings (3,194 beats). For QRS detection on QTDB, again, we only used the first channel in order to compare our algorithm with the published works. For P wave detection we only considered those data where annotations were available. In the case of P wave detection, we considered the detected P wave as a true positive only if it was within the annotated boundary of P onsets and offsets. As already mentioned previously, QTDB has only 11 records for which there are two different set of annotations. The rest of the records have only one set of annotations (ref1). Therefore, in order to be consistent, we only used the first annotations. Our proposed algorithm for P wave detection works for only one lead while the annotations were performed using all available leads. Therefore, in order to compare our automatic P wave detection with the manual annotations, we get P peak location using both channels and finally for each point we chose the channel that gives less deviation from manual annotations in P peak position.
In order to asses QRS detection performance, we calculated the total number of false positives (FP), false negatives (FN), and true positives (TP) and defined the following parameters.
| (7) |
| (8) |
| (9) |
| (10) |
III. Results
The performance of our proposed QRS and P wave detection methods are given in Tables 1 and 2, respectively. For QRS detection the entire data were used to evaluate the algorithm’s performance.
TABLE I.
QRS Detection Performance Comparison on MITDB and QTDB
| QRS detector | #annotations | TP | FP | FN | % error | Se% | PPV% | |
|---|---|---|---|---|---|---|---|---|
| QTDB | Proposed Method | 86989 | 86959 | 65 | 30 | 0.11 | 99.97 | 99.93 |
| Gaffari et.al [14] | 86892 | 86854 | 70 | 38 | 0.12 | 99.96 | 99.92 | |
| Martinez et.al [15] | 86892 | 86819 | 94 | 47 | 0.15 | 99.92 | 99.89 | |
| Qin et.al [30] | 86995 | 86848 | 91 | 147 | 0.37 | 99.83 | 99.9 | |
| Moody et.al [37] | 86892 | 84458 | 459 | 2434 | 3.33 | 97.2 | 99.46 | |
| MITDB | Proposed Method | 109441 | 109395 | 122 | 46 | 0.15 | 99.96 | 99.89 |
| Bashar et.al [31] | 109457 | 109391 | 55 | 66 | 0.11 | 99.94 | 99.95 | |
| Gaffari et.al [14] | 109428 | 109367 | 89 | 61 | 0.14 | 99.94 | 99.91 | |
| Martinez et.al [15] | 109428 | 109208 | 153 | 220 | 0.34 | 99.8 | 99.86 | |
| Li et.al [32] | 104182 | 104070 | 65 | 112 | 0.17 | 99.89 | 99.94 | |
| Hamilton et.al [33] | 109267 | 108927 | 248 | 340 | 0.54 | 99.69 | 99.77 | |
| Pan et.al [21] | 109809 | 109532 | 507 | 277 | 0.71 | 99.75 | 99.54 | |
| Afonso et.al [34] | 90909 | 90535 | 406 | 374 | 0.86 | 99.59 | 99.56 |
TABLE II.
P Wave Detection Performance Comparison on QTDB
| Method | annotations | Se% | PPV% | F1 | Accuracy % | m ± s |
|---|---|---|---|---|---|---|
| Proposed method | 3194 | 99.75 | 99.47 | 99.61 | 99.22 | 3.87 ± 11.61 |
| Ghaffari et.al[14] | NA | 99.64 | 99.00 | 99.32 | NA | 3.6 ± 7.7 |
| Sayadi et.al [10] | 3194 | 98.04 | 98.63 | 98.33 | 96.67 | 7.22 ± 9.84 |
| Panigrahy et.al [11] | 3194 | 99.34 | 99.53 | 99.44 | 98.88 | 3.61 ± 4.9 |
| Lin et.al [9] | 3176 | 98.93 | 97.40 | 98.16 | NA | 4.1 ± 8.6 |
| Bote et.al [12] (High accuracy mode) |
NA | 99.34 | 95.11 | 97.18 | NA | 13.8 ± 8.8 |
| Rincón et. Al [13] | NA | 99.87 | 92.46 | 96.02 | NA | 10.1 ± 8.9 |
| Martinez at.al[15] | 3194 | 98.87 | 91.03 | 94.79 | 89.9 | 3.6 ± 13.2 |
| Laguna et.al [5] | N/A | 97.7 | 91.17 | 94.32 | 88.87 | 4.8 ± 10.6 |
| Lenis et.al [35] | 3194 | 100 | 88.15 | 93.7 | 88.15 | 3.6 ± 13.2 |
| Dubois et.al [36] | 3194 | 80.9 | 91.17 | 85.73 | 72.07 | 15.5 ± 12.2 |
For the MITDB, our proposed QRS detector has the highest sensitivity (99.96%) among the published works. The PPV and percentage of error are 99.89% and 0.15%, respectively. Most of the false positives were due to spiky high frequency noise and low amplitude R peaks. For the QTDB, our proposed algorithm is again found to be the most accurate in QRS detection among the published works. In the QTDB, the QRS detector has a sensitivity of 99.97%, positive predictivity (PPV) of 99.93%, and error rate of 0.11%. It is found to be very effective in detecting QRS complexes even when there are some challenging scenarios including a low amplitude QRS complex and in the presence of tall and spiky T waves.
For P wave detection evaluation, we compared our proposed method with other published methods in terms of sensitivity (Se), positive predictivity (PPV), detection accuracy, F1 score, and mean (m) and standard deviation of the difference between annotated time and the algorithm’s detected time for P peaks. Table 2 shows the performance of P-wave detection for the proposed algorithm. Our P wave detection method has a sensitivity of 99.75%, PPV of 99.47%, accuracy 99.22%, and F1 score of 99.61%. Overall performance of the proposed P wave detection method was better than any other published P wave detection algorithm, as shown in Table 2.
A. Noise
In order to evaluate the performance of the proposed algorithm under noisy conditions, we applied our proposed method on MIT-BIH Noise Stress Test Database. Again, to be consistent we used only lead II for QRS complex detection. Table 3 shows performance of our QRS complex detection method and comparison with the performance of one other reported work [11]. It can be seen from the table that proposed method has detected QRS detection with pretty high accuracy even in significantly noisy conditions. The sensitivity of QRS detection remains fairly constant but PPV value decreases slightly as noise level increase (e.g. after 6 dB SNR). This is for the fact that increased amount of noise leads to more false positives.
TABLE III.
QRS Complex Detection Result on MIT-BIH noise Stress Test Database
| Method | Parameter | SNR (dB) | |||||
|---|---|---|---|---|---|---|---|
| 24 | 18 | 12 | 6 | 0 | −6 | ||
| Proposed | Beats | 4268 | |||||
| Method | Se (%) | 100 | 100 | 100 | 99.88 | 99.25 | 98.99 |
| PPV (%) | 99.98 | 99.98 | 99.33 | 95.99 | 90.05 | 89.60 | |
| Bote et.al[12] | Beats | 2303 | |||||
| Se (%) | 99 | 99 | 99.1 | 99.2 | 99.2 | 98.2 | |
| PPV (%) | 99.9 | 99.9 | 99.4 | 91.7 | 79.8 | 76.6 | |
IV. Discussion
The detection of QRS complex and P wave from the ECG signal are very useful for identification of different cardiac arrythmias (e.g. Afib, PAC, PVC etc.). In this work we proposed a novel method which can accurately detect QRS complex and P wave in ECG signal. This paper introduced the idea of detecting QRS complex and P wave from both negative and positive amplitude of ECG signals, and an adaptive P wave search approach which significantly improved the detection performance especially for P wave detection. The major challenge in QRS complex detection appears when there are very low amplitude QRS complex which are difficult to detect or long spiky T wave which are falsely detected as R peak sometimes. Our idea of QRS complex detection from both sides ensures the detection of even very low amplitude QRS complex. Also, our reconstruction strategy from CEEMDAN decomposition provides significant advantages against long spiky T wave as shown in fig. 3. Major advantages of using CEEMDAN is that it is data driven whereas wavelets transformation is sensitive to intra-subject and inter-subject variations. Even though EMD can be little bit faster than CEEMDAN and can be used for decomposing the ECG signal as well, its ‘mode mixing’ problem makes it less suitable for this purpose.
Detection of P wave is more challenging compared to QRS complex as the amplitude of P wave is very low and contaminated by different noises. Different methods like Differential evolution strategy [11], extended Kalman filter [10], wavelet transform [13], low pass differentiation (LPD) [5], phase free stationary wavelet transform [31], Gaussian mesa function models and nonlinear probability estimator [32] have been proposed to detect P wave from ECG signals. Even though some of them showed pretty good accuracy in P wave detection, they are computationally expensive, while many of them requires prior information about ECG and need training period. Besides, most of P wave detection algorithm were tested on normal sinus rhythm. Therefore, whenever they are applied on some ECGs with arrhythmias where there should be no P wave (e.g. Afib), they always detect so many P waves falsely due to noise. The proposed method uses adaptive P wave search where only consistent P waves are taken as true P waves. This process filters out wrongly detected P waves. Thus, proposed P wave detection can be potentially used to differentiate AF subjects from non-AF subjects especially when there are PAC/PVC subjects which have similar irregularity in RR interval like AF subjects but contains P waves with every regular beat. A slight modification in the P wave detection algorithm can be applied to detect multiple P waves in ECGs (e.g. Atrial flutter).
The idea of detecting QRS complex and P wave from positive and negative amplitude signals, removing false QRS complex using different criteria and using adaptive P wave search approach, improves the detection performance under noisy conditions. The performance of our QRS complex detection algorithm on the MIT-BIH Noise Stress Test Database shows that it can detect QRS complex with a pretty good accuracy even in noisy conditions.
The proposed method showed good performance for both QRS complex and P wave detection. QRS detection, on a total of 196,430 annotated beats (including both MITDB and QTDB), resulted in a sensitivity of 99.96%, PPV of 99.9%, and percentage of error of 0.13%. For P wave detection, our algorithm showed better performance than most other compared methods. The proposed algorithm for P wave detection resulted in a sensitivity of 99.75% with a mean P peak detection error of approximately one sample (4 ms) and standard deviation less than or equal to 3 samples. Our approach also showed effective P wave detection for different P wave types (i.e. normal, inverted and biphasic). Moreover, the adaptive search for true P peaks used in this work was effective in reducing the number of false positives to a great extent.
There are few limitations in our proposed method which we observed so far. One limitation is that we chose typical peak value around the P wave as the P peak which may not be necessarily true always. We think this can be one reason why mean and standard deviation of P peak detection error is slightly worse than some of the published works. Secondly, even though our QRS detection achieved highest sensitivity (99.96%) among the published works in MITDB, it also detected more false positives (122) than some of the published methods. One possible reason for this can be that we developed our QRS and P wave detection algorithm based on QTDB, and while evaluating performance on MITDB we did not tune our algorithm any further.
V. Conclusion
In this paper we presented a CEEMDAN-based QRS and P wave detector. Reconstruction of the signals for QRS and P wave detection using different subsets of modes from CEEMDAN allowed better detection of these waveforms. We introduced the idea of P wave detection from both sides (positive and negative) and adaptive P peak search, which also enabled significant improvement in P-wave detection accuracy when compared to other published algorithms. We validated our QRS detection on a total of 196,430 annotated beats and P wave detection on 3,194 beats. In both cases, we obtained promising results. In many cases, especially in P wave detection, our algorithm performed significantly better than the published algorithms. Moreover, we showed that our P wave detection algorithm can identify different types of P waves and automatically differentiate them. Future studies should apply our novel algorithm to improve arrhythmia detection, for example P wave detection can potentially be used to differentiate irregular RR intervals as atrial fibrillation (if no P waves are present) or premature atrial or ventricular beasts (irregular beats among normal sinus beats with P waves), or estimation of PR intervals used for diagnosis of either AV delay, AV block, or ventricular pre-excitation.
Fig. 8.
P wave candidates detected for different types of P waves. (a) Normal P wave. (b) Inverted P wave. (c) Biphasic P wave (Red dot represents P-wave candidates from positive side and green dot represents P-wave candidates from the negative side.)
Acknowledgments
This work was supported by NIH under Grant R01 HL136660.
Biographies

MD BILLAL HOSSAIN received the B.S. degree in electrical and electronic engineering from the Bangladesh University of Engineering and Technology. He is currently pursuing the Ph.D. degree with the University Connecticut, Storrs, CT, USA.

SYED KHAIRUL BASHAR received the B.S. degree in electrical and electronic engineering from the Bangladesh University of Engineering and Technology. He is currently pursuing the Ph.D. degree with the University of Connecticut, Storrs, CT, USA.
ALLAN J. WALKEY is currently an Assistant Professor of medicine with the Boston University School of Medicine. His research interests involve cardiac complication of critical illness, critical care epidemiology, and comparative effectiveness research methodology.
DAVID D. MCMANUS is currently an Associate Professor of medicine with the University of Massachusetts Medical School, Worcester, MA, USA. His clinical interests include arrhythmia ablation, brady and tachyarrhythmias, and cardiac devices.
KI H. CHON received the B.S. degree in electrical engineering from the University of Connecticut, Storrs, CT, USA, the M.S. degree in biomedical engineering from the University of Iowa, Iowa City, and the M.S. degree in electrical engineering and the Ph.D. degree in biomedical engineering from the University of Southern California, Los Angeles. He is currently the John and Donna Krenicki Chair Professor and the Head of biomedical engineering with the University of Connecticut.
He is a Co-Founder of Mobile Sense Technologies, which is located at the TIP Center, Farmington, CT, USA. The company has recently been granted both NIH and NSF SBIR grants. He is a Fellow of the American Institute of Medical and Biological Engineering and the International Academy of Medical and Biological Engineering. He has chaired many international conferences, including his role as the Program Co-Chair for the IEEE EMBS Conference in NYC, in 2006, and as the Conference Chair for the 6th International Workshop on Biosignal Interpretation in New Haven, CT, USA, in 2009. Hewas an Associate Editor of the IEEE TRANSACTIONSON BIOMEDICAL ENGINEERING, from 2007 to 2013.
References
- [1].January CT et al. , “2014 AHA/ACC/HRS Guideline for the Management of Patients With Atrial Fibrillation: Executive Summary: A Report of the American College of Cardiology/American Heart Association Task Force on Practice Guidelines and the Heart Rhythm Society,” J. Am. Coll. Cardiol, vol. 64, no. 21, pp. 2246–2280, December. 2014. [DOI] [PubMed] [Google Scholar]
- [2].Mozaffarian D et al. , “Heart disease and stroke statistics–2015 update: a report from the American Heart Association,” Circulation, vol. 131, no. 4, pp. e29–322, January. 2015. [DOI] [PubMed] [Google Scholar]
- [3].Chong JW, Esa N, McManus D, and Chon K, “Arrhythmia Discrimination using a Smart Phone,” IEEE J. Biomed. Health Inform, pp. 1–1, 2015. [DOI] [PMC free article] [PubMed] [Google Scholar]
- [4].Thakor NV and Zhu YS, “Applications of adaptive filtering to ECG analysis: noise cancellation and arrhythmia detection,” IEEE Trans. Biomed. Eng, vol. 38, no. 8, pp. 785–794, August. 1991. [DOI] [PubMed] [Google Scholar]
- [5].Laguna P, Jané R, and Caminal P, “Automatic detection of wave boundaries in multilead ECG signals: validation with the CSE database,” Comput. Biomed. Res. Int. J, vol. 27, no. 1, pp. 45–60, February. 1994. [DOI] [PubMed] [Google Scholar]
- [6].Trahanias P and Skordalakis E, “Syntactic Pattern Recognition of the ECG,” IEEE Trans Pattern Anal Mach Intell, vol. 12, pp. 648–657, 1990. [Google Scholar]
- [7].Sternickel K, “Automatic pattern recognition in ECG time series,” Comput. Methods Programs Biomed, vol. 68, no. 2, pp. 109–115, May 2002. [DOI] [PubMed] [Google Scholar]
- [8].Dumont Ast J, Hernández AI, and Carrault G, “Improving ECG beats delineation with an evolutionary optimization process,” IEEE Trans. Biomed. Eng, vol. 57, no. 3, pp. 607–615, March. 2010. [DOI] [PubMed] [Google Scholar]
- [9].Lin C, Mailhes C, and Tourneret J-Y, “P- and T-wave delineation in ECG signals using a Bayesian approach and a partially collapsed Gibbs sampler,” IEEE Trans. Biomed. Eng, vol. 57, no. 12, pp. 2840–2849, December. 2010. [DOI] [PubMed] [Google Scholar]
- [10].Sayadi O and Shamsollahi MB, “A model-based Bayesian framework for ECG beat segmentation,” Physiol. Meas, vol. 30, no. 3, pp. 335–352, February. 2009. [DOI] [PubMed] [Google Scholar]
- [11].Panigrahy D and Sahu PK, “P and T wave detection and delineation of ECG signal using differential evolution (DE) optimization strategy,” Australas. Phys. Eng. Sci. Med, vol. 41, no. 1, pp. 225–241, March. 2018. [DOI] [PubMed] [Google Scholar]
- [12].Bote JM, Recas J, Rincón F, Atienza D, and Hermida R, “A Modular Low-Complexity ECG Delineation Algorithm for Real-Time Embedded Systems,” IEEE J. Biomed. Health Inform, vol. 22, no. 2, pp. 429–441, March. 2018. [DOI] [PubMed] [Google Scholar]
- [13].Rincón F, Recas J, Khaled N, and Atienza D, “Development and Evaluation of Multilead Wavelet-Based ECG Delineation Algorithms for Embedded Wireless Sensor Nodes,” IEEE Trans. Inf. Technol. Biomed, vol. 15, no. 6, pp. 854–863, November. 2011. [DOI] [PubMed] [Google Scholar]
- [14].Ghaffari A, Homaeinezhad MR, Khazraee M, and Daevaeiha MM, “Segmentation of Holter ECG Waves Via Analysis of a Discrete Wavelet-Derived Multiple Skewness–Kurtosis Based Metric,” Ann. Biomed. Eng, vol. 38, no. 4, pp. 1497–1510, April. 2010. [DOI] [PubMed] [Google Scholar]
- [15].Martinez JP, Almeida R, Olmos S, Rocha AP, and Laguna P, “A wavelet-based ECG delineator: evaluation on standard databases,” IEEE Trans. Biomed. Eng, vol. 51, no. 4, pp. 570–581, April. 2004. [DOI] [PubMed] [Google Scholar]
- [16].Yochum M, Renaud C, and Jacquir S, “Automatic detection of P, QRS and T patterns in 12 leads ECG signal based on CWT,” Biomed. Signal Process. Control, vol. 25, pp. 46–52, March. 2016. [Google Scholar]
- [17].Arzeno NM, Deng Z-D, and Poon C-S, “Analysis of First-Derivative Based QRS Detection Algorithms,” IEEE Trans. Biomed. Eng, vol. 55, no. 2, pp. 478–484, February. 2008. [DOI] [PMC free article] [PubMed] [Google Scholar]
- [18].Arbateni K and Bennia A, “Sigmoidal radial basis function ANN for QRS complex detection,” Neurocomputing, vol. 145, pp. 438–450, December. 2014. [Google Scholar]
- [19].Xing H and Huang M, “A New QRS Detection Algorithm Based on Empirical Mode Decomposition,” in 2008 2nd International Conference on Bioinformatics and Biomedical Engineering, 2008, pp. 693–696. [Google Scholar]
- [20].de Lannoy G, Frenay B, Verleysen M, and Delbeke J, “Supervised ECG Delineation Using the Wavelet Transform and Hidden Markov Models,” in 4th European Conference of the International Federation for Medical and Biological Engineering, 2009, pp. 22–25. [Google Scholar]
- [21].Pan J and Tompkins WJ, “A Real-Time QRS Detection Algorithm,” IEEE Trans. Biomed. Eng, vol. BME-32, no. 3, pp. 230–236, March. 1985. [DOI] [PubMed] [Google Scholar]
- [22].Goldberger Ary L et al. , “PhysioBank, PhysioToolkit, and PhysioNet,” Circulation, vol. 101, no. 23, pp. e215–e220, June. 2000. [DOI] [PubMed] [Google Scholar]
- [23].Moody GB and Mark RG, “The impact of the MIT-BIH Arrhythmia Database,” IEEE Eng. Med. Biol. Mag, vol. 20, no. 3, pp. 45–50, May 2001. [DOI] [PubMed] [Google Scholar]
- [24].Laguna P, Mark RG, Goldberg A, and Moody GB, “A database for evaluation of algorithms for measurement of QT and other waveform intervals in the ECG,” in Computers in Cardiology 1997, 1997, pp. 673–676. [Google Scholar]
- [25].Moody GB, Muldrow WE, Mark RG., “A noise stress test for arrhythmia detectors. Computers in Cardiology 1984;,” Comput. Cardiol 1984, vol. 11, pp. 381–384. [Google Scholar]
- [26].Huang Norden E et al. , “The empirical mode decomposition and the Hilbert spectrum for nonlinear and non-stationary time series analysis,” Proc. R. Soc. Lond. Ser. Math. Phys. Eng. Sci, vol. 454, no. 1971, pp. 903–995, March. 1998. [Google Scholar]
- [27].Wu Z and Huang NE, “Ensemble empirical mode decomposition: a noise-assisted data analysis method,” Adv. Adapt. Data Anal, vol. 01, no. 01, pp. 1–41, January. 2009. [Google Scholar]
- [28].Torres ME, Colominas MA, Schlotthauer G, and Flandrin P, “A complete ensemble empirical mode decomposition with adaptive noise,” in 2011 IEEE International Conference on Acoustics, Speech and Signal Processing (ICASSP), 2011, pp. 4144–4147. [Google Scholar]
- [29].Awodeyi AE, Alty SR, and Ghavami M, “Median Filter Approach for Removal of Baseline Wander in Photoplethysmography Signals,” in 2013 European Modelling Symposium, 2013, pp. 261–264. [Google Scholar]
- [30].Qin Q, Li J, Yue Y, and Liu C, “An Adaptive and Time-Efficient ECG R-Peak Detection Algorithm,” Journal of Healthcare Engineering, 2017. [Online]. Available: https://www.hindawi.com/journals/jhe/2017/5980541/. [Accessed: 14-May-2019]. [DOI] [PMC free article] [PubMed]
- [31].Bashar SK, Noh Y, Walkey AJ, McManus DD, and Chon KH, “VERB: VFCDM-Based Electrocardiogram Reconstruction and Beat Detection Algorithm,” IEEE Access, vol. 7, pp. 13856–13866, 2019. [DOI] [PMC free article] [PubMed] [Google Scholar]
- [32].Li Cuiwei, Zheng Chongxun, and Tai Changfeng, “Detection of ECG characteristic points using wavelet transforms,” IEEE Trans. Biomed. Eng, vol. 42, no. 1, pp. 21–28, January. 1995. [DOI] [PubMed] [Google Scholar]
- [33].Hamilton PS and Tompkins WJ, “Quantitative Investigation of QRS Detection Rules Using the MIT/BIH Arrhythmia Database,” IEEE Trans. Biomed. Eng, vol. BME-33, no. 12, pp. 1157–1165, December. 1986. [DOI] [PubMed] [Google Scholar]
- [34].Afonso VX, Tompkins WJ, and N. TQ and, “ECG beat detection using filter banks,” IEEE Trans. Biomed. Eng, vol. 46, no. 2, pp. 192–202, February. 1999. [DOI] [PubMed] [Google Scholar]
- [35].Lenis G, Pilia N, Oesterlein T, Luik A, Schmitt C, and Dössel O, “P wave detection and delineation in the ECG based on the phase free stationary wavelet transform and using intracardiac atrial electrograms as reference,” Biomed. Tech. (Berl), vol. 61, no. 1, pp. 37–56, February. 2016. [DOI] [PubMed] [Google Scholar]
- [36].Dubois R, Maison-Blanche P, Quenet B, and Dreyfus G, “Automatic ECG wave extraction in long-term recordings using Gaussian mesa function models and nonlinear probability estimators,” Comput. Methods Programs Biomed, vol. 88, no. 3, pp. 217–233, December. 2007. [DOI] [PubMed] [Google Scholar]
- [37].Moody GB, and Mark RG., “Development and evaluation of a 2-lead ECG analysis program,” The Proceeding Computer in Cardiology, pp. 185–188,1982. [Google Scholar]


