

Abstract
Sphingolipids have been implicated in the etiology of chronic metabolic diseases. Here, we investigated whether sphingolipid biosynthesis is associated with the development of adipose tissues and metabolic diseases. SPTLC2, a subunit of serine palmitoyltransferase, was transcriptionally upregulated in the adipose tissues of obese mice and in differentiating adipocytes. Adipocyte-specific SPTLC2-deficient (aSPTLC2 KO) mice had markedly reduced adipose tissue mass. Fatty acids that were destined for the adipose tissue were instead shunted to liver and caused hepatosteatosis. This impaired fat distribution caused systemic insulin resistance and hyperglycemia, indicating severe lipodystrophy. Mechanistically, sphingosine 1-phosphate (S1P) was reduced in the adipose tissues of aSPTLC2 KO mice, and this inhibited adipocyte proliferation and differentiation via the downregulation of S1P receptor 1 and decreased activity of the peroxisome proliferator–activator receptor γ. In addition, downregulation of SREBP (sterol regulatory element–binding protein)-1c prevented adipogenesis of aSPTLC2 KO adipocytes. Collectively, our observations suggest that the tight regulation of de novo sphingolipid biosynthesis and S1P signaling plays an important role in adipogenesis and hepatosteatosis.
Introduction
Overnutrition and a sedentary lifestyle are the major factors in the etiology of obesity and metabolic dysfunctions such as insulin resistance and cardiovascular diseases (1–3). White adipose tissue (WAT) stores lipids, and the spillover of excess fat from the WAT elevates plasma fatty acids (FA). As a result, ectopic lipids accumulated in peripheral organs including liver cause steatosis and insulin resistance (4). In various reports of obese human and animal models, hepatosteatosis and insulin resistance have been found concomitantly, and altered fat distribution between adipose tissues and peripheral organs has been suggested as a major cause for development of metabolic dysfunction (5–7).
Adipogenesis is a complex event, involving the activation of transcription factors that induce the expression of numerous genes responsible for the development of mature adipocytes (8). Among the various signaling lipid metabolites, ceramides are known to be important sphingolipid intermediates and precursors of complex sphingolipids. The inhibition of de novo sphingolipid biosynthesis improves disease conditions such as atherosclerosis, steatosis, insulin resistance, and cardiomyopathy (9–12). The involvement of sphingolipids in particular diseases has been validated by pharmacological or genetic inhibition of serine palmitoyltransferase (SPT) (9–12). SPT is composed of several subunits, including SPTLC1, SPTLC2, and SPTLC3, and catalyzes the condensation of l-serine and palmitoyl CoA. Since only SPTLC2 and SPTLC3 have a pyridoxal phosphate–binding domain, these are known to be the catalytic subunits (13). However, since SPT catalyzes the first step of de novo sphingolipid synthesis, it is difficult to ascertain which of the various downstream sphingolipids are directly involved in the etiology of specific metabolic diseases. Therefore, the steps closer to ceramide have been studied to demonstrate the direct involvement of ceramide or sphingosine 1-phosphate (S1P) in hepatosteatosis and insulin resistance (14,15). Ceramide uses FA as precursors and interferes with insulin signaling pathways, thereby leading to insulin resistance.
S1P is an important lysophospholipid synthesized by the sphingosine kinases (SPHK) from sphingosine and ATP (16). S1P acts as a ligand for a family of G-protein receptors (S1PR1–S1PR5), the binding of which transmits the signal to initiate intracellular events. Recently, the involvement of S1P and S1PRs in proliferation and differentiation of adipocytes has been demonstrated (17). During the differentiation of 3T3-L1 cells and adipose tissue from ob/ob mice, SPHK1 and SPHK2, two isotypes of sphingosine kinase, were transcriptionally upregulated and cellular S1P levels increased (18). From these reports (17,18), S1P signaling is implicated in the proliferation and differentiation of adipocytes.
In this study, we investigated whether de novo sphingolipid biosynthesis is associated with the differentiation of adipocytes. We also examined whether adipocyte-specific SPTLC2-deficient (aSPTLC2 KO) mice display impaired adipose tissue development and altered systemic fat distribution. These models revealed direct involvement of sphingolipid metabolites in adipocyte proliferation and differentiation. Thus, these results suggest that de novo sphingolipid biosynthesis is critical for the proliferation and differentiation of adipocytes via S1P.
Research Design and Methods
Animal Studies
Adiponectin-Cre mice were crossed with floxed SPTLC2 mice to generate the aSPTLC2 KO mice. All mice were given water and chow (normal chow diet [NCD]: PicoLab 5053, LabDiet; 45% kcal high-fat diet [HFD]: D12451, Research Diet; and 60% kcal HFD: D12492, Research Diet) ad libitum in a specific pathogen-free facility at the Gachon Center for Animal Care and Use (12:12-h light:dark cycle). All experimental procedures were approved by the Gachon University Institutional Animal Care and Use Committee.
Hyperinsulinemic-Euglycemic Clamp
Hyperinsulinemic-euglycemic clamp studies were conducted for 120 min with a primed/continuous infusion of human insulin (21.4 mU/kg during priming and 3 mU/kg/min during infusion; Eli Lilly) and a variable infusion of 20% dextrose to maintain euglycemia (∼130 mg/dL) as described previously with modifications (19).
Ex Vivo FA Oxidation Rate and Ex Vivo FA Uptake Rate
For measurement of FA oxidation rate, the liver tissues (∼20 mg) were removed from mice and placed in 50-mL flasks fitted with center wells to trap 14CO2 generated from oxidation of [1-14C]oleic acid (PerkinElmer) as previously described (20). For measurement of FA uptake rate, freshly isolated liver tissue (∼20 mg) was incubated with [9,10-3H]-2-bromopalmitic acid (American Radiolabeled Chemicals). Then, the radioactive signals in the extracted organic phase were measured by β-counter as previously described (21).
Stromal Vascular Fraction Isolation and Adipocyte Differentiation
Stromal vascular fraction (SVF) isolation was performed as previously described (22). Briefly, epididymal WAT was washed with PBS, minced, and digested with type 1 collagenase (Worthington Biochemical Corp.) in DMEM. An equivalent volume of DMEM containing 10% FBS was added to the homogenate, and the digested tissue was filtered through a 100-μm strainer. The filtrate was centrifuged at 470g for 15 min at 4°C. SVF and matured fraction were prepared from the resulting pellet and surface layer, respectively.
Cell Culture
Mouse 3T3-L1 cells were grown in DMEM supplemented with 10% bovine calf serum. Two days after the cells reached confluence (day 0), differentiation of the 3T3-L1 cells was induced in DMEM containing 10% FBS, methylisobutylxanthine (520 μmol/L), dexamethasone (1 μmol/L), and insulin (167 nmol/L) for 48 h. The culture medium was replaced on alternate days with DMEM containing 10% FBS and 167 nmol/L insulin.
Transient Transfection and Reporter Gene Assay
AML-12 cells were transiently transfected with vectors containing peroxisome proliferator–activated receptor response element (PPRE)-x3-TK-Luc (plasmid 1015; Addgene) (23) constructs using Lipofectamine 2000 (Invitrogen). pTK-RL, an expression vector for Renilla luciferase, was used to normalize transfection efficiency.
RNA Preparation and Quantitative Real-time PCR
Total RNA was isolated from 3T3-L1 cells or liver tissues, and subsequently, synthesized complementary DNA was analyzed to determine gene expression. Primer sequences used in this study are provided in Supplementary Table 1.
Immunoblot Analyses
Tissues or cells were homogenized in cell lysis buffer. Thirty micrograms of protein were used for immunoblotting as previously described (24). The blots were developed with enhanced chemiluminescent substrate (Millipore, Billerica, MA) and detected by the FUSION SOLO chemiluminescent imaging analyzer (Vilber Lourmat, Eberhardzell, Germany).
Construction of Lentivirus and Stable Cell Line
Mouse cDNA of SPTLC2 and sterol regulatory element–binding protein (SREBP)-1c (Open Biosystems, Lafayette, CO) was cloned into the pLenti7.3/V5 vector (Invitrogen). 293FT cells were grown in DMEM supplemented with 10% FBS. The lentiviral vector and packaging plasmids were transfected into 293FT cells using Lipofectamine 2000 (Invitrogen). Two days after transfection, the lentiviral supernatant was collected and used to infect the target 3T3-L1 cells. Puromycin was treated after 3 days of infection. Selected cells were grown in new media.
Measurement of Metabolites
Blood glucose levels, plasma, and hepatic triglyceride (TG), cholesterol, HDL, LDL, and nonesterified FA were measured as described previously (24). Sphingolipid levels in plasma and tissues were measured by liquid chromatography–tandem mass spectrometry (LC-MS/MS) as previously described (24).
Histology
The livers were isolated and frozen in optimal cutting temperature compound embedding medium. Adipose tissues were isolated and fixed in 10% buffered formalin for 24 h. Paraffin-embedded or frozen tissue 5-μm sections were stained with hematoxylin-eosin (H-E) (Sigma-Aldrich) or stained with Oil red O. Macrophages were detected with F4/80 antibody.
Statistical Analysis
Results are shown as mean ± SEM. Differences between groups were determined by the two-tailed unpaired Student t test. P < 0.05 was considered statistically significant.
Results
De Novo Sphingolipid Biosynthesis Is Upregulated in Adipose Tissues In Obese Conditions and During Adipocyte Differentiation
Since FA is a substrate for sphingolipid biosynthesis, we questioned whether sphingolipid metabolism is altered in epididymal WAT derived from mice fed an HFD. Eight weeks of 60% HFD feeding resulted in the upregulation of SPTLC2, SPHK1, alkaline ceramidase (aCer)2, aCer3, ceramide synthase (CerS)2, and dihydroceramide desaturase 1 (DES1) in WAT (Fig. 1A). Notably, the elevated SPTLC2 mRNA and protein indicate the activation of de novo sphingolipid biosynthesis, and the upregulation of DES1, CerS2, aCer2/3, and SPHK1 suggests that the whole metabolic flux moves toward the synthesis of S1P via ceramide in obese conditions (Fig. 1A and B). To test whether these changes also occur during adipocyte differentiation, we initiated the differentiation of 3T3-L1 cells and measured the expression of sphingolipid biosynthetic genes. SPTLC2, SPHK1, aCer1/2/3, acid ceramidase (aCDase), and neutral ceramidase (nCDase) were upregulated in a time-dependent manner during differentiation (Fig. 1C; Supplementary Fig. 1). However, SPTLC2 protein levels were decreased and there was no change in SPTLC1 protein levels (Fig. 1D). SPHK1 was also upregulated during adipocyte differentiation, as reported previously (18).
Figure 1.
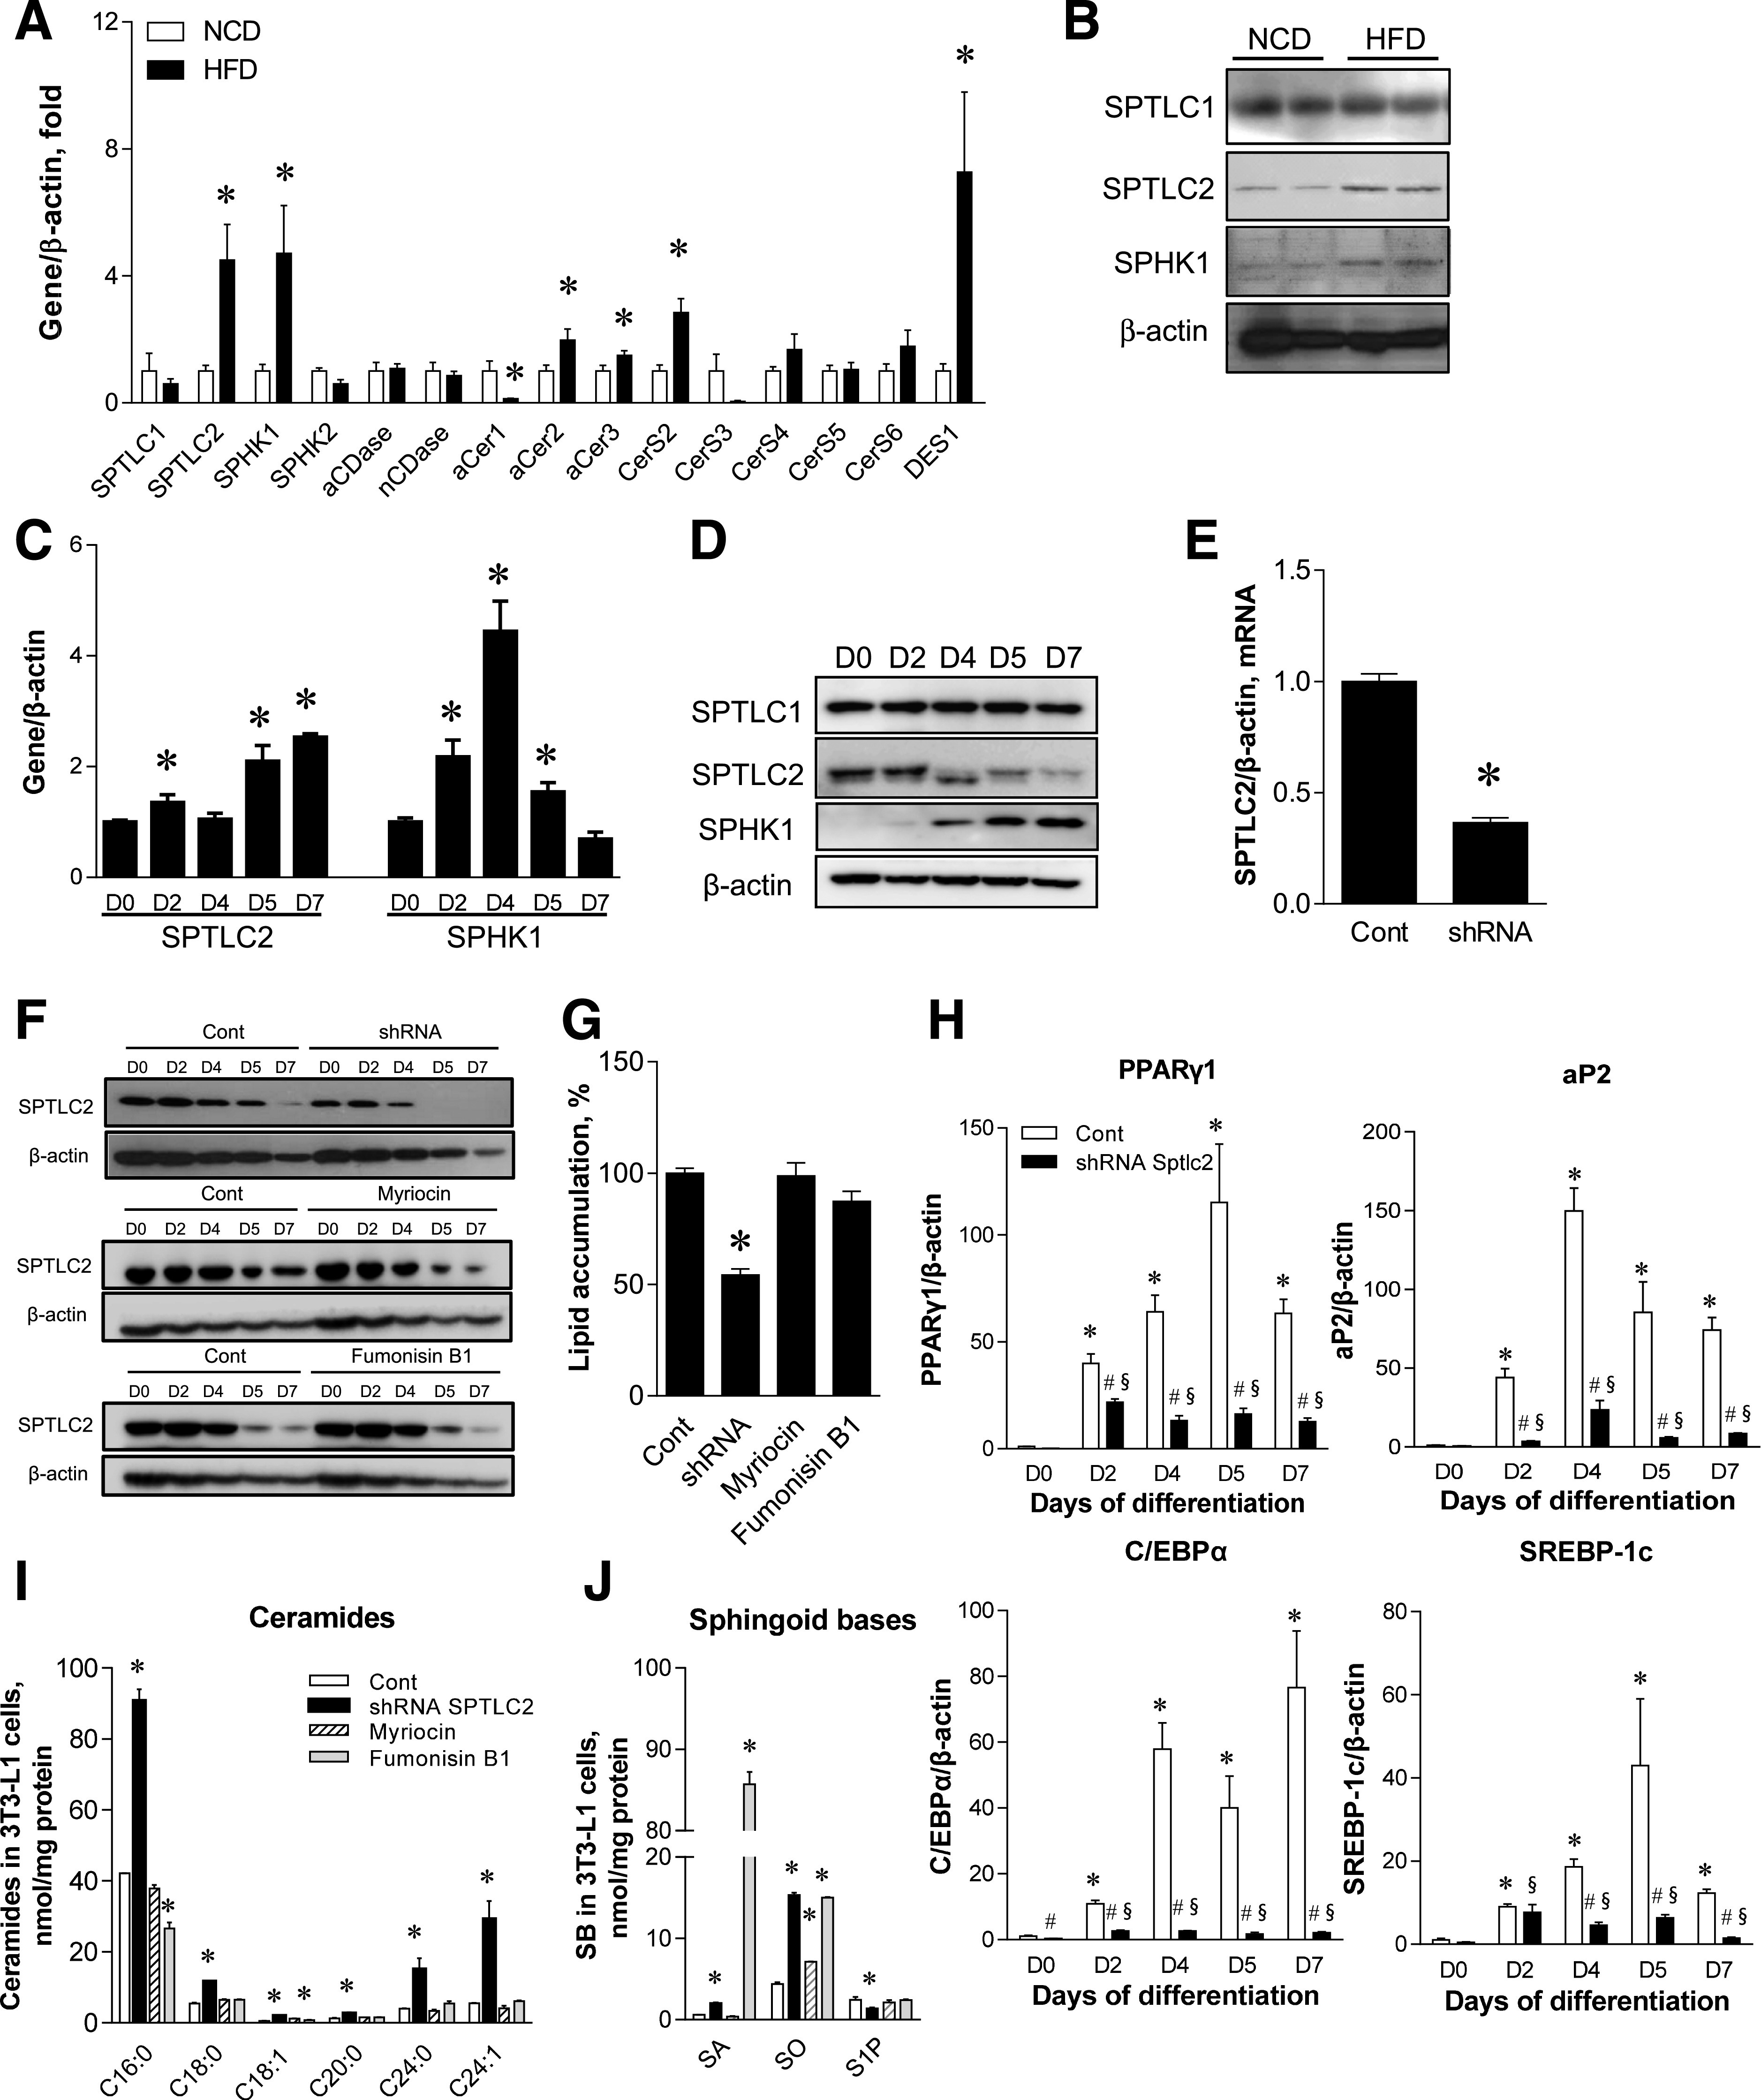
Hyperlipidemic conditions transcriptionally activate de novo sphingolipid synthesis, and SPTLC2 suppression inhibits adipogenesis. A: Quantitative real-time PCR of sphingolipid-metabolizing genes in epididymal WAT from wild-type C57BL/6 mice fed an HFD (60% kcal fat) for 8 weeks. Mean ± SEM. *P < 0.05. n = 6. B: Protein expression of SPTLC1, SPTLC2, and SPHK1 by immunoblotting analyses in WAT from wild-type C57BL/6 mice fed an HFD. C: Quantitative real-time PCR analyses of SPTLC2 and SPHK2 in differentiating 3T3-L1 cells. Cells were differentiated for 7 days and harvested at the indicated days (D0, D2, D4, D5, and D7). Mean ± SEM. *P < 0.05. n = 3. D: Protein expression of SPTLC1, SPTLC2, and SPHK1 by immunoblotting analyses. E: SPTLC2 mRNA expression in stable 3T3-L1 cell line with SPTLC2-specific knockdown (SPTLC2 shRNA) by lentivirus. Mean ± SEM. *P < 0.05. n = 3. F: SPTLC2 protein expression in differentiating SPTLC2 KD shRNA 3T3-L1 cells and the control (Cont) cells in the presence of 10 μmol/L myriocin or 10 μmol/L fumonisin B1. Treatment of myriocin or fumonisin B1 was initiated on D1 before D0 and continued until completion of differentiation at D7. G: Measurement of lipid accumulation in differentiating shRNA-SPTLC2 3T3-L1 cells. Mean ± SEM. *P < 0.05. n = 3. H: Expression of adipogenic PPARγ, aP2, C/EBPα, and SREBP-1c during differentiation. Mean ± SEM. *P < 0.05 vs. D0 of the control; #P < 0.05 vs. the control of each day; §P < 0.05 vs. D0 of the SPTLC2 shRNA cells. n = 3. I: Measurement of ceramides at D7 of adipocyte differentiation. Mean ± SEM. *P < 0.05 vs. the control. n = 3. J: Measurement of sphingoid bases (SB) (SA, sphinganine; SO, sphingosine; and S1P) at D7 of adipocyte differentiation. Mean ± SEM. *P < 0.05 vs. the control. n = 3.
To test the hypothesis that WAT differentiation may require de novo sphingolipid biosynthesis during adipogenesis, we treated 3T3-L1 preadipocytes with a lentivirus containing SPTLC2 short hairpin RNA (shRNA) and constructed a stable cell line with suppressed SPTLC2 expression. shRNA-mediated SPTLC2 downregulation was confirmed by the measurement of mRNA and proteins (Fig. 1E and F). During differentiation, 3T3-L1 cells with suppressed SPTLC2 expression accumulated fewer lipids than control 3T3-L1 cells (Fig. 1G). In contrast, pharmacological inhibition of de novo sphingolipid biosynthesis by 10 μmol/L myriocin or fumonisin B1 did not alter SPT expression or lipid accumulation (Fig. 1F and G). Treatment of inhibitors was initiated from 1 day before insulin cocktail treatment (D1) and continued until completion of differentiation at day 7 (D7). Next, we measured the mRNA levels of adipogenic factors during adipogenesis. Adipogenic genes, including peroxisome proliferator–activated receptor (PPAR)γ, aP2, C/EBPα, and SREBP-1c, were downregulated only by shRNA (Fig. 1H), and this could contribute to impaired adipogenesis. Again, myriocin and fumonisin B1 did not change expression of adipogenic factors (Supplementary Fig. 2). The efficacy of shRNA and inhibitors was confirmed by sphingolipid measurement. At pretreatment (D−1 to D0) and early adipogenesis (D3), ceramide was reduced by myriocin or fumonisin B1 (Supplementary Fig. 3). However, a significant change of ceramide levels was not found in the inhibitor-treated mature 3T3-L1 adipocytes (Fig. 1I). Sphinganine was elevated by fumonisin B1 treatment, and only SPTLC2-shRNA stable cells showed decreased S1P and elevated ceramide levels during adipogenesis (Fig. 1J; Supplementary Fig. 3). These results indicate that de novo sphingolipid biosynthesis in adipose tissues is transcriptionally upregulated under obese conditions and during adipocyte differentiation and plays an important role in the differentiation of adipocytes by regulating the expression of adipogenic genes.
Adipose Tissue–Specific SPTLC2 Deficiency Leads to Lipodystrophy
Based on the findings that SPTLC2 is involved in adipogenesis, we questioned whether adipocyte-specific SPTLC2 deficiency alters development of adipose tissues in mice. We constructed aSPTLC2 KO mice by crossing floxed SPTLC2 mice with adiponectin-Cre transgenic mice (25). When we examined SPTLC2 expression in various tissues derived from aSPTLC2 KO mice, SPTLC2 was not detected in the epididymal or subcutaneous WAT (Fig. 2A). The fact that SPTLC2 was detected in SVF suggests that SPTLC2 deletion occurs after differentiation (Fig. 2A). Notably, we did not find fat pads in male aSPTLC2 KO mice fed a 45% HFD for 8 weeks. The epididymal and subcutaneous fat pads were rarely detectable compared with those of the floxed mice (Fig. 2B). The adipocytes in epididymal WAT from aSPTLC2 KO mice were smaller in size than those from the floxed mice (Fig. 2C). While SPHK2 was upregulated in WAT, most of the adipogenic genes including SPHK1, aP2, C/EBPα, PPARγ, PEPCK, and SREBP-1c were downregulated or not detected, as was found for the SPTLC2-suppressed (SPTLC2 knockdown [KD]) 3T3-L1 cells (Fig. 2D). In sphingolipid profile, we found that C16:0 and C24:1 ceramides were elevated while C18:1 sphingomyelin (SM) was reduced (Fig. 2E) in aSPTLC2 adipose tissues. Notably, while sphinganine (SA) and sphingosine (SO) were elevated, S1P was dramatically reduced (Fig. 2F). In addition, no change in diacylglycerol (DAG) levels was found except for a slight increase in C18:1/C18:1 DAG. The plasma sphingolipid profile was not significantly altered by aSPTLC2 deficiency, and only the floxed mice fed an HFD showed elevated ceramides, dihydroceramide, and SM (Supplementary Fig. 4). These results suggest that defective de novo sphingolipid synthesis alters the adipose sphingolipid composition and prevents the development of adipose tissues.
Figure 2.
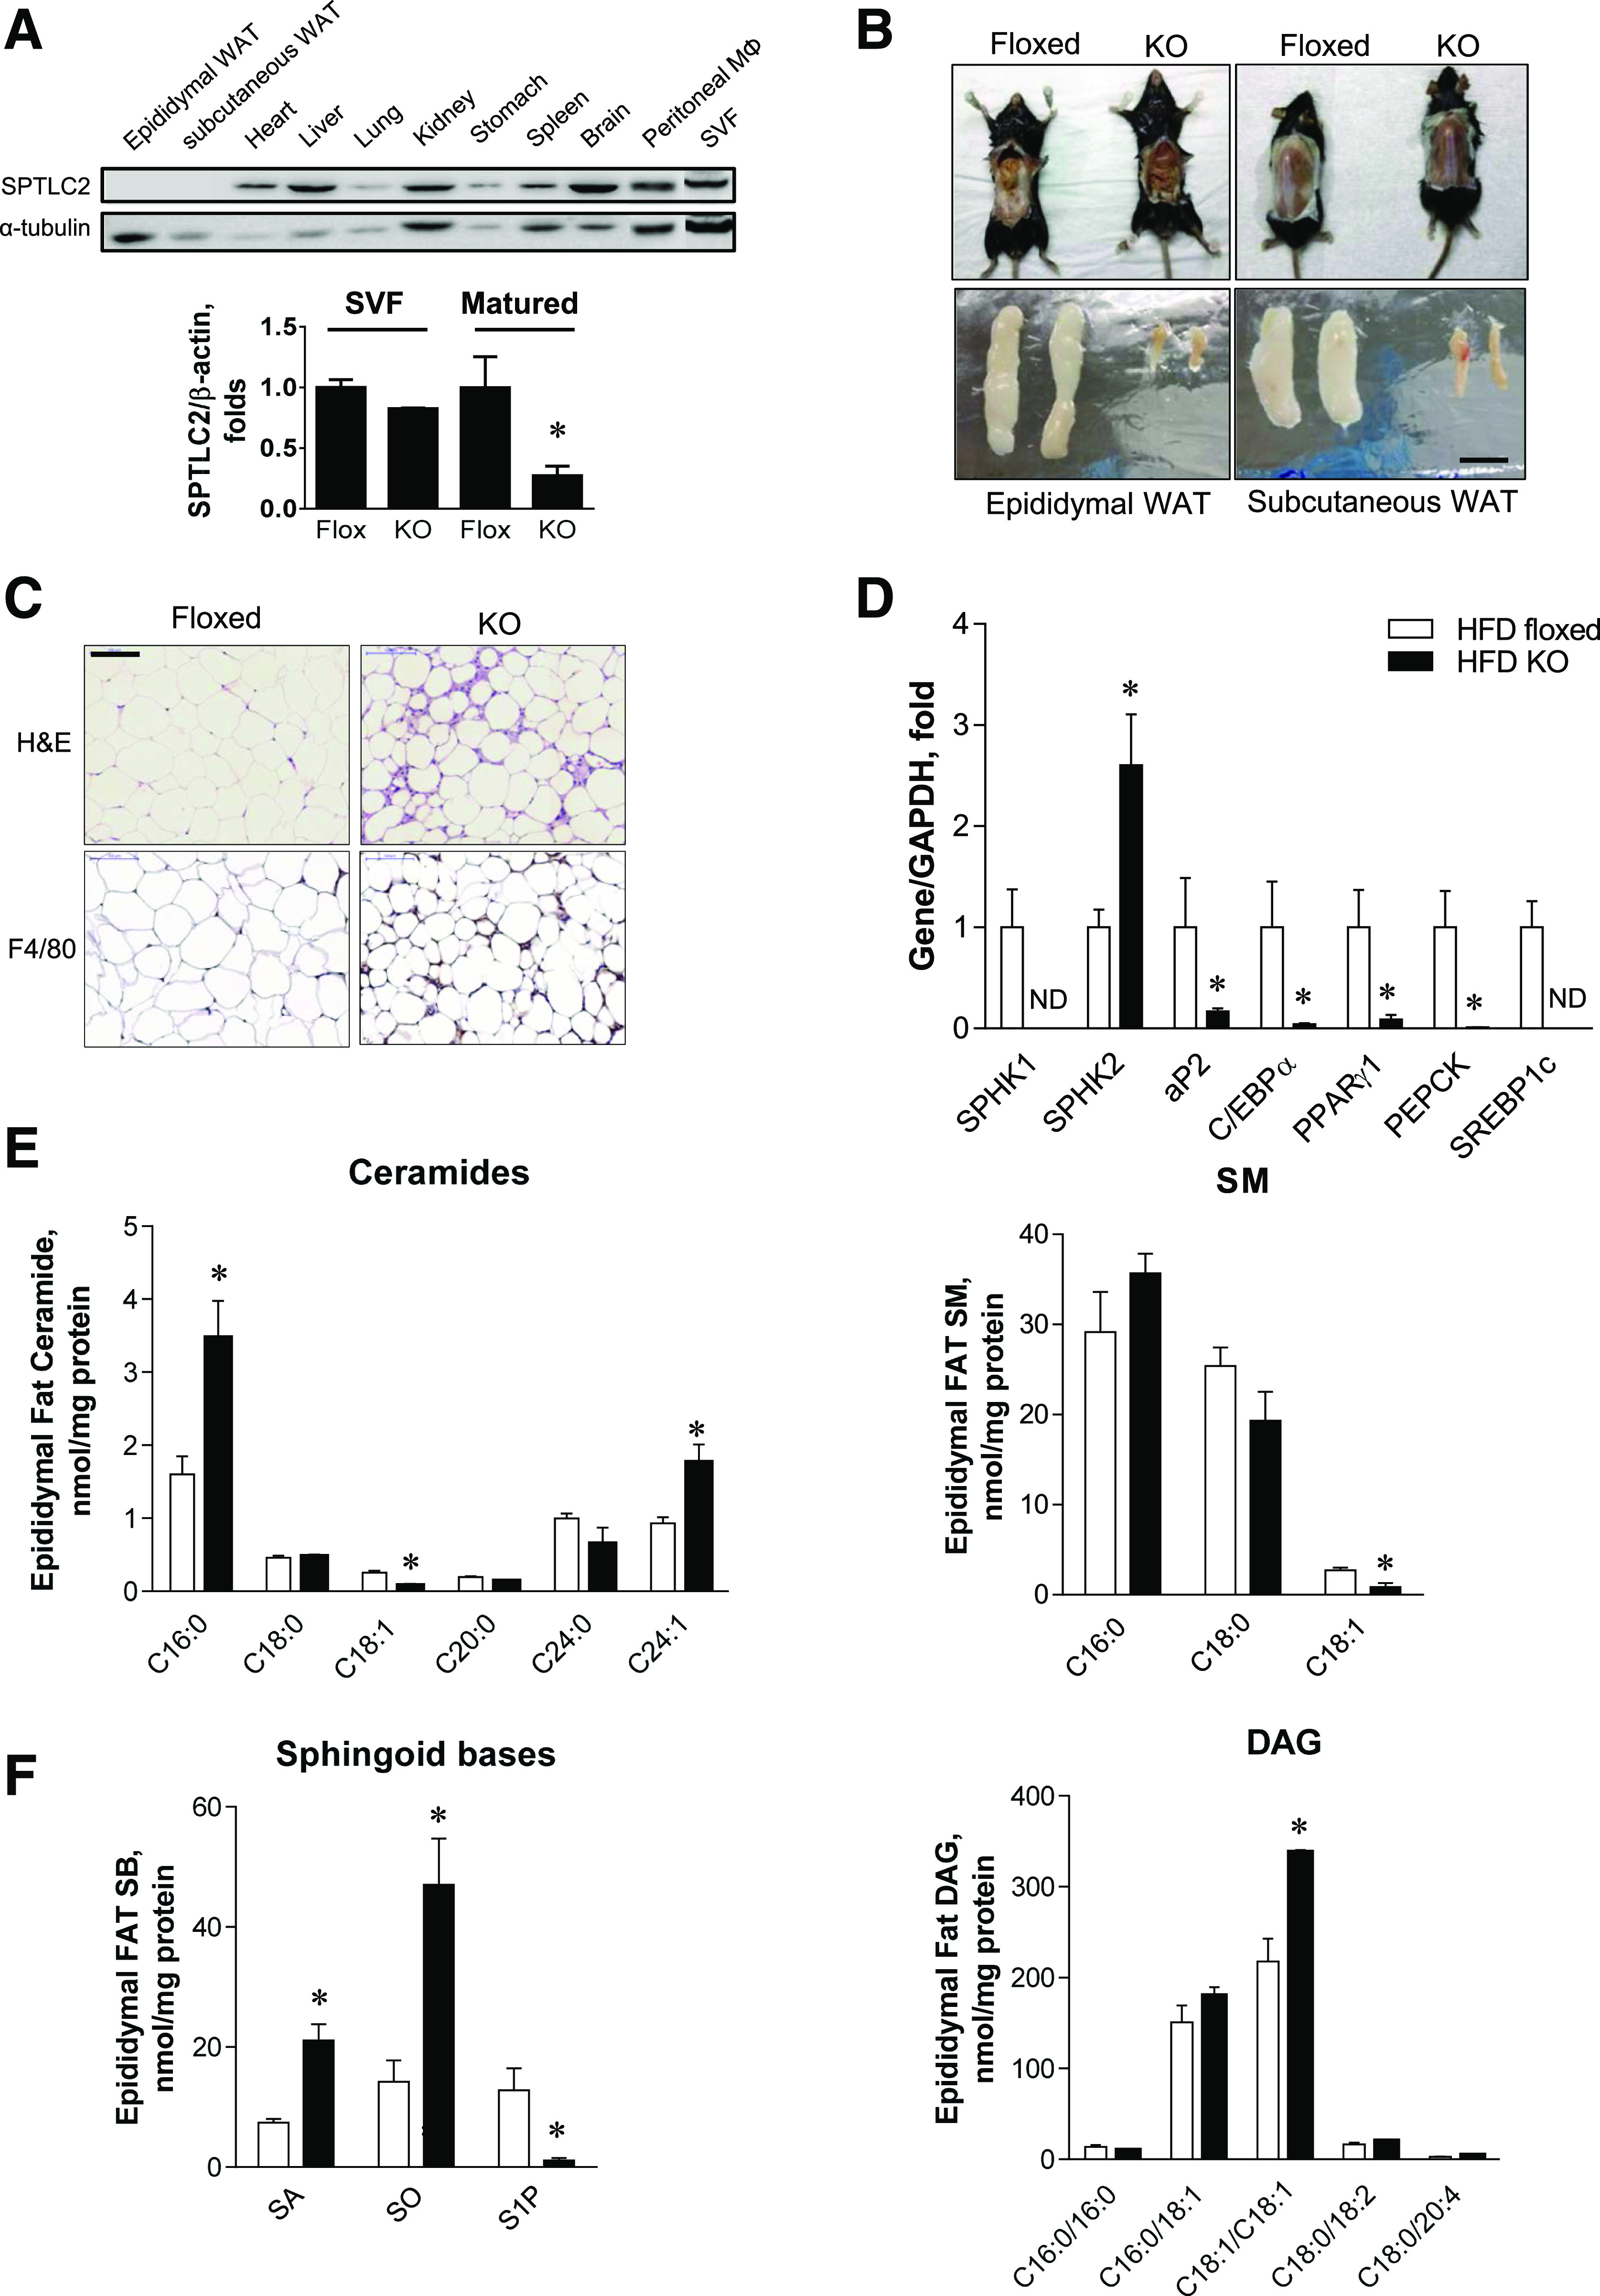
aSPTLC2 KO mice develop lipodystrophy. A: Expression of SPTLC2 protein in various tissues isolated from aSPTLC2 KO mice and expression of SPTLC2 mRNA in SVF and mature adipocytes from aSPTLC2 KO mice. B: Adipose tissue reduction in aSPTLC2 KO mice fed an HFD (45% kcal fat for 8 weeks). The scale bar indicates 1 cm. C: H-E and F4/80 staining of epididymal WAT sections. The scale bar indicates 100 μm. D: Quantitative real-time PCR analyses of adipogenic genes. Mean ± SEM. *P < 0.05 vs. floxed mice. n = 5–6. ND, not determined. E: Analyses of ceramides and sphingomyelin (SM) in epididymal adipose tissues by LC-MS/MS. F: Analyses of sphingoid bases (SB) and DAG by LC-MS/MS. Mean ± SEM. *P < 0.05 vs. floxed mice. n = 5–6.
FA Is Accumulated in the Liver, and Mice Develop Hepatosteatosis
Next, we investigated whether the excess lipids were redistributed in peripheral organs owing to markedly reduced adipose tissues in aSPTLC2 KO mice. The livers from aSPTLC2 KO mice fed an NCD displayed severe lipid accumulation, while an HFD caused lipid accumulation in livers from both floxed and aSPTLC2 KO mice (Fig. 3A). Consistent with this result, the hepatic TG levels in aSPTLC2 KO mice fed an NCD were increased but were unaltered in those fed an HFD (Fig. 3B). To determine whether this was due to activated lipid biosynthesis or inhibited FA oxidation, we measured the expression of lipid-synthesizing genes. We found that lipid-synthesizing genes including SREBP-1c, FA synthase (FAS), diacylglycerol acyltransferase (DGAT), and HMG CoA reductase (HMG CoR) were upregulated in livers from aSPTLC2 KO mice fed an NCD (Fig. 3C). Livers from aSPTLC2 KO mice fed an HFD showed a tendency toward increased expression; however, only FAS and lipoprotein lipase were upregulated with statistical significance. Importantly, the dramatic upregulation of FA-transporter CD36 in livers from aSPTLC2 KO mice suggests increased FA uptake from plasma to the liver. In contrast, FA-oxidizing genes were not altered in the livers of aSPTLC2 KO mice (Supplementary Fig. 5). We also found a tendency of decreased FA oxidation and increased FA uptake ex vivo (Fig. 3D and E). In addition, no change in expression of adipose TG lipase (ATGL) suggests that hepatic lipolysis was not altered (Fig. 3F).
Figure 3.

aSPTLC2 KO mice develop hepatosteatosis. A: Oil Red O staining of mouse liver isolated from the floxed and aSPTLC2 KO mice fed an NCD or HFD (45% kcal fat) for 8 weeks. The scale bar indicates 100 μm. B: Measurement of liver TG. C: Quantitative real-time PCR analyses of TG biosynthetic genes. *P < 0.05 vs. floxed mice fed an NCD. #P < 0.05 vs. floxed mice fed an HFD. n = 5–6. D: Ex vivo FA oxidation rate by trapping 14CO2 from 14C-oleic acid. Mean ± SEM. n = 4. E: Ex vivo FA uptake rate by measuring 3H-bromopalmitate taken up by liver. Mean ± SEM. F: Immunoblotting analyses of ATGL in floxed and aSPTLC2 KO liver. G: Analyses of ceramides and SM by LC-MS/MS. *P < 0.05 vs. NCD floxed mice fed an NCD; #P < 0.05 vs. floxed mice fed an HFD. n = 5–6. H: Analyses of sphingoid bases (SB) and DAG by LC-MS/MS. Mean ± SEM. *P < 0.05 vs. floxed mice fed an NCD; #P < 0.05 vs. floxed mice fed an HFD. n = 5–6.
When we examined the effects of aSPTLC2 deficiency on the sphingolipid profile in these livers, only C24:0 and C24:1 ceramides were reduced in both NCD- and HFD-fed aSPTLC2 KO mice (Fig. 3G). C18:0 SM was elevated in the livers of both floxed and aSPTLC2 KO mice fed an HFD (Fig. 3G). SA and SO levels were reduced in livers from aSPTLC2 KO mice fed an HFD, but there was no change in the livers of those fed an NCD (Fig. 3H). On the other hand, S1P was elevated only in the livers of floxed mice fed an HFD. DAG levels were elevated in the livers of aSPTLC2 KO mice fed an NCD, while an HFD caused increased DAG in the livers from floxed mice (Fig. 3H). In contrast, the expression of TG biosynthetic genes in skeletal muscles was not altered by aSPTLC2 deficiency (Supplementary Fig. 6). These results suggest that defective de novo sphingolipid synthesis in adipose tissue and the resulting lipodystrophy elevates hepatic TG levels and causes hepatosteatosis.
aSPTLC2 KO Mice Develop Hyperglycemia
While we did not find a dramatic difference in their body weights, except for slightly increased body weights of the aSPTLC2 KO mice fed an NCD, plasma glucose levels were elevated in aSPTLC2 KO mice compared with the floxed mice regardless of diet (Table 1 (NCD and 45% HFD). Alanine transaminase activity was increased in aSPTLC2 KO mice fed an HFD, while aspartate aminotransferase levels were unaltered. Plasma cholesterol levels were elevated in aSPTLC2 KO mice fed an NCD when compared with the floxed mice, and this result is consistent with the upregulated HMG CoR (Fig. 3C). Plasma nonesterified FA levels were reduced in the lipodystrophic aSPTLC2 KO mice on NCD or HFD feeding (Table 1). Ketone bodies, represented by β-hydroxybutyrate, were only increased in aSPTLC2 KO mice fed an NCD (Table 1). These results indicate that the lipids that are supposed to accumulate in the adipose tissue were instead accumulated in the liver, possibly via increased CD36-mediated FA transport and activated TG biosynthesis.
Table 1.
Plasma parameters of the floxed and aSPTLC2 KO mice fed an NCD or the 45% HFD for 8 weeks
| NCD |
HFD |
|||
|---|---|---|---|---|
| SPT flox (n = 6) | aSPTLC2 KO (n = 6) | SPT flox (n = 5) | aSPTLC2 KO (n = 6) | |
| Body weight (g) | 24.1 ± 0.2 | 25.6 ± 0.5* | 26.2 ± 0.6# | 26.2 ± 0.5 |
| Plasma glucose (mg/dL) | 100.6 ± 2.7 | 152.7 ± 7.3* | 95.8 ± 9.5 | 145.6 ± 11.8* |
| ALT (units/L) | 38.8 ± 10.2 | 19.3 ± 7.4 | 33.9 ± 7.7 | 92.3 ± 26.8* |
| AST (units/L) | 156.1 ± 52.1 | 141.9 ± 32.4 | 135.3 ± 31.4 | 206 ± 57.9 |
| T-CHO (mg/dL) | 95.8 ± 4.3 | 117.3 ± 4.4* | 170.7 ± 18.9 | 156.1 ± 28.5 |
| TG (mg/dL) | 117.8 ± 11.2 | 115.7 ± 13.6 | 86.4 ± 9.5 | 88.2 ± 18.4 |
| HDL (mg/dL) | 64.6 ± 3.2 | 81.4 ± 2.9* | 113.7 ± 12.8 | 103.6 ± 15.4 |
| LDL (mg/dL) | 12.1 ± 0.8 | 12.3 ± 0.8 | 23.5 ± 3.6 | 20.5 ± 5.7 |
| NEFA (mEq/L) | 12.8 ± 0.5 | 9.8 ± 1.0* | 10.5 ± 1.3 | 9.5 ± 0.3* |
| β-OH butyrate (μmol/L) | 100.6 ± 19 | 188.3 ± 32* | 102.5 ± 28 | 137.5 ± 10 |
Data are means ± SEM. ALT, alanine transaminase; AST, aspartate aminotransferase; β-OH, β-hydroxybutyrate; NEFA, nonesterified FA; T-CHO, total cholesterol.
*P < 0.05 vs. SPT flox;
#P < 0.05 vs. SPT flox fed an NCD.
Lipodystrophic aSPTLC2 KO Mice Are Insulin Resistant
Since plasma glucose levels were elevated in aSPTLC2 KO mice fed an NCD or HFD and the elevated plasma glucose would be accounted for by hepatic glucose production, we investigated whether aSPTLC2 KO–mediated hepatosteatosis causes hepatic insulin resistance as reported in lipodystrophic patients (26–28). First, we fed floxed and aSPTLC2 KO mice a 60% HFD for 4 weeks and measured their body composition. The floxed mice fed an HFD had increased body weight in a time-dependent manner compared with those fed an NCD (Fig. 4A). During this period, the food intake was not altered in the floxed or aSPTLC2 KO mice depending on diet (Supplementary Fig. 7). However, the body weights of aSPTLC2 KO mice, while slightly higher than those of the floxed mice, remained unchanged during HFD feeding. Next, we measured the body composition distinguished by fat mass using 1H-nuclear magnetic resonance (NMR). While the floxed mice showed dramatically increased fat mass and modestly increased lean body mass after HFD, aSPTLC2 KO mice showed no change in body weight or mass composition (Fig. 4B). The increased body weight during HFD feeding was mainly accounted for by increased fat mass. We also measured energy expenditure over 24 h but found no change in VO2, VCO2, respiratory energy exchange ratio (RER), energy expenditure, or food intake (Fig. 4C; Supplementary Fig. 8). The only increase observed was in activity for aSPTLC2 KO mice fed an NCD.
Figure 4.
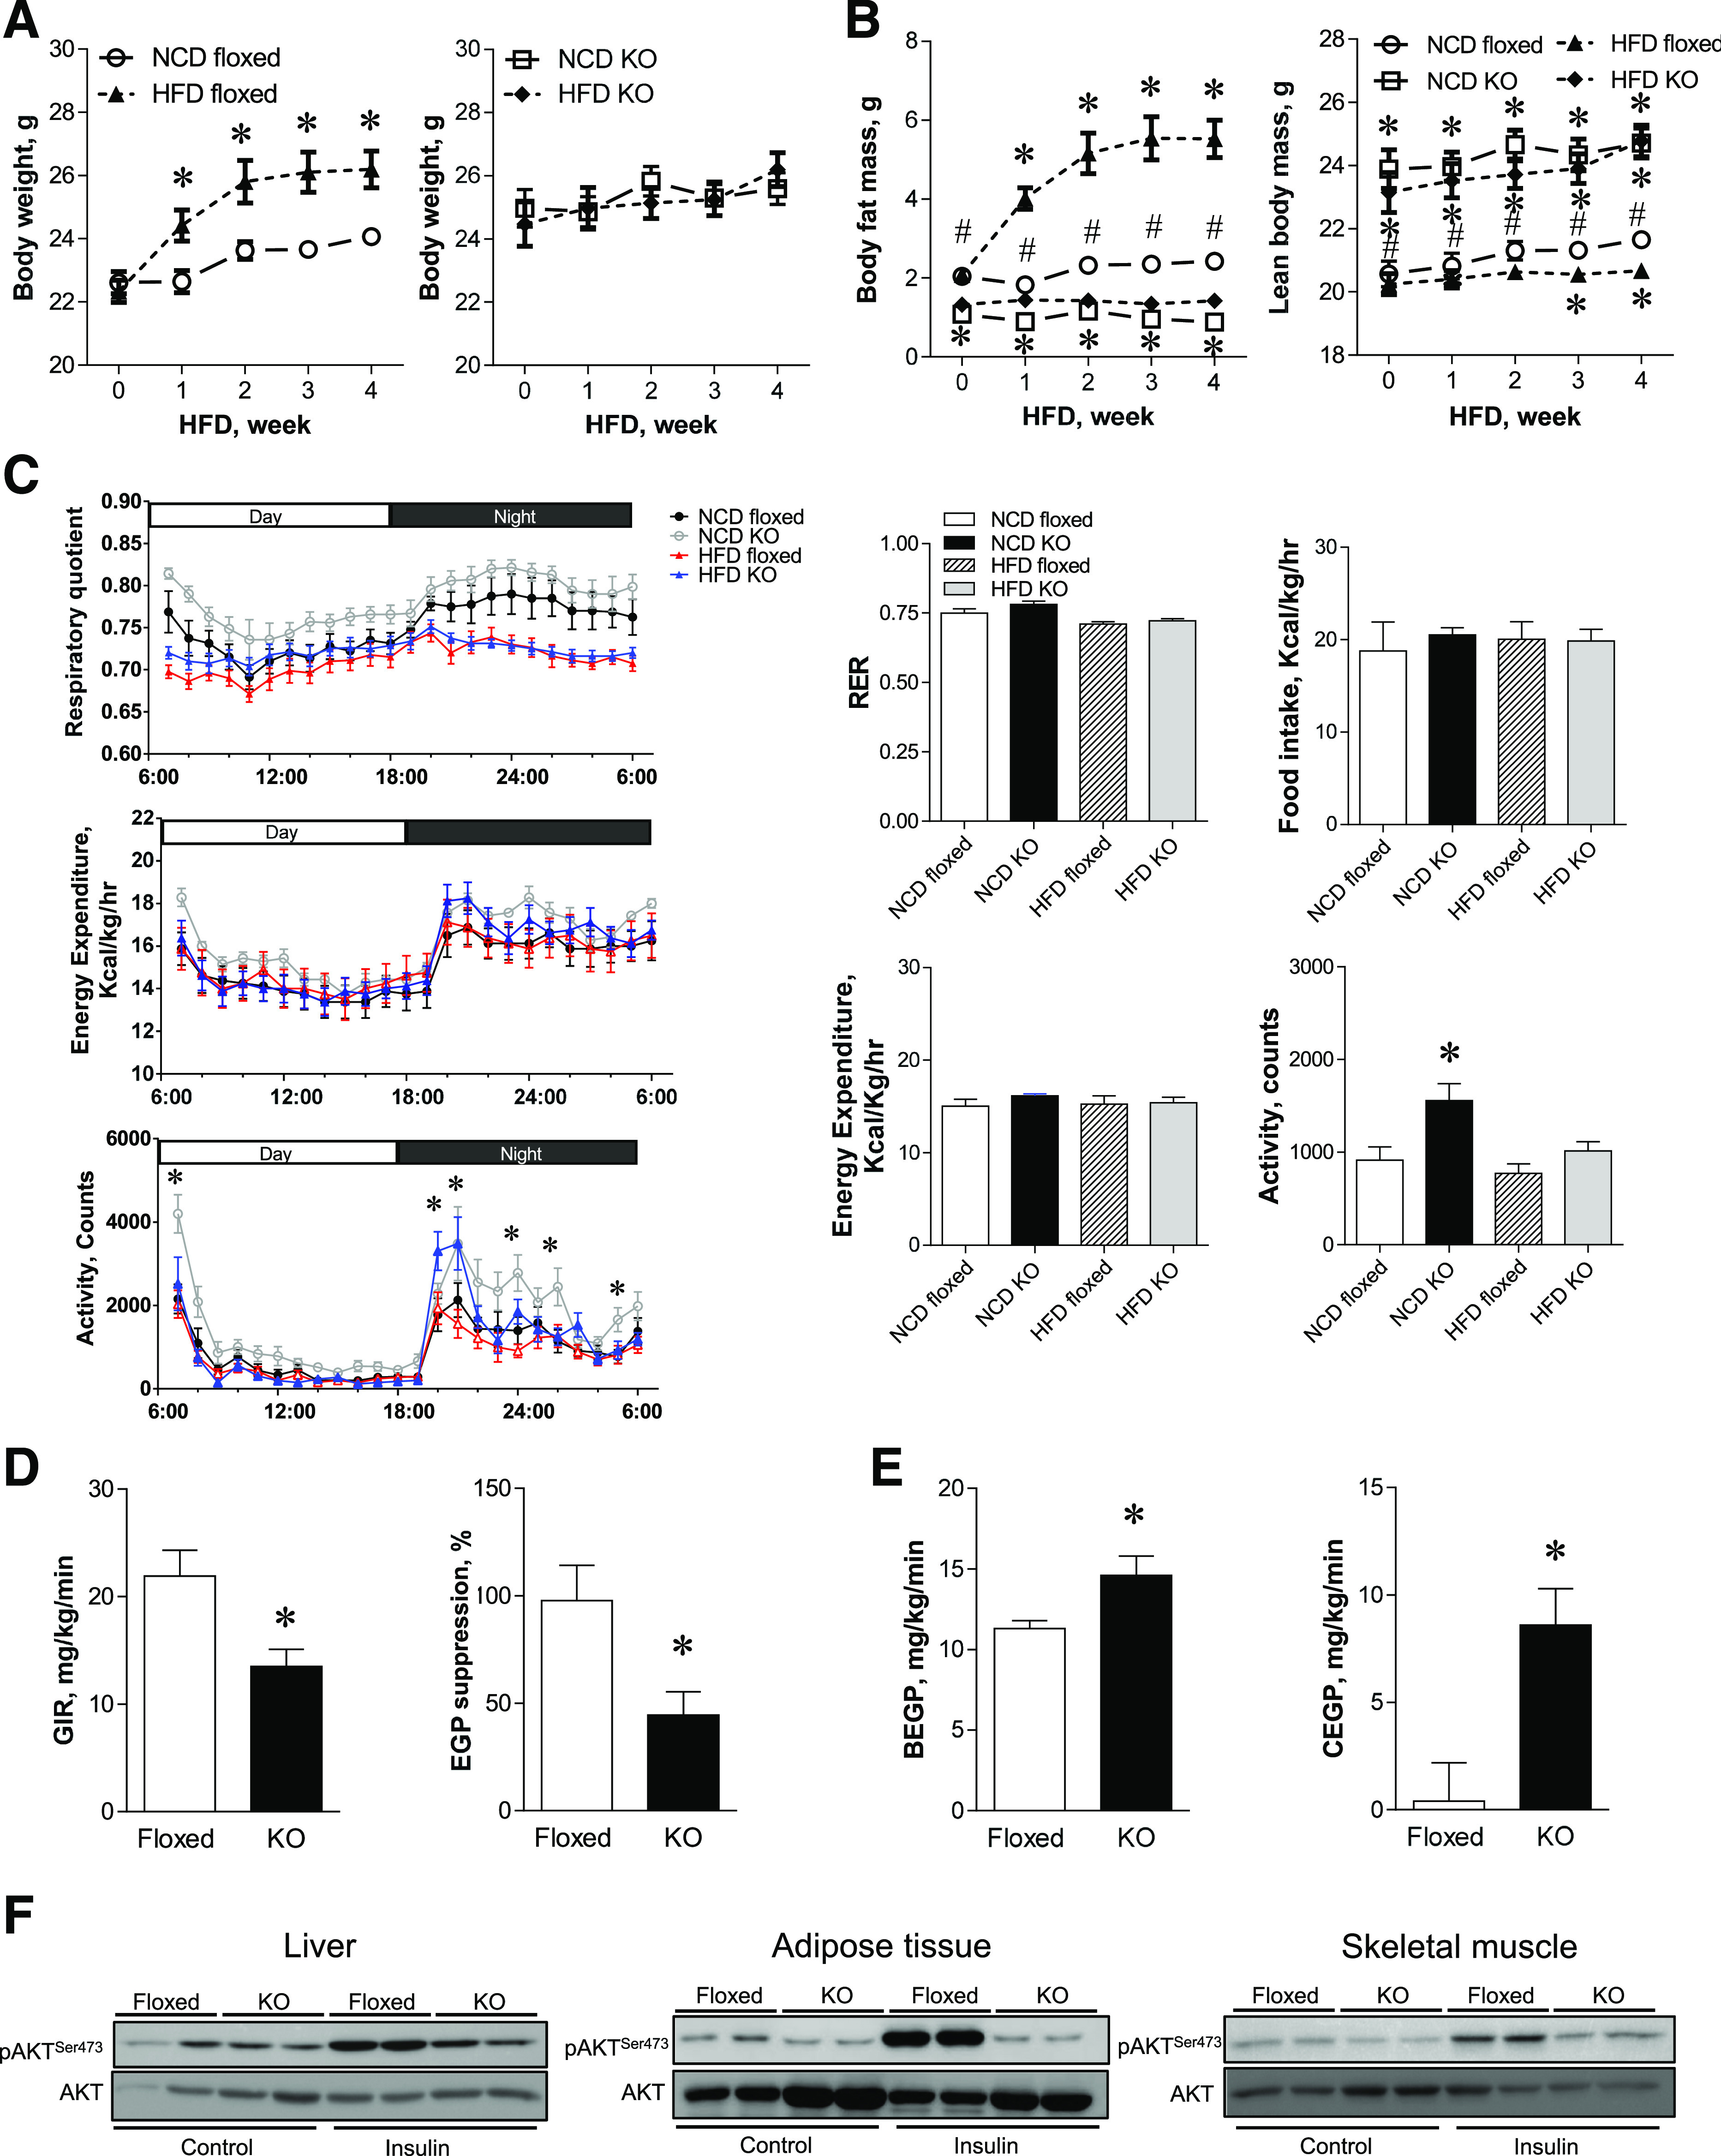
aSPTLC2 KO mice are resistant to HFD-induced obesity but develop insulin resistance. A: Body weight change of the floxed and aSPTLC2 KO mice fed an NCD and an HFD (60% kcal fat) over 4 weeks. *P < 0.05 vs. floxed mice fed an NCD. B: Measurement of body composition of the floxed and aSPTLC2 KO mice fed an NCD or HFD by 1H NMR. Mean ± SEM. *P < 0.05 vs. floxed mice fed an NCD; #P < 0.05 vs. aSPTLC2 KO mice fed an NCD. n = 10–14. C: Metabolic changes in the floxed and aSPTLC2 KO mice. Basal energy balance including respiratory quotient (RER), energy expenditure, food intake, and activity was recorded after 4 weeks of NCD and HFD (60% kcal fat) using a Comprehensive Lab Animal Monitoring System. Data are presented as the mean ± SEM. *P < 0.05 vs. floxed mice fed an NCD. n = 10–14. D: Measurement of the glucose infusion rate (GIR) and hepatic glucose production (EGP) suppression by hyperinsulinemic-euglycemic clamp. *P < 0.05 vs. floxed mice fed an HFD. E: Measurement of the basal hepatic glucose production (BEGP) and hepatic glucose production during clamp (CEGP). *P < 0.05 vs. floxed mice fed an HFD. n = 10–14. F: AKT phosphorylation (p) of liver, adipose tissues, and skeletal muscle was assessed by immunoblotting 10 min after intraperitoneal insulin injection (0.5 units/kg body wt). hr, hour.
To investigate whether the elevated plasma glucose levels in aSPTLC2 KO mice were due to the development of insulin resistance in these lipodystrophic mice, we performed hyperinsulinemic-euglycemic clamp studies. Fasting glucose levels were elevated in aSPTLC2 KO mice compared with those of floxed mice with HFD feeding (Supplementary Fig. 9). In addition, the glucose infusion rate and hepatic glucose production suppression were decreased in aSPTLC2 KO mice fed an HFD (Fig. 4D). Hepatic glucose production was increased in aSPTLC2 KO mice in the basal state and during clamp (Fig. 4E); however, there was no change in glucose uptake, glycolysis, or glycogen synthesis (Supplementary Fig. 9). These results suggest that hepatic insulin resistance has occurred in aSPTLC2 KO mice. To further examine whether the insulin signaling was altered, we injected insulin (0.5 mg/kg) for 10 min and measured the degree of phosphorylation of AKT. In the liver and adipose tissues from aSPTLC2 KO mice, the insulin-mediated phosphorylation of AKT was decreased (Fig. 4F). Decreased insulin-mediated AKT phosphorylation in skeletal muscle suggests that a systemic insulin resistance occurred in aSPTLC2 KO mice. Collectively, these results indicate that the increased whole-body insulin resistance in aSPTLC2 KO mice is accounted for by marked hepatic insulin resistance with steatosis.
aSPTLC2 Deficiency Reduces S1P Levels and Downregulates the S1PR1
During the differentiation of 3T3-L1 preadipocytes, expression profile indicates that the net metabolic flux moves toward S1P formation (Fig. 1A). Furthermore, adipose S1P levels were reduced in aSPTLC2 KO mice (Fig. 2F). These results prompted us to question whether S1P is implicated in the lipodystrophic phenotype displayed by aSPTLC2 KO mice. As reported previously (24), the floxed and aSPTLC2 KO mice were fed a 60% HFD for 2 weeks, followed by SPHK2 adenovirus injection to increase plasma S1P for an additional 2 weeks and their body composition determined. Cell size was increased for adipocytes from floxed and aSPTLC2 KO mice injected with SPHK2 adenovirus, when compared with mice injected with GFP control adenovirus (Fig. 5A and B). While the total adipose tissue mass in aSPTLC2 KO mice was unaltered by GFP or SPHK2 adenovirus, the adipose tissue was increased significantly in floxed mice injected with SPHK2 adenovirus (Fig. 5C). As shown previously, the plasma S1P and sphinganine 1-phosphate (Sa1P) were elevated (Fig. 5D). These results indicate that extracellular S1P is implicated in adipocyte hypertrophy. To find out which of the S1PRs are involved in the regulation of adipocyte differentiation, we then measured the expression of S1PRs in adipose tissues. We found that S1PR1 was dramatically downregulated, and S1PR2 and S1PR3 were upregulated in aSPTLC2 KO WAT (Fig. 5E). In 3T3-L1 cells treated with SPTLC2 shRNA, S1PR1 was significantly downregulated, while there was no noticeable change in the expression of either S1PR2 or S1PR3 (Fig. 5F). Thus, these results suggest that S1PR1-mediated S1P signaling plays an important role in the proliferation or differentiation of adipocytes.
Figure 5.

Elevated S1P in circulation caused adipocyte hypertrophy. A: H-E staining of the adipose tissue sections from the floxed and aSPTLC2 KO mice. Mice were fed an HFD (60% kcal at) for 2 weeks, and adenovirus containing GFP (AdGFP) or SPHK2 (AdSPHK2) (1 × 10⁹ PFU) was injected in the tail vein. After 2 weeks postinjection, the adipose tissues were isolated. The scale bar indicates 100 μm. B: Quantitation of adipocyte size in the floxed and aSPTLC2 KO mice injected with AdGFP or SPHK2. Data represents mean ± SEM. *P < 0.05 vs. floxed mice injected with adenovirus containing GFP; #P < 0.05 vs. aSPTLC2 KO mice injected with AdGFP. n = 5. C: Measurement of body fat composition (1H NMR). Mean ± SEM. *P < 0.05 vs. before adenoviral injection (0 week). n = 5. D: Plasma concentration of sphingosine 1-phosphate (So1P) and sphinganine 1-phosphate (Sa1P). Mean ± SEM. *P < 0.05 vs. floxed mice injected with AdGFP. n = 5. E: Quantitative RT-PCR analyses of S1PRs in the adipose tissues isolated from the floxed and aSPTLC2 mice fed an HFD (60% kcal fat) for 4 weeks. Mean ± SEM. *P < 0.05 vs. floxed mice fed an HFD. n = 5. F: Quantitative real-time PCR analyses of S1PRs in the control (Cont) and SPTLC2 shRNA–suppressed 3T3-L1 adipocytes during differentiation. Mean ± SEM. *P < 0.05 vs. D0 of the control; #P < 0.05 vs. the control of each day; §P < 0.05 vs. D0 of the shRNA SPTLC2. n = 3. Wk, weeks.
S1P Induces the Proliferation of Preadipocytes and Adipogenesis via the Activation of PPARγ and SREBP-1c
The finding that increased plasma S1P leads to increased adipocyte differentiation (18) suggests that S1P may increase adipocyte proliferation or adipogenesis. To investigate this, we treated 3T3-L1 cells with S1P and examined their proliferation. As S1P levels were increased, the migrating preadipocyte 3T3-L1 cells increased in a dose-dependent manner (Fig. 6A). The decreased gap distance with S1P treatment and increased cell viability suggest that S1P is a proliferating factor for adipocytes (Fig. 6B and C). In the presence of W146, an S1PR1 antagonist, the degree of cell migration and cell viability mediated by S1P was inhibited (Fig. 6A–C). Since a recent report implied that S1P is a ligand for PPARγ independent of S1P receptors in endothelial cells (29), we measured PPRE reporter activity after treatment with S1P for 6 h or rosiglitazone, a PPARγ agonist. Indeed, S1P treatment increased PPRE-luciferase reporter activity to levels comparable with those produced by treatment with rosiglitazone (Fig. 6D). To examine whether lipodystrophy caused by SPTLC2 deficiency is recovered by extracellular S1P, we treated the SPTLC2 KD cells with S1P. We found that S1P treatment did not restore the reduced lipid droplets in SPTLC2 KD cells (Fig. 6E).
Figure 6.
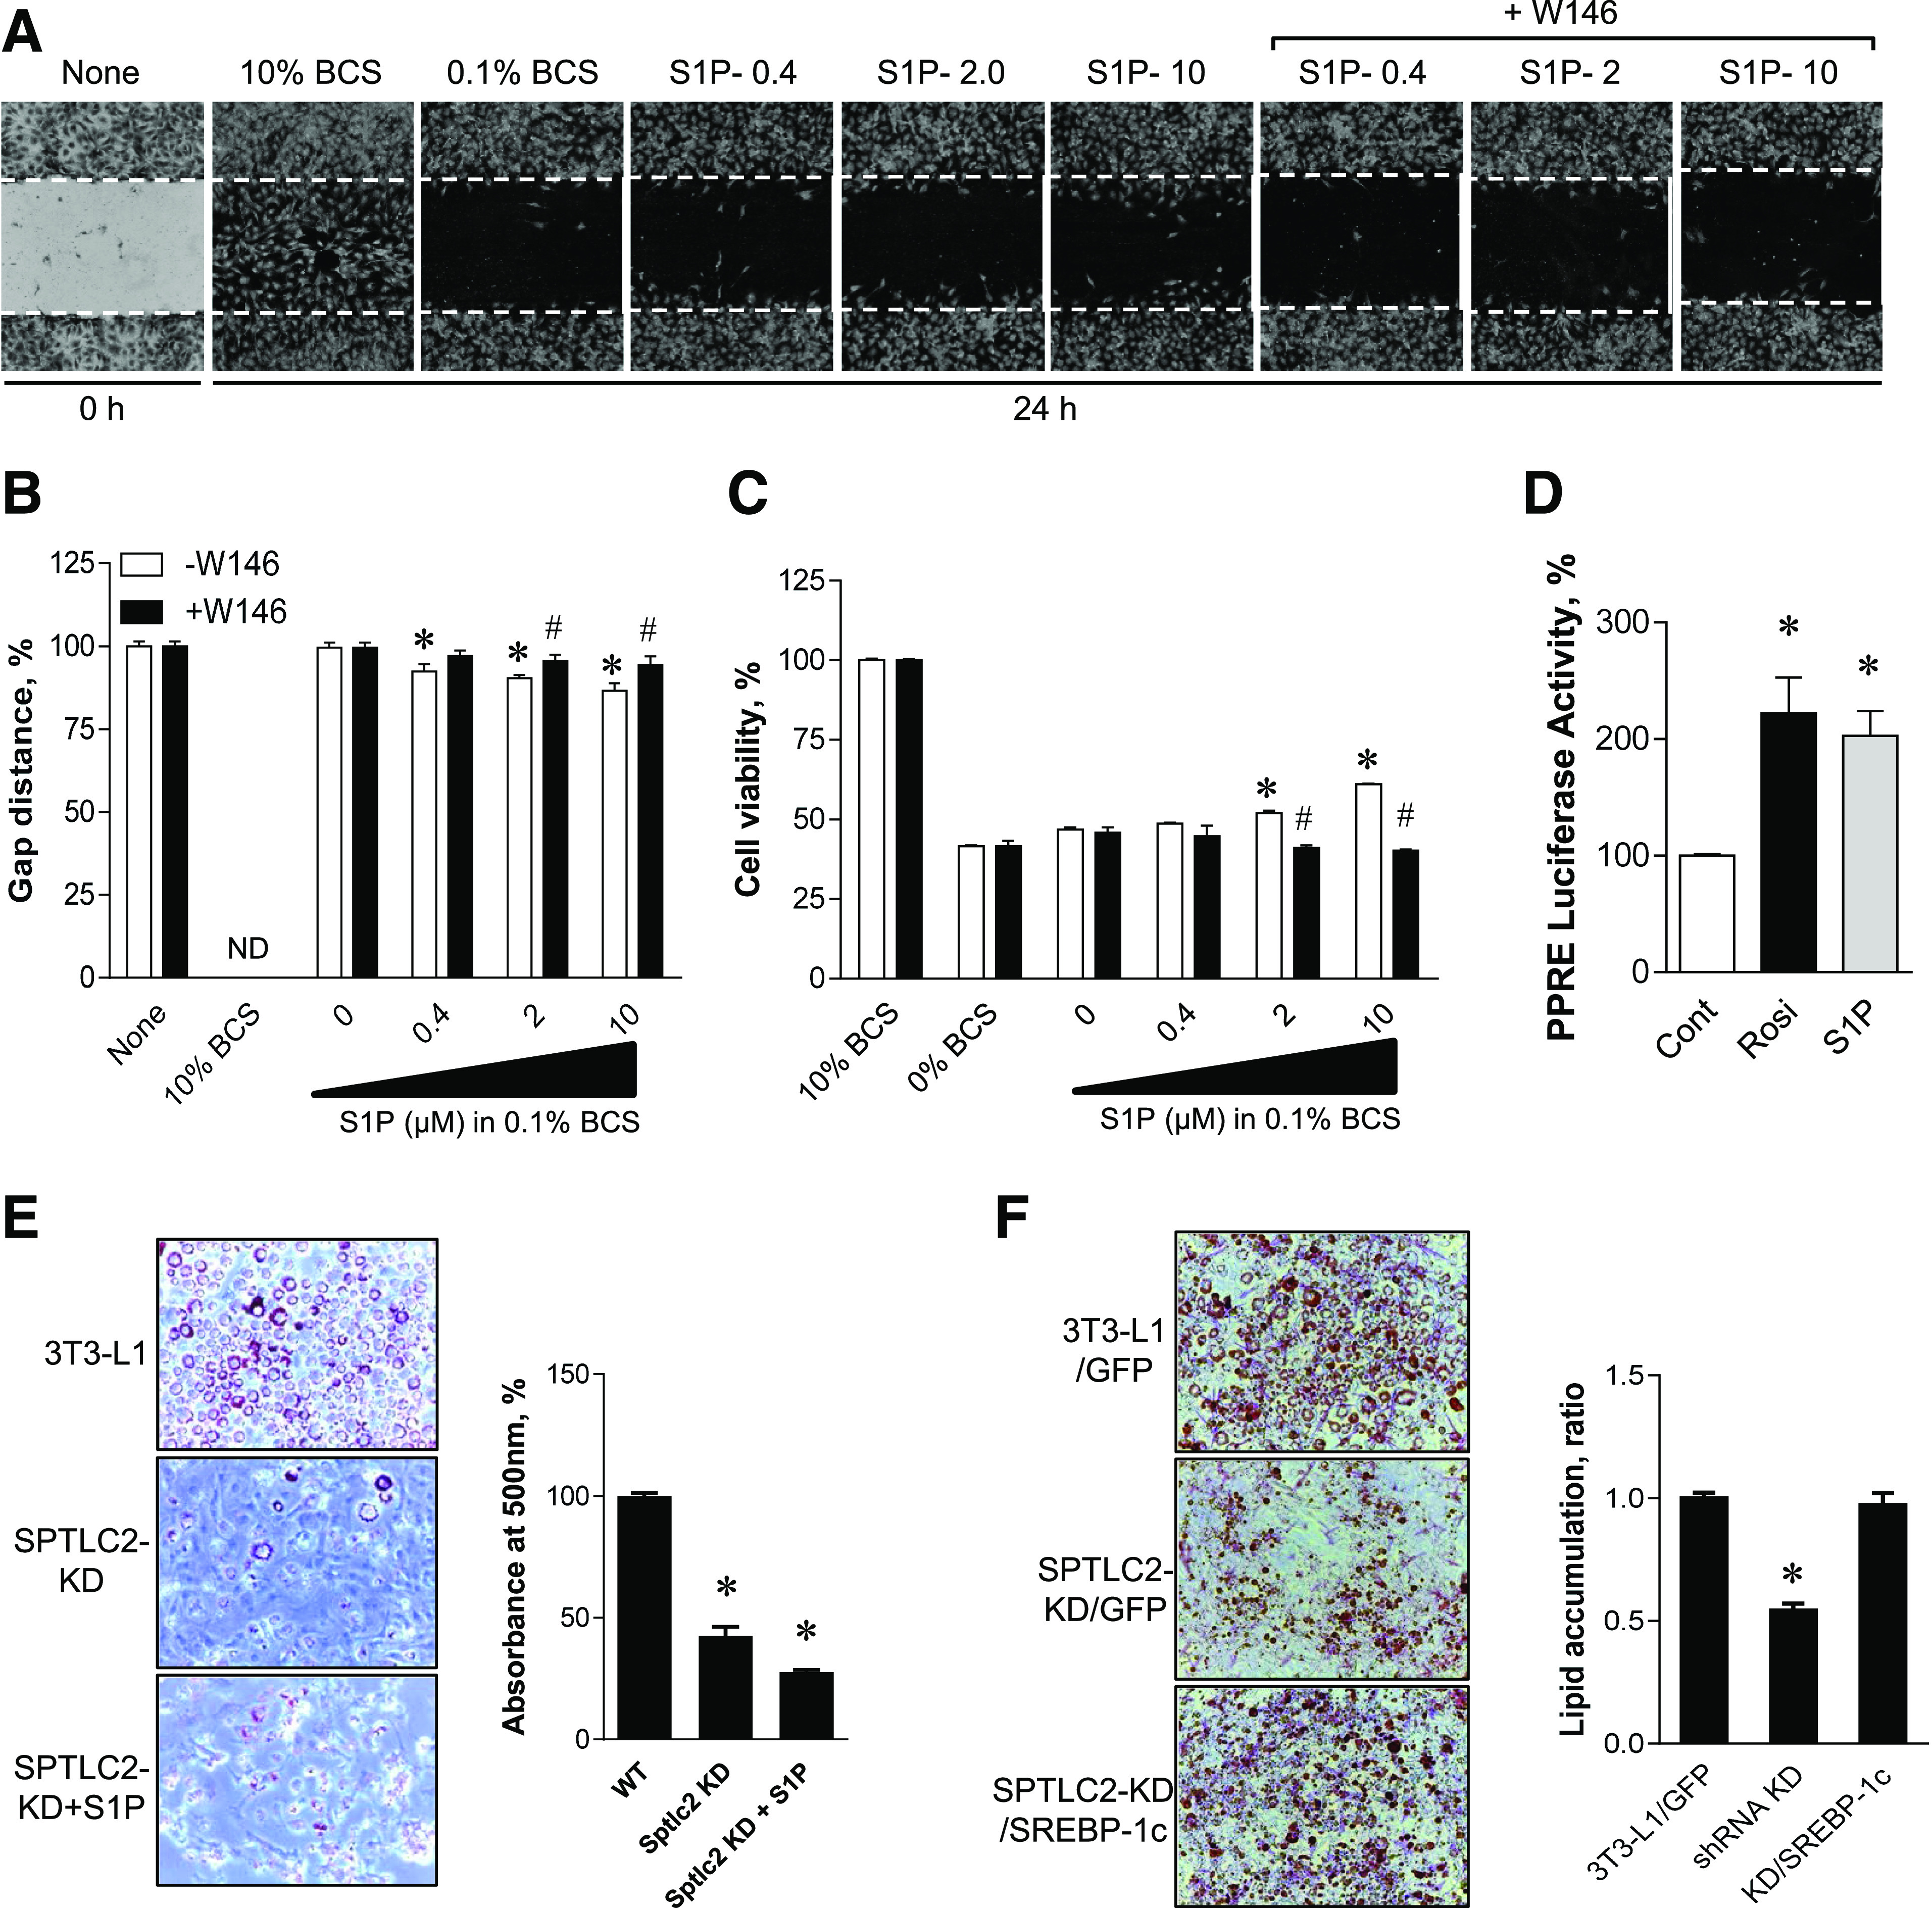
Activation of PPARγ and proliferation of 3T3-L1 preadipocytes by S1P and restoration of adipogenesis by SREBP-1c expression. A: 3T3-L1 preadipocytes were treated with various S1P concentrations in the presence or absence of 10 μmol/L W146 for 24 h, and migration into the scraped area was observed. B: Cell migration was determined in the presence or absence of 10 μmol/L W146 by the wound-healing assay and quantified as a ratio of the gap distance at 24 h relative to that at 0 h. Mean ± SEM. *P < 0.05 vs. the control group; #P < 0.05 vs. –W146 group at same S1P concentrations. n = 6. ND, not determined. C: 3T3-L1 cell viability was assessed by XTT (2,3-Bis-[2-Methoxy-4-Nitro-5-Sulfophenyl]-2H-Tetrazolium-5-Carboxanilide) assay after treatment with increasing concentrations of S1P for 24 h. Mean ± SEM. *P < 0.05 vs. the control group; #P < 0.05 vs. –W146 group at same S1P concentrations. n = 6. D: AML-12 cells were transiently transfected with vectors containing PPRE-x3-TK-Luc constructs. After 24 h incubation, cells were treated with 5 μmol/L S1P or 10 μmol/L rosiglitazone (Rosi) for 6 h. Cell lysates were prepared for the luciferase assay, and luciferase activity was measured using a luminometer. Mean ± SEM. *P < 0.05 vs. the control. n = 5. E: WT and shRNA SPTLC2-KD cells were treated with 10 μmol/L S1P during differentiation by insulin cocktail. Formation of droplets was quantified by Oil Red O and absorbance measurement at 500 nm. This pictures were magnified by ×20. Mean ± SEM. *P < 0.05 vs. the control. n = 3. WT, wild type. F: SPTLC2 shRNA 3T3-L1 stable preadipocytes were infected with lentivirus containing GFP or SREBP-1c. Then differentiation was initiated by insulin cocktail. The degree of lipid droplet formation was quantified by Oil Red O staining and absorbance measurement. Mean ± SEM. *P < 0.05 vs. the control. n = 3. BCS, bovine calf serum.
Based on our findings that SREBP-1c is downregulated in SPTLC2 KD cells and the adipose tissue from aSPTLC2 KO mice, we examined whether the lentiviral overexpression of SREBP-1c rescues reduced adipogenesis. We found that SREBP-1c expression restored the adipogenesis in SPTLC2 KD 3T3-L1 cells (Fig. 6F). These results suggest that adipocyte proliferation and adipogenesis are regulated by S1P via S1PR1 and PPARγ activation as well as SREBP-1c.
Discussion
Sphingolipids are critical regulators of cell proliferation and differentiation, and the metabolic dysregulation of sphingolipids causes the development of major metabolic and cardiovascular diseases (9–11,30). The inhibition of de novo sphingolipid biosynthesis has been reported to ameliorate obesity-associated insulin resistance and WAT differentiation (31–33). At present, several sphingolipid-metabolizing genes have been proposed to regulate adipogenesis and have been suggested as therapeutic intervention points for obesity (15,32). In the current study, we found the following: 1) during adipocyte differentiation, sphingolipid biosynthetic flux moves toward S1P biosynthesis; 2) the inhibition of de novo sphingolipid biosynthesis inhibits adipocyte differentiation; 3) adipocyte-specific SPTLC2 deficiency lead to lipodystrophy, hepatic steatosis, and systemic insulin resistance; and 4) S1P and S1PR1 are implicated in the proliferation and differentiation of adipocytes. These studies elucidate the balance of FA/TG metabolism in the liver and adipose tissue and demonstrate the critical role of sphingolipid metabolites in adipogenesis.
We found that adipose tissues from mice fed an HFD had increased expression of SPTLC2 and SPHK1 (Fig. 1A). Overnutrition represented by an HFD led to increased lipid storage in adipose tissues and the induction of adipogenic factor SPHK1 (18). The upregulation of SPTLC2, DES1, and some ceramidases in mice fed an HFD and during differentiation of 3T3-L1 cells indicates that the overall sphingolipid biosynthetic flux moves toward S1P production. Interestingly, the expression of SPTLC2 mRNA and protein was inconsistent during adipogenesis. This may be due to increased protein degradation and a compensatory mechanism to replenish sphingolipid pools in adipocytes; however, the major reason for this is unclear at present.
We expected that the genetic suppression of SPTLC2 by shRNA might increase lipid storage in 3T3-L1 cells due to increased FA availability for TG synthesis. Instead, we found that lipid accumulation and expression of adipogenic genes were reduced significantly. It was shown previously that the genetic suppression of DES1 and the resulting inhibition of de novo sphingolipid biosynthesis led to impaired lipid accumulation and the suppression of adipogenic genes (32). These results suggest that the modulation of sphingolipid composition provides more of a regulatory role as signaling molecules. When we inhibited de novo sphingolipid biosynthesis by myriocin or fumonisin B1 in 3T3-L1 adipocytes, ceramide levels were decreased during pretreatment or early differentiation, respectively (Supplementary Fig. 3) (D0 and D3). However, the mature differentiated 3T3-L1 adipocytes did not show much change in ceramide levels or adipogenesis (Fig. 1G and I). Rather, a genetic suppression of SPTLC2 elevated cellular ceramide or sphingoid bases. In addition, elevated sphinganine and sphingosine by shRNA or fumonisin B1 did not change the status of adipogenesis. A change was only found in S1P levels, which were reduced in SPTLC2 shRNA–expressing cells during differentiation. These results indicate that S1P might be important in regulation of adipogenesis of 3T3-L1 adipocytes, as previously reported (18). The reason for ceramide elevation in SPTLC2 shRNA–expressing cells could be a compensatory mechanism, but it is not clear at this moment.
Consistent with the 3T3-L1 results, the aSPTLC2 KO mice developed severe lipodystrophy. While adipose tissues were rarely found in aSPTLC2 KO mice fed an NCD, feeding with an HFD resulted in a slight increase in adipose tissues. In these adipose tissues, the expression of SPHK1 and other adipogenic genes was dramatically reduced and the cell size of adipose tissues was reduced (Fig. 2). Notably, adipose tissues from aSPTLC2 KO mice had increased ceramide and sphingoid bases, probably via a sphingoid base supply from circulation and CerS-mediated sphingolipid biosynthesis. However, the total mass of WAT in aSPTLC2 KO mice was too small to determine whether the sphingolipid biosynthetic machinery contributes to systemic lipid pools.
Generally, the fat in lipodystrophic patients is redistributed to peripheral tissues including the liver and skeletal muscle (34–36). This ectopic fat is a major cause of metabolic dysfunctions such as insulin resistance, hepatosteatosis, and hypertriglyceridemia (27,28). Consistent with these reports, aSPTLC2 KO mice show fat redistribution to the liver. Even with NCD feeding, the livers in aSPTLC2 KO mice developed steatosis via upregulated CD36 and lipogenic genes (Fig. 3C). However, we just found a tendency of decreased FA oxidation and increased FA uptake (Fig. 3D and E). In the liver, transported FA is used for TG synthesis, and we found that the TG biosynthetic machinery was transcriptionally activated, and decreased FA oxidation could result in increased hepatic lipid accumulation. The aSPTLC2 KO mice also showed hyperglycemia, another characteristic of lipodystrophy. This is mainly due to increased hepatic glucose production and the inhibition of insulin action on hepatic suppression as demonstrated by hyperinsulinemic-euglycemic clamp studies. This is not due to ceramide, which was not elevated in the liver; however, elevated hepatic DAG may have contributed to impaired insulin signaling. Although we found elevated ceramide and sphingoid bases, the mass of adipose tissue in aSPTLC2 KO mice was too small to contribute to development of systemic insulin resistance in terms of glucose utilization.
The lipodystrophic phenotype displayed by aSPTLC2 KO mice resembles congenital generalized lipodystrophy (37–39). Importantly, a heterozygous mutation in PPARG has been found in patients with familial partial lipodystrophy, and this may impair adipocyte differentiation (40,41). Recently, Parham et al. (29) reported that S1P is a ligand for PPARγ in human endothelial cells. We confirmed that S1P-mediated PPARγ activation (Fig. 6D) and, therefore, S1P depletion as a result of aSPTLC2 deficiency may partially prevent PPARγ activation and lead to the inhibition of adipocyte differentiation. Furthermore, S1PRs are independently implicated in the proliferation and differentiation of adipocytes. When plasma S1P levels were elevated by SPHK2 adenoviral overexpression in the liver, as performed previously (24), both floxed and aSPTLC2 KO mice showed adipocyte hypertrophy (Fig. 5A). However, increased adipose tissue mass was found only in floxed mice and not in aSPTLC2 KO mice. The maintenance of basal S1PR expression could be mandatory, and S1P supplementation from circulation is inadequate for the recovery of the lipodystrophy phenotype in aSPTLC2 KO mice. Consistent with this result, we found that only the S1PR1 was downregulated in SPTLC2-suppressed 3T3-L1 adipocytes during differentiation. Recently, the reports that the pharmacological inhibition of S1PR1/3 receptors inhibits the proliferation of adipocytes suggest the involvement of the S1PR1 in adipose formation (17). We found that S1P activates the proliferation of 3T3-L1 adipocytes in a dose-dependent manner. Also of interest is SREBP-1c, which is downregulated in SPTLC2 KD 3T3-L1 cells and aSPTLC2 KO adipose tissues (Figs. 1H and 2D). We also found that overexpression of SREBP-1c restored reduced adipogenesis in SPTLC2 KD 3T3-L1 cells (Fig. 6F). Activation of the cleavage and nuclear localization of SREBP-1 by S1P in human adrenocortical cells suggests an implication of S1P in adipogenesis (42). However, the previous findings of lipodystrophy found in adipocyte-specific nuclear SREBP-1c transgenic mice and no change in WAT from SREBP-1c KO mice conflict with our results (43,44). A link between sphingolipids and SREBP-1c in adipogenesis deserves further studies.
We previously reported that adenoviral overexpression of SPHK2 and elevated S1P activate FA oxidation and reduce lipid droplets in the liver of mice fed an HFD (24). In contrast, S1P is increased by the upregulation of SPHK1 and SPHK2 during the differentiation of 3T3-L1 cells and contributes to adipogenesis (18). Our in vivo results confirm that increased S1P as a result of hepatic SPHK2 overexpression activates adipocyte hypertrophy and proliferation. These different roles of S1P contribute to the balance of FA/TG distribution and utilization in the liver and adipose tissues. Although the mode of action may differ in various tissues, these reports suggest that S1P signaling plays an important role in the regulation of systemic lipid metabolism.
Collectively, our results suggest that de novo sphingolipid biosynthesis plays an important role in the proliferation and differentiation of adipocytes. Adipocyte-specific blockade of de novo sphingolipid biosynthesis inhibits adipogenesis and leads to lipodystrophy, while excess FA is accumulated in the liver and results in hepatosteatosis. Among the sphingolipid metabolites, adipose and circulatory S1P were found to regulate the proliferation and differentiation of adipocytes via receptor-mediated and PPARγ-mediated actions. Thus, our results suggest that S1P is a signaling molecule that mediates energy homeostasis in liver and adipose tissues.
Supplementary Material
Article Information
Acknowledgments. The authors thank Derek Erion (Takeda Pharmaceutical Company, Boston, MA) for critical review of the manuscript.
Funding. This research was supported by the Bio & Medical Technology Development Program through the National Research Foundation of Korea (NRF), funded by the Korean government (MSIP) (NRF-2014M3A9B6069338) to T.-S.P. and NRF-2014M3A9D5A01073886 to C.S.C.).
Duality of Interest. No potential conflicts of interest relevant to this article were reported.
Author Contributions. S.-Y.L. and H.-Y.L. performed the experiments and wrote the manuscript. J.-H.S., S.J., Y.-J.S., G.-T.K., and B.C.L. performed the experiments for protein expression and cell culture. J.S.L., J.-H.H., and S.-Y.P. performed clamp studies and the metabolic cage experiment. S.-M.S., H.H.O., and H.J.Y. analyzed sphingolipids. X.-C.J. provided SPT2 floxed mice and performed the experiments. C.S.C. and T.-S.P. designed and supervised the studies, analyzed and interpreted data, finalized the manuscript, and obtained funding. T.-S.P. is the guarantor of this work and, as such, had full access to all the data in the study and takes responsibility for the integrity of the data and the accuracy of the data analysis.
Footnotes
This article contains Supplementary Data online at http://diabetes.diabetesjournals.org/lookup/suppl/doi:10.2337/db16-1232/-/DC1.
References
- 1.Barr EL, Cameron AJ, Balkau B, et al. HOMA insulin sensitivity index and the risk of all-cause mortality and cardiovascular disease events in the general population: the Australian Diabetes, Obesity and Lifestyle Study (AusDiab) study. Diabetologia 2010;53:79–88 [DOI] [PubMed] [Google Scholar]
- 2.Hastie CE, Padmanabhan S, Slack R, et al. Obesity paradox in a cohort of 4880 consecutive patients undergoing percutaneous coronary intervention. Eur Heart J 2010;31:222–226 [DOI] [PubMed] [Google Scholar]
- 3.Roberts AW, Clark AL, Witte KK. Review article: left ventricular dysfunction and heart failure in metabolic syndrome and diabetes without overt coronary artery disease--do we need to screen our patients? Diab Vasc Dis Res 2009;6:153–163 [DOI] [PubMed] [Google Scholar]
- 4.Monetti M, Levin MC, Watt MJ, et al. Dissociation of hepatic steatosis and insulin resistance in mice overexpressing DGAT in the liver. Cell Metab 2007;6:69–78 [DOI] [PubMed] [Google Scholar]
- 5.Rodríguez A, Gena P, Méndez-Giménez L, et al. Reduced hepatic aquaporin-9 and glycerol permeability are related to insulin resistance in non-alcoholic fatty liver disease. Int J Obes 2014;38:1213–1220 [DOI] [PubMed] [Google Scholar]
- 6.Seppälä-Lindroos A, Vehkavaara S, Häkkinen AM, et al. Fat accumulation in the liver is associated with defects in insulin suppression of glucose production and serum free fatty acids independent of obesity in normal men. J Clin Endocrinol Metab 2002;87:3023–3028 [DOI] [PubMed] [Google Scholar]
- 7.Birkenfeld AL, Shulman GI. Nonalcoholic fatty liver disease, hepatic insulin resistance, and type 2 diabetes. Hepatology 2014;59:713–723 [DOI] [PMC free article] [PubMed] [Google Scholar]
- 8.Otto TC, Lane MD. Adipose development: from stem cell to adipocyte. Crit Rev Biochem Mol Biol 2005;40:229–242 [DOI] [PubMed] [Google Scholar]
- 9.Park TS, Panek RL, Mueller SB, et al. Inhibition of sphingomyelin synthesis reduces atherogenesis in apolipoprotein E-knockout mice. Circulation 2004;110:3465–3471 [DOI] [PubMed] [Google Scholar]
- 10.Park TS, Hu Y, Noh HL, et al. Ceramide is a cardiotoxin in lipotoxic cardiomyopathy. J Lipid Res 2008;49:2101–2112 [DOI] [PMC free article] [PubMed] [Google Scholar]
- 11.Holland WL, Brozinick JT, Wang LP, et al. Inhibition of ceramide synthesis ameliorates glucocorticoid-, saturated-fat-, and obesity-induced insulin resistance. Cell Metab 2007;5:167–179 [DOI] [PubMed] [Google Scholar]
- 12.Kasumov T, Li L, Li M, et al. Ceramide as a mediator of non-alcoholic Fatty liver disease and associated atherosclerosis. PLoS One 2015;10:e0126910. [DOI] [PMC free article] [PubMed] [Google Scholar]
- 13.Hanada K. Serine palmitoyltransferase, a key enzyme of sphingolipid metabolism. Biochim Biophys Acta 2003;1632:16–30 [DOI] [PubMed] [Google Scholar]
- 14.Raichur S, Wang ST, Chan PW, et al. CerS2 haploinsufficiency inhibits β-oxidation and confers susceptibility to diet-induced steatohepatitis and insulin resistance. Cell Metab 2014;20:687–695 [DOI] [PubMed] [Google Scholar]
- 15.Xia JY, Holland WL, Kusminski CM, et al. Targeted induction of ceramide degradation leads to improved systemic metabolism and reduced hepatic steatosis. Cell Metab 2015;22:266–278 [DOI] [PMC free article] [PubMed] [Google Scholar]
- 16.Maceyka M, Payne SG, Milstien S, Spiegel S. Sphingosine kinase, sphingosine-1-phosphate, and apoptosis. Biochim Biophys Acta 2002;1585:193–201 [DOI] [PubMed] [Google Scholar]
- 17.Kitada Y, Kajita K, Taguchi K, et al. Blockade of sphingosine 1-phosphate receptor 2 signaling attenuates high-fat diet-induced adipocyte hypertrophy and systemic glucose intolerance in mice. Endocrinology 2016;157:1839–1851 [DOI] [PMC free article] [PubMed] [Google Scholar]
- 18.Hashimoto T, Igarashi J, Kosaka H. Sphingosine kinase is induced in mouse 3T3-L1 cells and promotes adipogenesis. J Lipid Res 2009;50:602–610 [DOI] [PMC free article] [PubMed] [Google Scholar]
- 19.Choi CS, Savage DB, Abu-Elheiga L, et al. Continuous fat oxidation in acetyl-CoA carboxylase 2 knockout mice increases total energy expenditure, reduces fat mass, and improves insulin sensitivity. Proc Natl Acad Sci U S A 2007;104:16480–16485 [DOI] [PMC free article] [PubMed] [Google Scholar]
- 20.Reamy AA, Wolfgang MJ. Carnitine palmitoyltransferase-1c gain-of-function in the brain results in postnatal microencephaly. J Neurochem 2011;118:388–398 [DOI] [PubMed] [Google Scholar]
- 21.Oakes ND, Kjellstedt A, Forsberg GB, et al. Development and initial evaluation of a novel method for assessing tissue-specific plasma free fatty acid utilization in vivo using (R)-2-bromopalmitate tracer. J Lipid Res 1999;40:1155–1169 [PubMed] [Google Scholar]
- 22.Kim D, Kim J, Yoon JH, et al. CXCL12 secreted from adipose tissue recruits macrophages and induces insulin resistance in mice. Diabetologia 2014;57:1456–1465 [DOI] [PubMed] [Google Scholar]
- 23.Kim JB, Wright HM, Wright M, Spiegelman BM. ADD1/SREBP1 activates PPARgamma through the production of endogenous ligand. Proc Natl Acad Sci U S A 1998;95:4333–4337 [DOI] [PMC free article] [PubMed] [Google Scholar]
- 24.Lee SY, Hong IK, Kim BR, et al. Activation of sphingosine kinase 2 by endoplasmic reticulum stress ameliorates hepatic steatosis and insulin resistance in mice. Hepatology 2015;62:135–146 [DOI] [PubMed] [Google Scholar]
- 25.Lee SY, Kim JR, Hu Y, et al. Cardiomyocyte specific deficiency of serine palmitoyltransferase subunit 2 reduces ceramide but leads to cardiac dysfunction. J Biol Chem 2012;287:18429–18439 [DOI] [PMC free article] [PubMed] [Google Scholar]
- 26.Huang-Doran I, Sleigh A, Rochford JJ, O’Rahilly S, Savage DB. Lipodystrophy: metabolic insights from a rare disorder. J Endocrinol 2010;207:245–255 [DOI] [PubMed] [Google Scholar]
- 27.Savage DB. Mouse models of inherited lipodystrophy. Dis Model Mech 2009;2:554–562 [DOI] [PubMed] [Google Scholar]
- 28.Vernochet C, Damilano F, Mourier A, et al. Adipose tissue mitochondrial dysfunction triggers a lipodystrophic syndrome with insulin resistance, hepatosteatosis, and cardiovascular complications. FASEB J 2014;28:4408–4419 [DOI] [PMC free article] [PubMed] [Google Scholar]
- 29.Parham KA, Zebol JR, Tooley KL, et al. Sphingosine 1-phosphate is a ligand for peroxisome proliferator-activated receptor-γ that regulates neoangiogenesis. FASEB J 2015;29:3638–3653 [DOI] [PMC free article] [PubMed] [Google Scholar]
- 30.Zhang QJ, Holland WL, Wilson L, et al. Ceramide mediates vascular dysfunction in diet-induced obesity by PP2A-mediated dephosphorylation of the eNOS-Akt complex. Diabetes 2012;61:1848–1859 [DOI] [PMC free article] [PubMed] [Google Scholar]
- 31.Park JW, Park WJ, Kuperman Y, Boura-Halfon S, Pewzner-Jung Y, Futerman AH. Ablation of very long acyl chain sphingolipids causes hepatic insulin resistance in mice due to altered detergent-resistant membranes. Hepatology 2013;57:525–532 [DOI] [PubMed] [Google Scholar]
- 32.Barbarroja N, Rodriguez-Cuenca S, Nygren H, et al. Increased dihydroceramide/ceramide ratio mediated by defective expression of degs1 impairs adipocyte differentiation and function. Diabetes 2015;64:1180–1192 [DOI] [PMC free article] [PubMed] [Google Scholar]
- 33.Ussher JR, Koves TR, Cadete VJ, et al. Inhibition of de novo ceramide synthesis reverses diet-induced insulin resistance and enhances whole-body oxygen consumption. Diabetes 2010;59:2453–2464 [DOI] [PMC free article] [PubMed] [Google Scholar]
- 34.Garg A. Acquired and inherited lipodystrophies. N Engl J Med 2004;350:1220–1234 [DOI] [PubMed] [Google Scholar]
- 35.Misra A, Peethambaram A, Garg A. Clinical features and metabolic and autoimmune derangements in acquired partial lipodystrophy: report of 35 cases and review of the literature. Medicine (Baltimore) 2004;83:18–34 [DOI] [PubMed] [Google Scholar]
- 36.Decaudain A, Vantyghem MC, Guerci B, et al. New metabolic phenotypes in laminopathies: LMNA mutations in patients with severe metabolic syndrome. J Clin Endocrinol Metab 2007;92:4835–4844 [DOI] [PubMed] [Google Scholar]
- 37.Garg A. Clinical review#: lipodystrophies: genetic and acquired body fat disorders. J Clin Endocrinol Metab 2011;96:3313–3325 [DOI] [PMC free article] [PubMed] [Google Scholar]
- 38.Agarwal AK, Arioglu E, De Almeida S, et al. AGPAT2 is mutated in congenital generalized lipodystrophy linked to chromosome 9q34. Nat Genet 2002;31:21–23 [DOI] [PubMed] [Google Scholar]
- 39.Magré J, Delépine M, Khallouf E, et al.; BSCL Working Group . Identification of the gene altered in Berardinelli-Seip congenital lipodystrophy on chromosome 11q13. Nat Genet 2001;28:365–370 [DOI] [PubMed] [Google Scholar]
- 40.Agarwal AK, Garg A. A novel heterozygous mutation in peroxisome proliferator-activated receptor-gamma gene in a patient with familial partial lipodystrophy. J Clin Endocrinol Metab 2002;87:408–411 [DOI] [PubMed] [Google Scholar]
- 41.Rosen ED, Sarraf P, Troy AE, et al. PPAR gamma is required for the differentiation of adipose tissue in vivo and in vitro. Mol Cell 1999;4:611–617 [DOI] [PubMed] [Google Scholar]
- 42.Ozbay T, Rowan A, Leon A, Patel P, Sewer MB. Cyclic adenosine 5′-monophosphate-dependent sphingosine-1-phosphate biosynthesis induces human CYP17 gene transcription by activating cleavage of sterol regulatory element binding protein 1. Endocrinology 2006;147:1427–1437 [DOI] [PubMed] [Google Scholar]
- 43.Shimano H, Shimomura I, Hammer RE, et al. Elevated levels of SREBP-2 and cholesterol synthesis in livers of mice homozygous for a targeted disruption of the SREBP-1 gene. J Clin Invest 1997;100:2115–2124 [DOI] [PMC free article] [PubMed] [Google Scholar]
- 44.Shimomura I, Hammer RE, Richardson JA, et al. Insulin resistance and diabetes mellitus in transgenic mice expressing nuclear SREBP-1c in adipose tissue: model for congenital generalized lipodystrophy. Genes Dev 1998;12:3182–3194 [DOI] [PMC free article] [PubMed] [Google Scholar]
Associated Data
This section collects any data citations, data availability statements, or supplementary materials included in this article.