Abstract
Cancer and chronic infections induce T cell exhaustion, a hypofunctional fate carrying distinct epigenetic, transcriptomic, and metabolic characteristics. However, drivers of exhaustion remain poorly understood. As intratumoral exhausted T cells experience severe hypoxia, we hypothesized metabolic stress alters their responses to other signals, specifically persistent antigenic stimulation. In vitro, while CD8+ T cells experiencing continuous stimulation or hypoxia alone differentiate into functional effectors, the combination rapidly drove T cell dysfunction consistent with exhaustion. Continuous stimulation promoted Blimp-1-mediated repression of PGC1α-dependent mitochondrial reprogramming, rendering cells poorly responsive to hypoxia. Loss of mitochondrial function generated intolerable levels of ROS, sufficient to promote exhausted-like states, in part through phosphatase inhibition and consequent NFAT activity. Reducing T cell-intrinsic ROS and lowering tumor hypoxia limited T cell exhaustion, synergizing with immunotherapy. Thus, immunologic and metabolic signaling are intrinsically linked: through mitigation of metabolic stress, T cell differentiation can be altered to promote more functional cellular fates.
INTRODUCTION
T cell differentiation is a complex process of integrating numerous signals from the environment, engaging transcriptional machinery, and making epigenetic changes to support that new functional program1. For CD8+ T cells, this results in acquisition of various fates: short-lived, cytotoxic effector programs and long-lived, self-renewing memory programs2. However, a fate alternative to effector or memory differentiation is induced in pathologies in which antigen persists, notably chronic infections and cancer: T cell exhaustion. Under persistent inflammatory cues, T cells progressively lose polyfunctionality and renewal capacity, failing to control infection or malignant spread3. T cells progressively upregulate co-inhibitory molecules, ultimately reaching a terminally differentiated state expressing high levels of PD-1 and multiple co-inhibitory and costimulatory markers (LAG-3, Tim-3, TIGIT, and 4–1BB). Exhausted cells are defined by several transcription factor networks including Eomesodermin, BATF, partner-less NFAT1, TOX, and the transcriptional repressor Blimp-14–8, exploting an altered epigenetic landscape defining the dysfunctional lineage9–11. Exhaustion has an evolving definition12 and can only be reliably produced in vivo, severely limiting the capacity to identify drivers of this fate.
Differentiation is typically linked to immunologic cues received by a T cell: costimulatory or cytokine signals supporting one fate or another. However, the metabolic composition of the environment, nutrient sensors detecting that milieu, and the intrinsic metabolic state of a T cell are also crucial in dictating the ultimate outcome of differentiation13. Metabolic signals are critical to understand, as T cell activation and differentiation occur in various metabolically-distinct tissue environments. In cancer, elevated tumor cell metabolism can dramatically alter the nutrient milieu T cells experience14. We have previously shown T cells infiltrate tumors at a severe metabolic disadvantage: repressed capacity for glucose uptake and loss of functional mitochondrial mass, concomitant with the development of exhaustion15. We and others have also shown correcting this faulty metabolic state (through a variety of approaches) can invigorate immunity and enable immunotherapeutic outcomes16–20.
While it was previous thought anti-PD-1, for instance, blocks PD-1 signaling on the most terminally exhausted T cells, this ‘direct’ model has been called into question, suggesting successful PD-1 blockade likely acts on less differentiated, ‘progenitor’-like T cells21, and high proportions of tumor-infiltrating terminally exhausted T cells predict resistance to anti-PD-121,22. Further, while metabolic correlates, like the capacity of a tumor cell to consume oxygen and generate hypoxia, can predict resistance to PD-1 blockade18, these environmental stressors have been shown to have disparate effects on T cell function. Hypoxia-inducible factor 1 alpha (HIF1α) and its negative regulators have been previously implicated in T cell activation23, and expansion of therapeutic cells under hypoxic conditions enhances tumor-killing capacity24. However, hypoxia is also clearly immunosuppressive, both in isolation and in vivo25. So, while metabolic stress and T cell exhaustion are linked, what remains unclear is whether T cell exhaustion promotes a program that causes a change in cellular metabolism, or if metabolic insufficiency and stress directly contribute to the exhausted T cell fate.
Here we show while hypoxia is a common metabolic stress present in tumor microenvironments, terminally exhausted, intratumoral T cells differentially experience more hypoxia, suggesting those metabolic stresses play roles in their biology. While hypoxia alone cannot induce T cell dysfunction, hypoxia alters how T cells respond to other signals. We developed a system to interrogate how persistent antigen stimulation and hypoxia play roles in T cell exhaustion, revealing continuous antigenic stimulation under hypoxia results in rapid, severe T cell dysfunction consistent with exhaustion. This in vitro system allowed for interrogation of the biology underlying T cell exhaustion, suggesting metabolic stress originating in the mitochondria can accelerate terminal differentiation, and targeting these processes may improve immunotherapy for cancer.
RESULTS
Exhausted intratumoral T cells experience severe hypoxia
While hypoxia is common within tumors, it is unclear whether subsets of intratumoral T cells experience more hypoxia than others. We first phenotyped CD8+ tumor-infiltrating lymphocytes (TILs) in 8–10 mm (day 14) B16 melanoma tumors along the ‘spectrum’ of exhaustion (Extended Data Fig. 1a). Terminally exhausted T cells were defined as expressing high and sustained levels of PD-1 and co-expressing Tim-3 (Fig. 1a), possessing high LAG3 and Tox expression, low TCF1 expression, and failing to secrete interleukin 2 (IL-2) upon restimulation (Fig. 1b–e). Antigen-specific responses were measured by transferring gp100-specific Pmel-1 T cells into B16-bearing mice, restimulating cells once they had reached terminal exhaustion (Extended Data Fig. 1b). Compared to LN-resident Pmel-1 T cells, tumor-resident, gp100-restimulated T cells were far less polyfunctional12,21 (Fig. 1f). Mice bearing B16 tumors were infused with pimonidazole, a hypoxia tracer, prior to sacrifice, revealing terminally exhausted T cells experience the highest degree of hypoxia, using anti-pimonidazole and anti-Hif1α antibodies, compared to other subsets (Fig. 1g,h). Thus, hypoxia is a major metabolic component of a tumor’s metabolic landscape, and terminally exhausted T cells experience elevated hypoxia compared to other subsets.
Figure 1: Terminally exhausted CD8+ tumor-infiltrating T cells experience high levels of hypoxia.
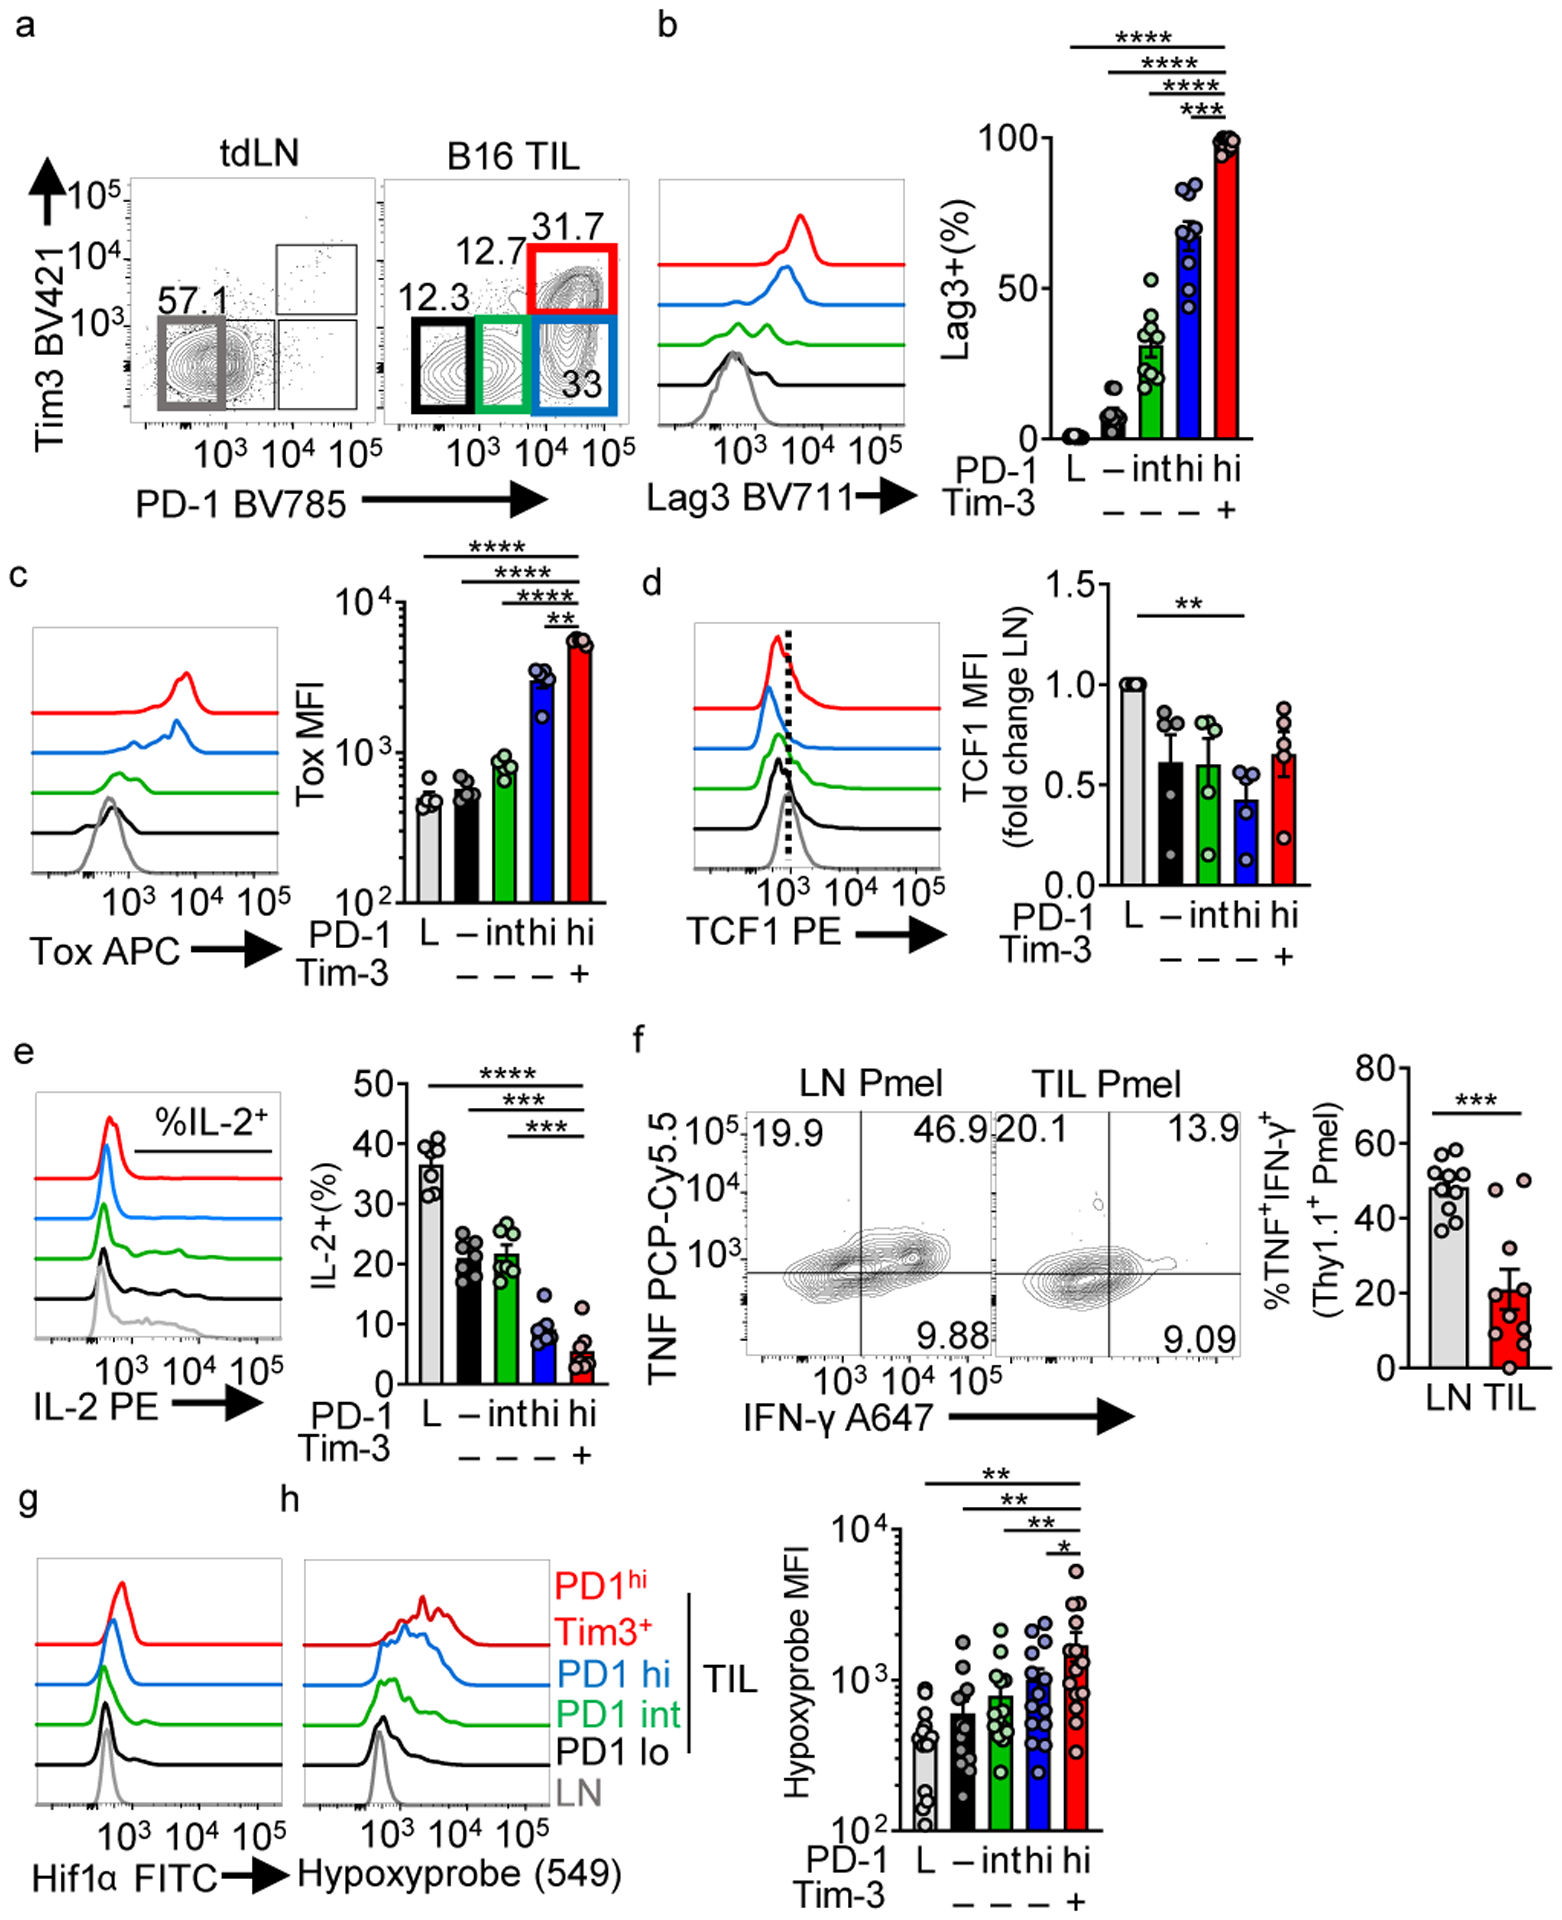
(a) Flow cytogram of WT CD8+ LN and TIL PD-1 and Tim-3 staining. Groups are labeled PD-1 low in lymph node (L), and in the TIL, groups are PD-1–, PD-1 int, PD-1 hi, and PD-1hiTim3+ (b) Lag-3 (n=9 mice), (c) Tox expression (n=5 mice), and (d) TCF1 expression (n=5 mice) as in b. (e) IL-2 production with 16 h PMA/Iono stimulation (final 5 h with a protein transport inhibitor) (n=7 mice) (f) TNF vs IFN-γ production (n=10) in gp100 specific Pmel T cell LN and TIL with 16 h gp100 stimulation (final 5 h with a protein transport inhibitor). (g) Histogram overlays of HIF1α staining in WT CD8+ LN and TIL based on PD-1 and Tim-3 staining. (h) Hypoxyprobe (anti-pimonidazole) representative staining and tabulation after in vivo pimonidazole injection into mice 1hr before sacrifice. n=14 mice. Data are representative of 3–5 independent experiments. *p < 0.05, **p < 0.01, ***p < 0.001, ****p < 0.0001 by one-way ANOVA with Dunnett’s multiple comparison test (b-e, h) or unpaired T test (f). Error bars indicate SEM.
T cells continuously stimulated under hypoxia appear exhausted
To determine if hypoxia can drive exhaustion, we sought to model exposure to this stress in vitro. While HIF1α activation has been previously associated with upregulation of co-inhibitory molecules, expansion of T cells under hypoxic conditions results in increased cytolytic T cell function, suggesting hypoxia’s inhibitory effects may depend on the presence of other signals23,24. As exhausted T cells were originally described in context of persistent antigen, we hypothesized hypoxia has distinct effects under conditions of continuous activation. OT-I T cell antigen receptor (TCR) transgenic (Tg) T cells were activated with cognate peptide overnight in atmospheric oxygen (21% O2, “normoxic”) conditions and then split into multiple conditions: cultured alone, in the presence of B16 cells, or B16 expressing ovalbumin (B16OVA). This coculture occurred in normoxia or under conditions of average tumor hypoxia (1.5%) for 5 days with IL-2 (Extended Data Fig. 1c). T cells remained functional when cocultured with antigen-expressing tumor cells under normoxia or with antigen-negative tumor cells under hypoxia, but persistent antigen under hypoxic conditions drove elevated PD-1 and Tim-3, a loss of polyfunctionality in cytokine production, and poor expansion (Extended Data Fig. 1d–f).
OT-I T cells express an extremely avid TCR, and the tumor:T cell coculture system produces other stresses, as tumor cells consume nutrients and secrete cytokines and toxic metabolites, exacerbated under hypoxic co-culture. To mitigate these and other unknown confounders coming from a tumor:T cell coculture, we further reduced the system using purified polyclonal CD8+ T cells and ‘off-the-shelf’ stimulatory magnetic beads (coated with anti-CD3/anti-CD28). Notably, we used flow cytometrically sorted CD44+ cells for this assay to better mimic tumor-infiltrating T cells’ activated phenotype, although similar results were obtained using bulk CD8+ and naïve (CD62LhiCD44lo) T cells (data not shown). CD8+ T cells were stimulated with beads overnight in the presence of IL-2 and IL-12, then washed and split into four conditions. Cells were expanded with IL-2 (‘acute’ activation) or cocultured with beads and IL-2 (‘continuous’ activation) for 5 days, with media changed regularly to prevent nutrient depletion. This post-activation expansion step occurred under normoxic or hypoxic conditions in round-bottom plates, keeping cells and beads in close contact for continuous stimulation (Fig. 2a). These manipulations produced phenotypes observed in tumor:T cell coculture: T cells maintained functionality in the presence of hypoxia or continuous stimulation alone, but combination of both stressors produced an exhausted-like state: high coinhibitory molecule expression (Fig. 2b–d), expression of CD39 (Fig. 2e), Tox (Fig. 2f), and, importantly, possessing severely limited polyfunctional cytokine production (Fig. 2g). Consistent with previous data, hypoxia alone enhanced T cell function, both as a population but also on a per-cell basis. This dysfunctional state was maintained even after removal from stress conditions: 5 days of expansion, in or out of hypoxia, could not rescue the dysfunctional phenotype (Extended Data Fig. 2a). The combination also induced a metabolic state we previously associated with exhausted T cells: mitochondrial respiratory capacity was severely repressed15 (Fig. 2h).
Figure 2: Continuous activation under hypoxia induces an exhausted-like dysfunctional state in CD8+ T cells.
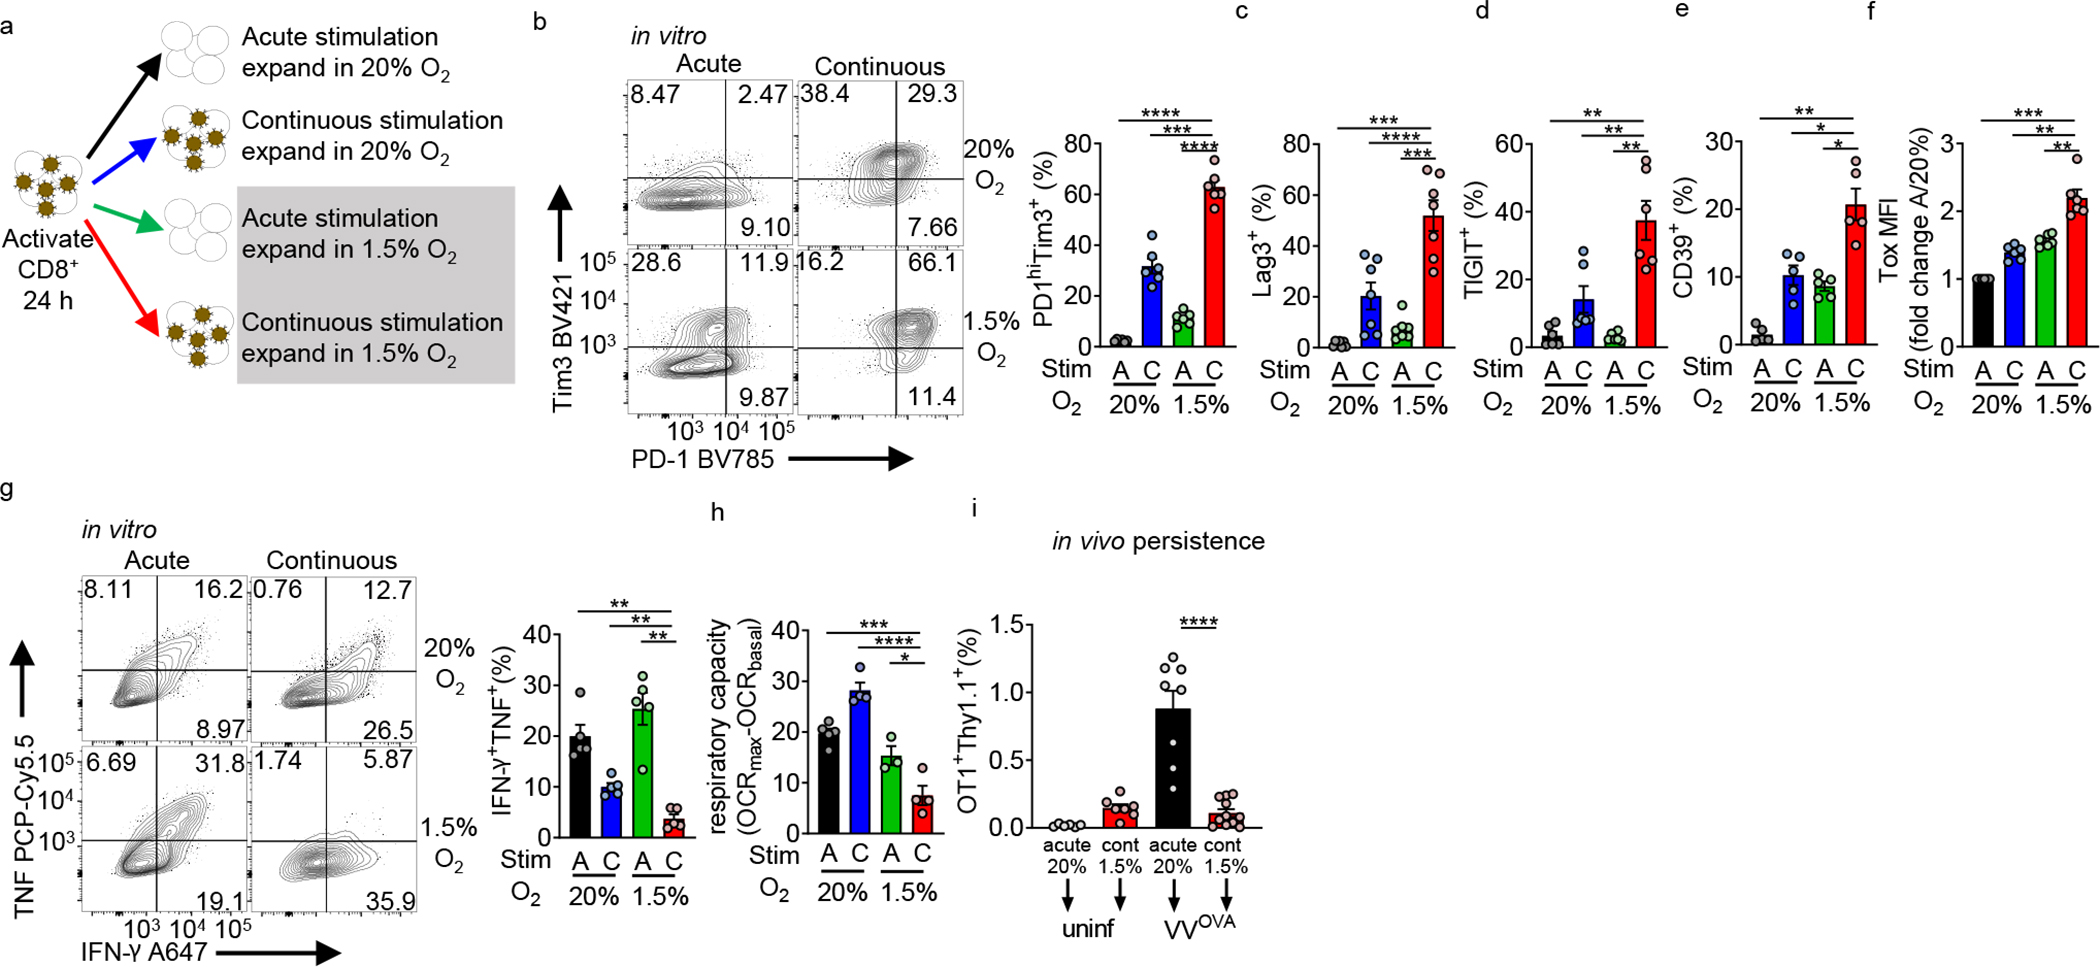
(a) Experimental scheme. CD44hi CD8+ T cells are sorted from B6 mice, then activated with anti-CD3/anti-CD28-coated magnetic beads plus 25 U//mL IL-2 and 10 ng/mL IL-12 in normoxia (20% O2). After 24 hours, cells are washed and expanded in IL-2, but placed into various culture conditions (removing beads or continuous cocoulture with beads, under normoxia or 1.5% O2 hypoxia). (b) (left) Flow cytograms of PD-1 and Tim-3 staining in live CD8+ T cells generated using as in a accompanied by quantitation. n=6. (c–f) Quantification of Lag-3 (n=7), Tigit (n=6), CD39 (n=5), and Tox (n=6) staining as in b. (g) (left) Flow cytograms and tabulation of TNF and IFN-γ production after 16 h of PMA-ionomycin restimulation of live CD8+ T cells generated as in b. n=5. (h) Mitochondrial spare respiratory capacity (SRC: difference between basal OCR values and maximal OCR values after FCCP uncoupling) of T cells generated as in a. AN n=4, CN n=4, AH n=3, CH n=4. Graph represents 1 of 3 independent experiments. (i) Flow cytometric quantification of OT-I T cells generated as in a, then adoptively transferred into B6 mice infected intraperitoneally with 1×10⁶ PFU Vaccinia-OVA. n=3 independent in vitro experiments, transferred into multiple mice. All data are representative of 3–6 independent experiments. *p < 0.05, **p < 0.01, ***p < 0.001, ****p < 0.0001 by one-way ANOVA with Dunnett’s multiple comparison test. Error bars indicate SEM.
To assess persistence and renewal capacity of these cells, OT-I T cells were acutely activated or continuously stimulated under hypoxia prior to transfer into mice infected with OVA-expressing Vaccinia virus. Continuous stimulation under hypoxia limited the ability of T cells to respond to antigen in vivo (Fig. 2i), indicating limited renewal capacity, consistent with phenotypes observed in tumor-infiltrating exhausted T cells3,21.
We next assessed the effects of these stressors on proliferation. Use of proliferation dyes showed continuous stimulation or hypoxia had modest impacts on proliferation (Extended Data Fig. 2b). However, these manipulations did impact cellular accumulation. Continuous stimulation increased cell death in late cell divisions, exacerbated under hypoxia. By day 6, continuous stimulation under hypoxia showed decreased accumulation (population doublings) compared to control conditions, in agreement with previous work3,21 (Extended Data Fig. 2c–d). Analysis of various markers per division suggested the phenotypes observed were not driven by examining less proliferative or undifferentiated cells, rather that cells were different on a per-division basis (Extended Data Fig. 2e–h). Thus, continuous stimulation under hypoxia drives T cells to proliferate and express co-inhibitory molecules, but be prone to cell death, in agreement with reports of exhausted T cells expressing Ki67 but not accumulating21,26.
Next, we determined cell-intrinsic consequences of continuous stimulation under hypoxia. BNIP3, a known target of hypoxic signaling, was elevated under hypoxia and mTORC1 was activated with continuous stimulation (Fig. 3a). RNA sequenced from these four conditions was used to compare transcriptomes between cultures and previously published data. Principal component analyses showed all four populations were transcriptomically distinct (Fig. 3b). Analysis of differentially expressed genes within our dataset showed continuous stimulation under hypoxia did not induce a combination of the ‘continuous stimulation’- and ‘hypoxia’-induced genes, but rather drove a distinct transcriptional profile (Fig. 3c, Supplementary Table 1–6). Gene ontology suggested shared gene clusters between continuous stimulation conditions were associated with negative regulation and metabolic changes (clusters 3 and 5) (Fig. 3b). Genes associated with continuous stimulation under hypoxia conditions (clusters 1 and 7) were predominantly driven by antiviral and antiproliferative genes, in line with previous exhaustion data3,27 (Fig. 3c).
Figure 3: Continuous activation under hypoxia induces distinct intracellular programs from either stressor alone.
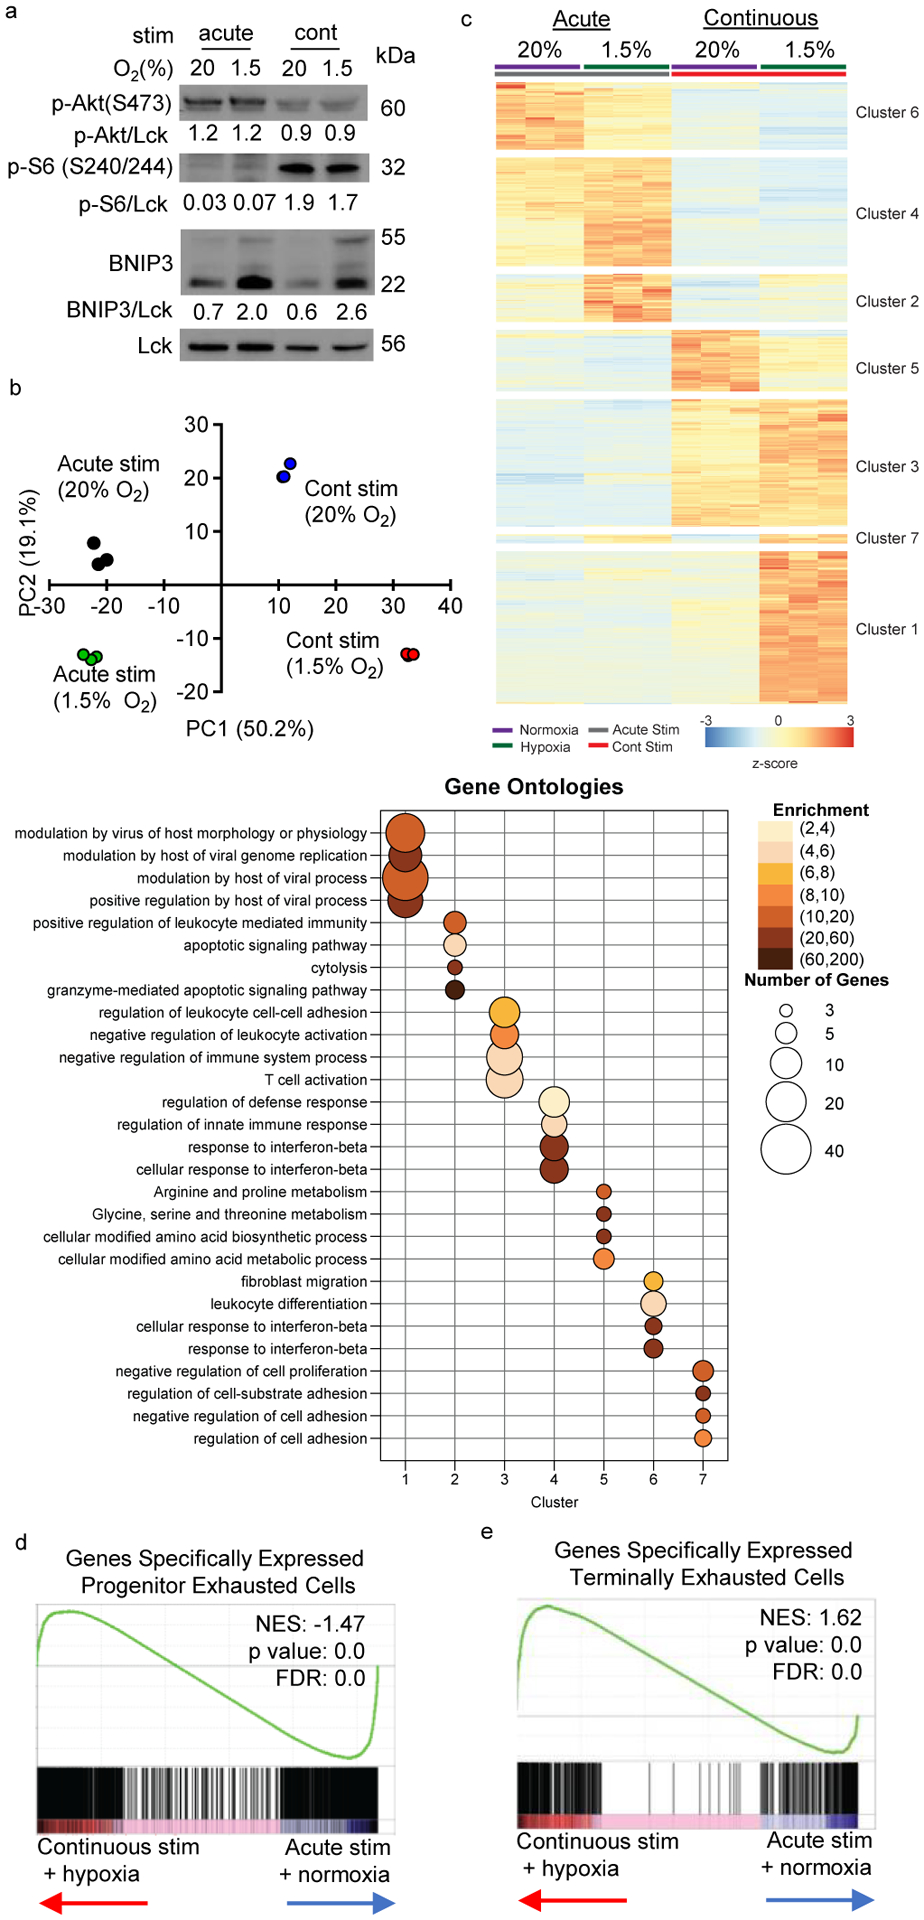
(a) Representative immunoblot of mTOR and HIF1 signaling components in T cells stimulated in the four in vitro conditions in Fig. 2. (b) Principal component analysis (PCA) based on transcriptomic data from RNAseq data of CD8+ T cells incubated in the four conditions as in Fig. 2 each group n=3. (c) Heatmap and unsupervised hierarchical clustering of the average expression of 767 differentially expressed genes from pairwise comparisons (log2 fold change >2, adjusted p value <0.05). Gene ontology analysis of genes defining each cluster are represented in the accompanying bubble plot. (d, e) Leading edge plots of geneset enrichment analysis (GSEA) of acute/normoxic vs continuous/hypoxic culture RNAseq compared to previously published transcriptional profiles of progenitor versus terminally exhausted T cells in B16 TIL. Heatmaps for this GSEA appear in Extended Data. All data are representative of 3 independent experiments.
Gene set enrichment analysis (GSEA) was performed using differentially expressed genes derived from published transcriptomes of less differentiated “progenitor exhausted” T cells versus PD-1hiTim-3+ “terminally exhausted” T cells from B16 melanoma21 (Supplementary Table 7), overwhelmingly suggesting continuous stimulation under hypoxia produced a transcriptional state associated with terminal exhaustion (Fig. 3d,e, Extended Data Fig. 3a,b). Analysis of key immunologic genes within each dataset revealed while continuous activation or hypoxia each could induce some transcriptional changes associated with exhaustion, the combination promoted sustained expression of a number of exhaustion-specific genes (Ccl3, Adora2b, Lag3, Tnfrsf9, Nr4a2, Prdm1) and the repression of stemness and survival genes (Tcf7, Bcl2, Il2) (Extended Data Fig. 3a,b). Thus, while T cells can respond adequately to continuous stimulation or hypoxic stress, the combination results in differentiation to an exhausted-like dysfunctional fate.
HIF1α is dispensable for hypoxia-induced dysfunction
While hypoxia induces a well-described transcriptional program via the VHL-HIF1α machinery, HIF1α-deficient T cells (from HIF1af/fCd4Cre mice) still upregulated inhibitory receptors PD-1 and Tim3 and lost polyfunctionality during continuous stimulation with hypoxia (Extended Data Fig. 4a,b). While our transcriptomic data (Fig. 3) suggested hypoxic signaling was still intact (both hypoxic culture conditions induced expression of HIF targets like glucose transporters), there were notable differences in both the breadth and degree of upregulation when cells were experiencing acute versus continuous stimulation (Extended Data Fig. 4c,d). Consistent with a repressed mitochondrial program, hypoxic conditions produced T cells much more avid to take up the fluorescent glucose tracer 2-NBD-glucose compared to the acute/normoxia condition (Extended Data Fig. 4c). Thus, another non-HIF factor induced by either continuous stimulation or hypoxia might alter metabolic sufficiency and promote terminal exhaustion.
Blimp-1 represses PGC1α under continuous stimulation
Persistent antigen is crucial for altered differentiation toward exhaustion, but its metabolic consequences are less clear. As continuous stimulation alone did not produce overt metabolic repression, persistent stimulation may activate a transcriptional repressor preventing metabolic reprogramming. Blimp-1 (encoded by Prdm1) is such a repressor, highly upregulated in terminally exhausted CD8+ T cells in B16 melanoma (Fig. 4a) and under conditions of continuous activation under hypoxia (Fig. 4b, Extended Data Fig. 3b). We have previously associated PGC1α (encoded by Ppargc1a), a transcription co-activator coordinating mitochondrial biogenesis and antioxidant activity, with avoidance of exhaustion in T cells15. T cells continuously activated under hypoxia in vitro also repress PGC1α expression (Fig. 4c). We next determined if Blimp-1 could repress PGC1α, finding enforced Blimp-1 expression could repress the activity of a Ppargc1a promoter construct in 293T cells, without affecting viability (Fig. 4d, Extended Data Fig. 5a). CD8+ T cells from Prdm1f/fCd4Cre mice were resistant to dysfunction through continuous activation under hypoxia (Figs. 4e,f), failing to repress Ppargc1a expression under continuous activation (Fig. 4g).
Figure 4: Continuous activation causes Blimp-1-mediated repression of PGC1α.
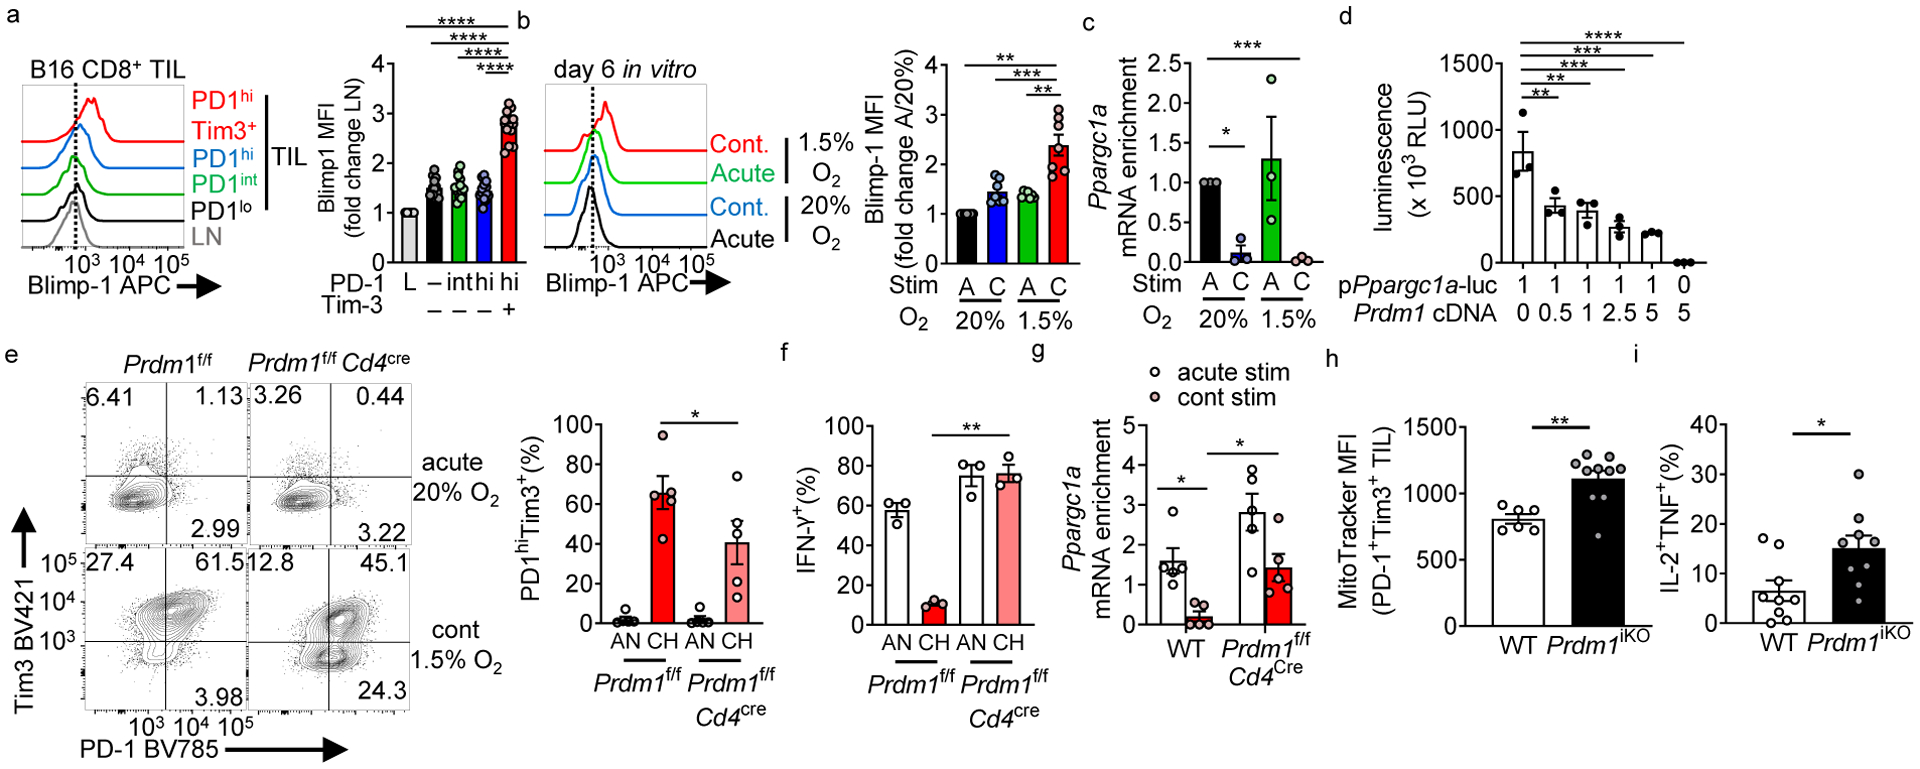
(a) Blimp-1 staining in CD8+ LN and TIL based on PD-1 and Tim-3 expression. n=14 mice. (b) Blimp-1 staining in in vitro cultured CD8+ T cells stimulated continuously under hypoxia, normalized in quantitation to acute stim in normoxia. n=7. (c) Ppargc1a (encoding PGC1α) mRNA expression in cells cultured as in Fig. 2. each group n=3. (d) Luciferase assay of 293T cells co-transfected with a plasmid containing the mouse PGC1α promoter (Ppargc1ap) driving luciferase and mouse Prdm1 (encoding Blimp-1) at indicated ratios. n=3. (e) PD-1 and Tim-3 staining in CD8+ T cells isolated from Prdm1f/fCd4cre mice or littermate controls stimulated continuously under hypoxia. n=5. (f) IFN-γ production in T cells from e after 16 h PMA/ionomycin restimulation (last 5 h with a protein transport inhibitor). n=3. (g) Ppargc1a mRNA expression in WT or Blimp-1 deficient T cells acutely or continuously stimulated in vitro. n=5 mice per group. (h) MitoTracker FM staining in PD-1hiTim3+ TIL CD8+ T cells from B16-bearing animals bearing an inducible CD8-specific deletion of Blimp-1 (Prdm1f/f E8ICre-ERT2 Rosa26-LSL-TdTomato (termed Prdm1iKO)). WT n=6 mice, Prdm1iKO n=10 mice. (i) IFN-γ and TNF production in CD8+ TIL after 16 h PMA/ionomycin restimulation, as in h. WT n=9 mice, Prdm1iKO n=9 mice. All flow data are representative of 3–6 independent experiments. *p < 0.05, **p < 0.01, ***p < 0.001, ****p < 0.0001 by one-way ANOVA with Dunnett’s multiple comparison test (a-d), paired T test (e-f), one-way ANOVA with repeated measures (g), and unpaired T test (h-i). Error bars indicate SEM.
We next determined the requirement for Blimp-1 for metabolic repression in vivo. Transferring naïve, Blimp-1-deficient OT-I TCR-Tg T cells into mice bearing B16OVA tumors (Extended Data Fig. 5b) showed Blimp-1 was required to repress mitochondrial mass in tumor-infiltrating T cells (Extended Data Fig. 5b). Previous reports have showed Blimp-1-deficient T cells do not effectively differentiate into exhausted T cells, distorting our analysis using T cells already Blimp-1 deficient6,28. To determine the role for Blimp-1 in T cells already terminally exhausted (and part of the endogenous anti-tumor T cell response), we utilized an inducible, CD8-specific Cre (E8I-CreERT2 generated by Dario Vignali) bred to Prdm1f/f animals29. These mice, termed Prdm1iKO, bore a Rosa26-LSL-TdTomato recombination reporter; which showed most CD8+ T cells in the tumor had Cre activity after tamoxifen treatment (Extended Data Fig. 5d). We injected B16 cells into untreated mice and let tumors reach 5 mm in diameter (thus harboring terminally exhausted CD8+ T cells). These tumor-bearing Prdm1iKO mice were then treated with tamoxifen for 5 days, and recombined, TdTomato+ PD-1hiTim3+ TIL were immunometabolically analyzed (Extended Data Fig. 5e–g). Tamoxifen treatment did not alter proportions of co-inhibitory molecule-expressing, terminally exhausted TIL, and the vast majority activated the Rosa26 reporter and deleted Blimp-1 (Extended Data Fig. 5e–g). Loss of Blimp-1 in PD-1hiTim3+ TILs resulted in recovery of mitochondrial mass and polyfunctionality as read-out by IL-2 and tumor necrosis factor (TNF) production (Fig. 4h, i). Notably, consistent with our in vitro data, the HIF1α axis was unchanged by Blimp-1: HIF1α-deficient CD8+ T cells in vivo still upregulated Blimp-1 in the hypoxic tumor microenvironment, and Blimp-1 deficient CD8+ T cells in vivo still retained HIF1α expression (Extended Data Fig. 5h,i). Thus, continuous activation upregulates Blimp-1, altering how T cells experience metabolic stress via repression of PGC1α-mediated metabolic reprogramming.
ROS drives exhaustion by acting as a phosphatase inhibitor
We next sought the underlying mechanism driving dysfunction induced through inadequate responses to hypoxia. To understand how PGC1α represssion was affecting TIL function, we retrovirally overexpressed PGC1α (PGC1αOE) in Pmel T cells and transferred them into B16-bearing mice, analogous to a system we previously used in OT-I T cells to enhance adoptive cell therapy of B16-OVA15. RNAseq analysis of PGC1αOE tumor-infiltrating Pmel-1 T cells revealed expectedly increased genes involved in mitochondrial metabolism (Supplementary Table 8). GSEA using progenitor and terminal exhaustion datasets (analogous to analysis in Fig. 3), showed PGC1α overexpression prevented expression of genes associated with terminal exhaustion (Extended Data Fig. 5b). Notably, PGC1α overexpression did not result in T cells bearing a ‘progenitor exhausted’ signature, suggesting metabolic reprogramming resulted in altered rather than slowed differentiation (Extended Data Fig. 6b). Thus, consistent with our previous data, PGC1α overexpression resulted in mitochondrial reprogramming and differentiation away from the exhausted phenotype.
Pathway analysis also delineated pathways upregulated by PGC1α. Consistent with their enhanced effector function, “graft-versus-host disease” genes were upregulated most significantly (Extended Data Fig. 6c, pathway 1). As PGC1α functions through engaging mitochondrial biogenesis and upregulation of antioxidant enzymes, regulation of reactive oxygen species (ROS) was significantly enriched in PGC1αOE compared to control (Extended Data Fig. 6c, pathway 2). Indeed, tumor-infiltrating PGC1αOE Pmel-1 T cells showed decreased mitochondrial ROS upon tumor infiltration (Fig. 5a), suggesting PGC1α acts, in part, to mitigate ROS upon tumor infiltration.
Figure 5: Continuous activation under hypoxia increases mitochondrial ROS which is sufficient to drive an exhausted-like dysfunctional program.
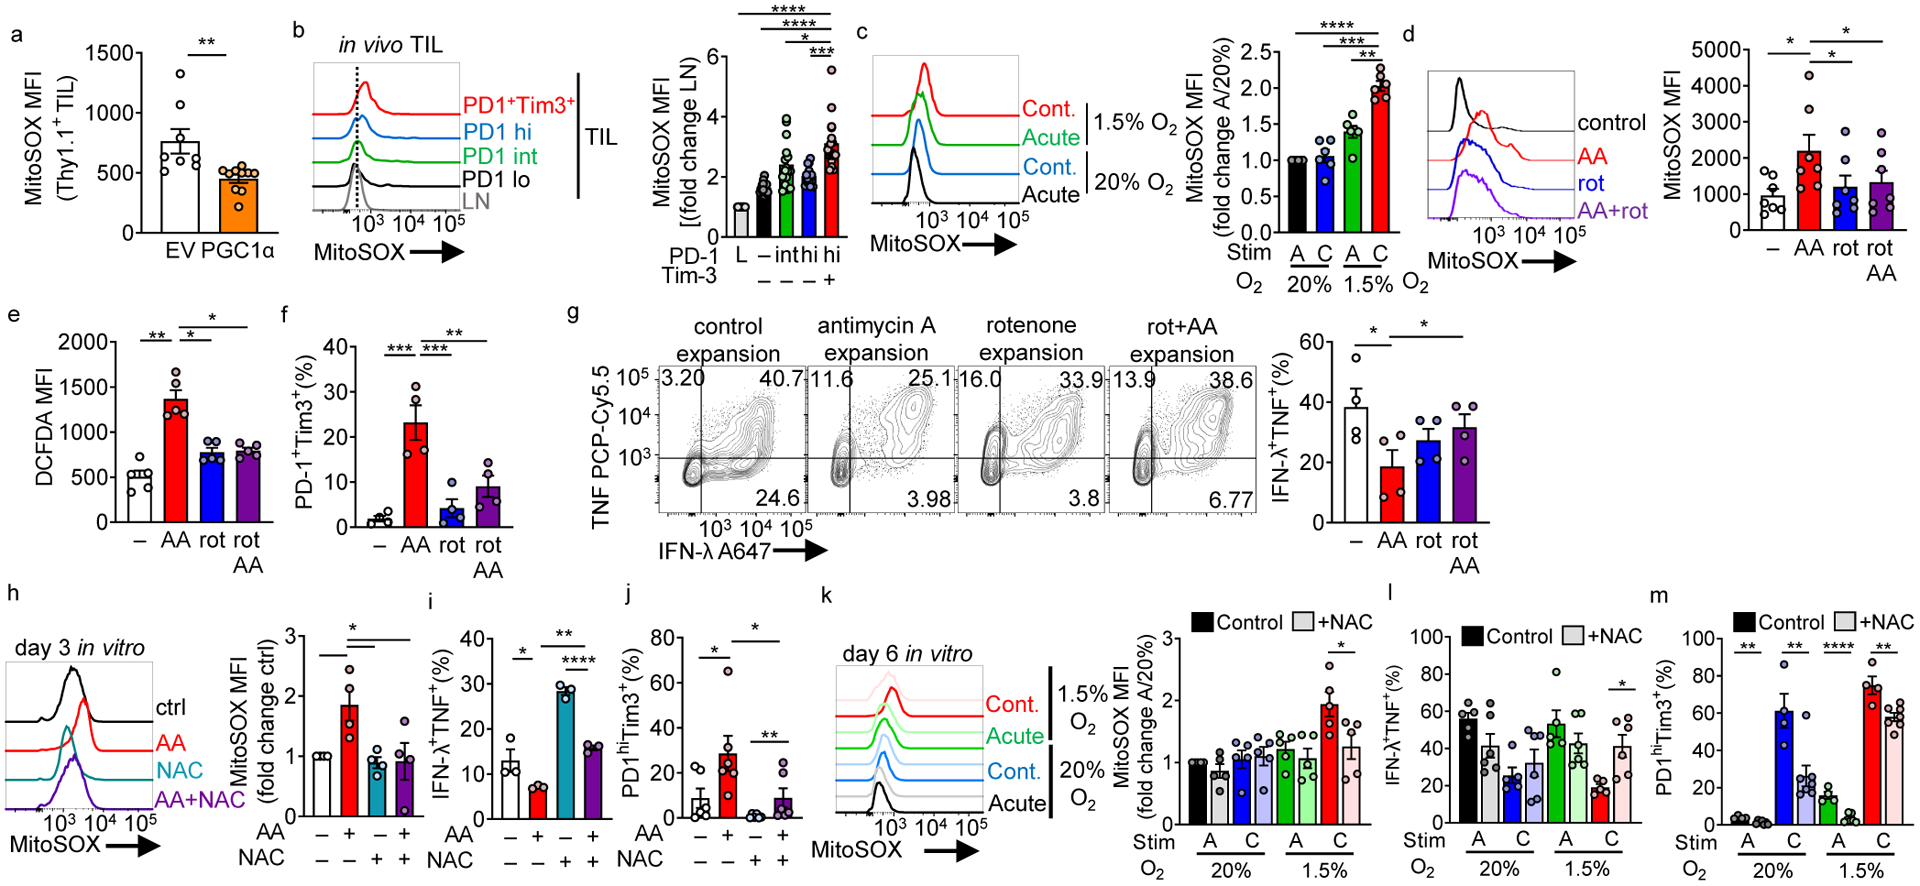
(a) MitoSOX (mitochondrial superoxide) staining of adoptively transferred, B16-infiltrating Pmel Thy1.1+ T cells transduced with a PGC1α retroviral expression vector (PGC1αOE) or empty vector (EV) control. EV n=8 mice, PGC1αOE n=10 mice (b) MitoSOX staining in CD8+ LN and TIL based on PD-1 and Tim-3 expression (quantitation normalized to LN cells). n=16 mice. (c) MitoSOX staining in continuous stimulation under hypoxia, normalized to acute stim in normoxia. Each group n=6. (d) MitoSOX staining of CD8+ T cells activated overnight and expanded in IL-2 and either 0.04mM mitochondrial complex III inhibitor antimycin A, 0.4mM complex I inhibitor rotenone, or simultaneous combination of the two for 3 days. n=7. (e) As in d but using the cellular ROS detector DCFDA. n=5. (f) %PD1hiTim3+ cells as in d cultured for 6 days. n=4. (g) IFN-γ and TNF production in T cells generated as in d for 7 days, after stimulation with anti-CD3/anti-CD28. n=4 (h) MitoSOX staining of CD8+ T cells activated overnight and then expanded in IL-2 and either antimycin A, 10 mM n-acetyl-cysteine (NAC), or simultaneous combination of the two for 3 days. Each group n=4. (i) IFN-γ and TNF production in T cells in h after stimulation with anti-CD3/anti-CD28 overnight. n=3 (j) %PD1hiTim3+ cells in cells as in h. n=6. (k) MitoSOX (control n=5, NAC n=5), (l) IFN-γ and TNF production (control n=5, NAC n=6), and (m) PD-1 and Tim3 staining (control n=4, NAC n=7), in continuous stimulation under hypoxia +/− 10mM NAC. All data are representative of 3–7 independent experiments. *p < 0.05, **p < 0.01, ***p < 0.001, ****p < 0.0001 by one-way ANOVA with Dunnett’s multiple comparison test (b-j) or unpaired T test (a,k-m). Error bars indicate SEM.
Mitochondrial dysfunction and low oxygen tension can promote ROS through several mechanisms, including reverse electron transport producing superoxide at mitochondrial complex I30. Examination of endogenous B16 TIL showed terminally exhausted T cells harbor significantly higher amounts of mtROS (Fig. 5b), in line with previous findings31–33. Continuous activation under hypoxia in vitro also produced high levels of mtROS (Fig. 5c), suggesting ROS may be a driver of T cell exhaustion. In order to interrogate effects of ROS in isolation, we peptide activated OT-I Tg CD8+ T cells for 24 h, then expanded cells in low concentrations of antimycin A (0.04 μM), a mitochondrial complex III inhibitor established to induce mtROS34. Antimycin A induced mtROS production (as well as consequent increase in cellular ROS) in a manner dependent on mitochondrial complex I activity (inhibited by the complex I inhibitor rotenone) (Fig. 5d,e). Notably, rotenone alone at higher doses can transiently induce mitochondrial ROS35 (Extended Data Fig. 6d). Here, low, non-toxic doses of the drugs were used to culture T cells for several days. Indeed, activating T cells (24 h) and then expansion in the presence of antimycin A resulted in an exhausted-like dysfunction: high co-inhibitory molecule expression and decreased polyfunctionality (interferon-g (IFN-γ) and TNF production)(Fig. 5f,g). We observed small but significant increases in TNF single producers under antimycin A treatment insensitive to rotenone treatment. Antimycin A treatment had similar proliferative consequences as continuous stimulation under hypoxia: proliferative capacity of T cells was modestly affected but accumulation as measured by overall fold expansion was decreased (Extended Data Fig. 6e, f). Remarkably, addition of rotenone, which when added to antimycin A treatment collapses the entire electron transport chain, rescued the dysfunction, suggesting the exhaustion observed was not caused by loss of mitochondrial function but rather due to mitochondrial stress and subsequent ROS (Fig 5d–g, Extended Data Fig. 6f).
To further address the role of ROS driving dysfunction, we employed N-acetyl-cysteine (NAC), a cell permeable antioxidant which neutralizes ROS (Fig. 5h). NAC was able to prevent dysfunction induced by either antimycin A or continuous stimulation under hypoxia (Fig. 5i–m). NAC treatment only modestly improved accumulation effects observed from antimycin A or continuous stimulation under hypoxia (Extended Data Fig. 6g, h), suggesting NAC’s effects were not due to alterations in survival but rather altering differentiation.
To further delineate how progressive loss of functional mitochondria might induce a dysfunctional state, we used a parallel approach in which mitochondrial activity could be progressively repressed during T cell expansion. We generated Rho0 (lacking detectable mtDNA) primary T cells through culture of OT-I T cells in the presence of low dose (50 ng/mL) ethidium bromide (supplemented with pyruvate and uridine; Extended Data Fig. 7a). This well-established experimental technique selectively depletes mtDNA (encoding a subset of mitochondrial genes, including subunits of the electron transport chain), producing cells lacking mtDNA but retaining mitochondrial mass36. Rho0 OT-I T cells harbor high levels of ROS (Extended Data Fig. 7b), despite having no detectable mitochondrial OXPHOS activity, mtDNA, or various respiratory components (Extended Data Fig. 7c–e). Notably, T cells withstand EtBr treatment, having no expansion defect after 10–12 days of culture (Extended Data Fig. 7f), consistent with Tfam-deficient T cells37. Rho0 T cells expressed elevated levels of PD-1, Tim-3, and TIGIT, failing to kill target cells when assayed in vivo (Extended Data Fig. 7g,h). Importantly, generation of Rho0 T cells in the presence of NAC rescued cytokine polyfunctionality and lowered expression of Tox (Extended Data Fig. 7i–k) Taken together, our data suggest heightened ROS production induced by mitochondrial dysfunction drives a phenotype consistent with T cell exhaustion.
Next, we explored how ROS drives dysfunction. ROS are crucial components of cellular biology, and active participants in critical chemical reactions38. In T cells, ablation of mtROS via genetic deletion of RISP results in failed NFAT signaling, so we reasoned, conversely, persistently elevated ROS might drive continuous NFAT signaling39, a transcriptional circuit known to drive exhaustion. Notably, ROS and their cellular byproducts are potent inhibitors of tyrosine phosphatases38, and indeed culture of T cells with antimycin A resulted in persistent and elevated tyrosine phosphorylation (Fig. 6a), which was blocked with rotenone or NAC (Fig. 6a,b). Immunoblot analysis revealed absolute amounts of tyrosine phosphorylation increased, but also several different proteins were differentially phosphorylated under AA-induced ROS, in a manner alleviated by NAC treatment (Fig. 6b). Phosphotyrosine signaling is a major player in T cell biology downstream of many cell surface interactions, including TCR signaling. Use of TCR-reporter Nur77-GFP mice showed antimycin A treatment during expansion induced GFP expression in the absence of any TCR signals; while lower than signal induced by continuous stimulation conditions, GFP from antimycin A treatment matched the phenotype of T cells cultured with the tyrosine phosphatase inhibitor orthovandate (50 μm) (Fig. 6c, Extended Data Fig. 8a). Phosphotyrosine cascades promote nuclear accumulation of NFAT1, and ROS induction alone (via antimycin A) drove increased nuclear NFAT1 in a rotenone-inhibited manner (Fig. 6d), consistent with previous data suggesting exhausted T cells harbor persistent NFAT1 signalign3,7. Expanding CD8+ T cells in orthovanadate produced a similar dysfunctional state: heightened co-inhibitory molecule expression, decreased cell accumulation and cytokine production, and expression of Blimp-1 and Tox (Extended Data Fig. 8). Thus, heightened ROS produced under exposure to continuous stimulation under hypoxia promotes a phenotype of chronic signaling, which may reinforce transcriptional machinery driving exhaustion. This may underlie the inability to ‘rescue’ terminally exhausted T cells even after a persistent antigenic signal is removed.
Figure 6: Persistent mitochondrial ROS increases elevation of phosphotyrosine signaling and nuclear NFAT localization.
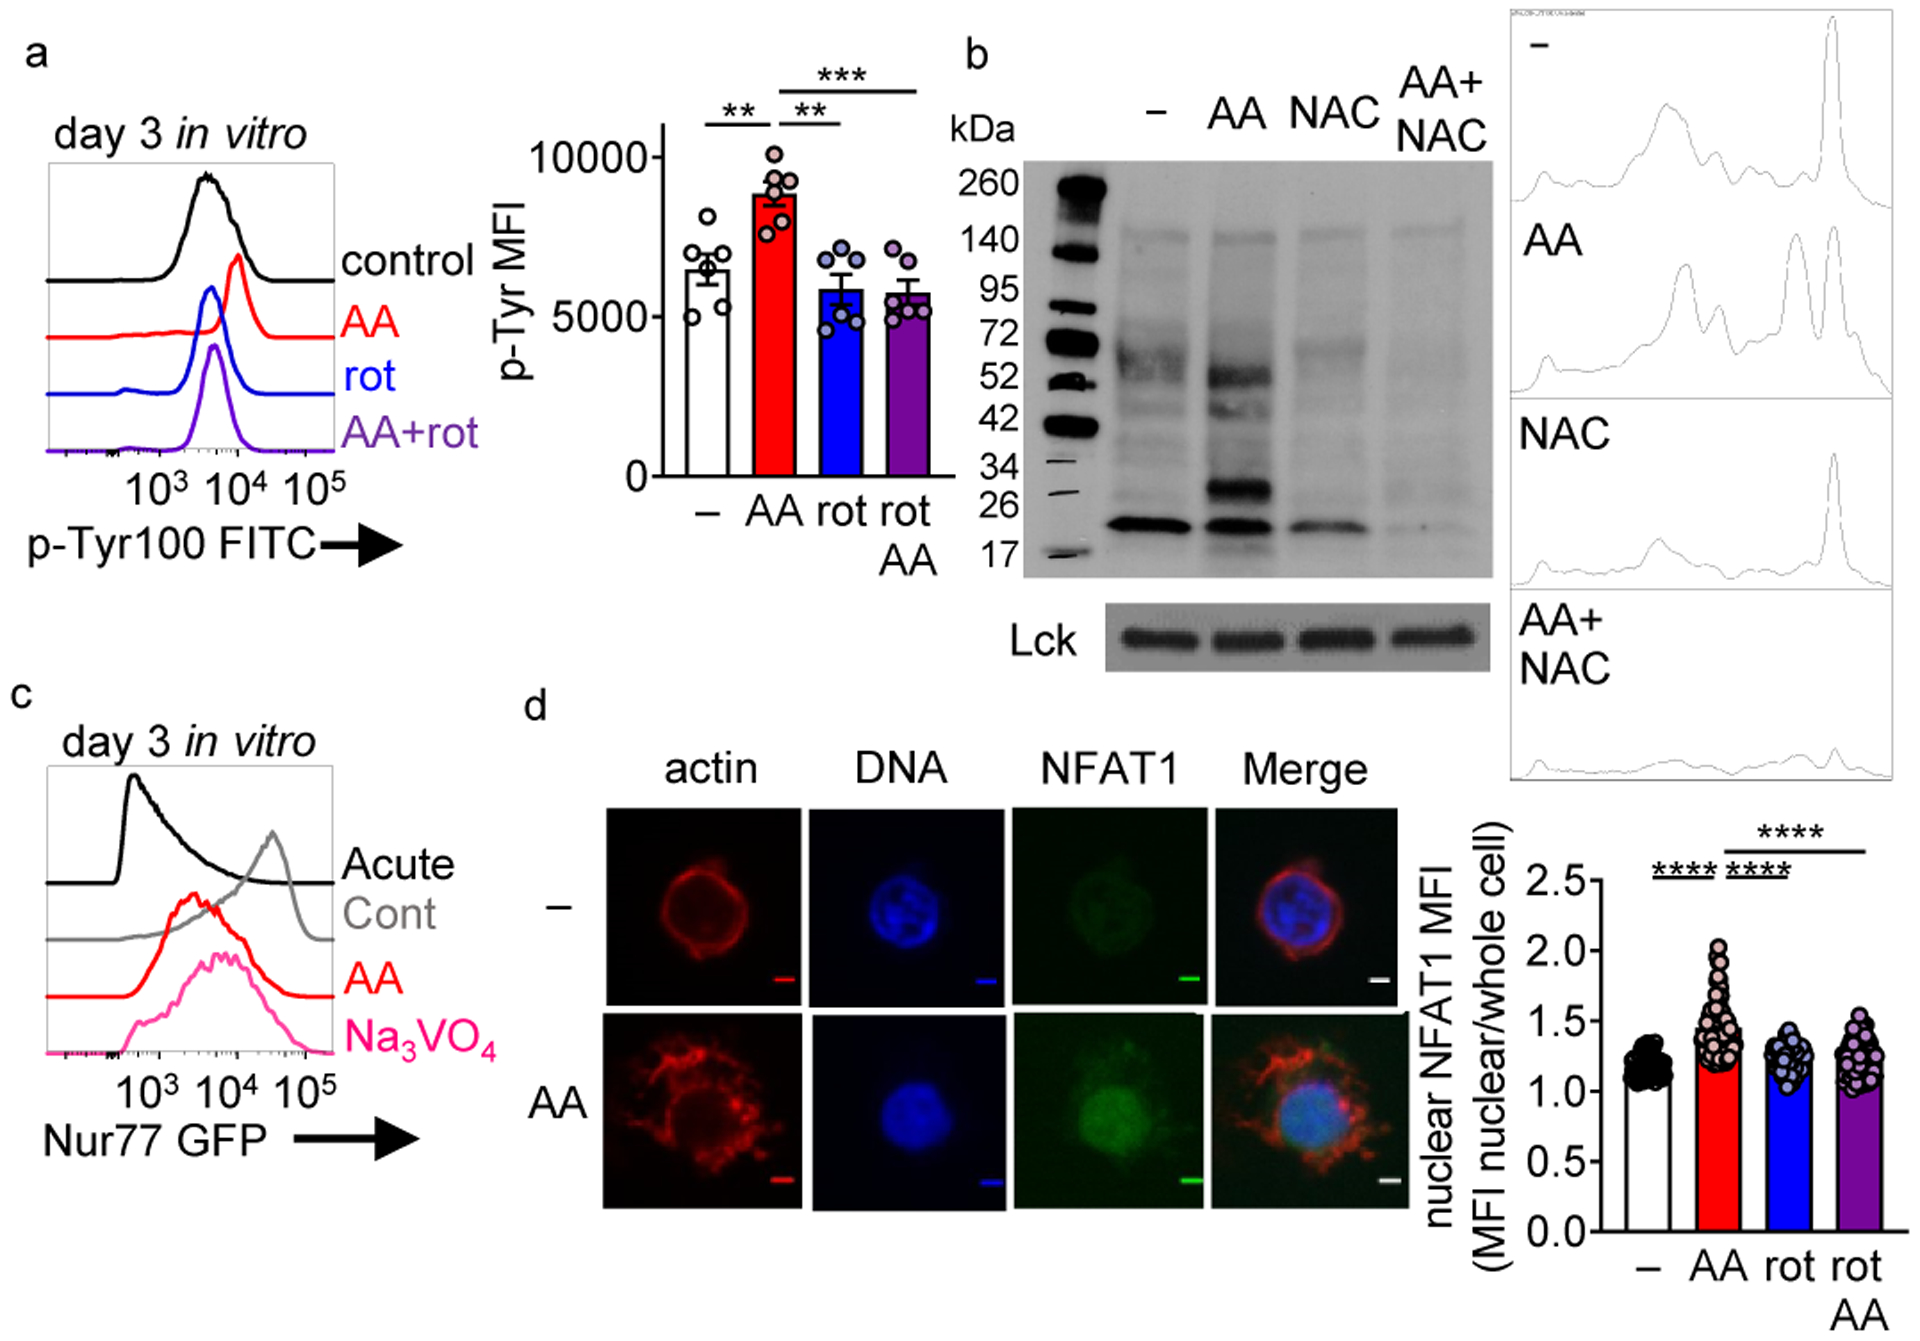
(a) Global phosphotyrosine staining in T cells activated overnight and then expanded in IL-2 and either 0.04mM mitochondrial complex III inhibitor antimycin A, 0.4mM complex I inhibitor rotenone, or a simultaneous combination of the two for 3 days. Each group n=5. (b) Phosphotyrosine staining of CD8+ T cell lysates from cells activated overnight and then expanded in IL-2 and either 0.04mM mitochondrial complex III inhibitor antimycin A, 10mM antioxidant n-acetyl-cysteine (NAC), or a simultaneous combination of the two for 3 days. (c) GFP expression of Nur77-GFP CD8+ T cells in either acutely activated, continuously activated, antimycin A, or 50mM sodium orthovanadate culture conditions. (d) Nuclear NFAT localization in representative control and AA-expanded T cells (day 6) as well as actin and DNA staining. Scale bars = 2 micrometers, accompanied with quantitation (each dot equals one cell). Control n=55, AA n=75, rot n=70, AA+rot n=67. All data are representative of 3–6 independent experiments. **p < 0.01, ***p < 0.001 by one-way ANOVA with Dunnett’s multiple comparison test (a,d). Error bars indicate SEM.
Mitigating ROS or hypoxia alleviates T cell exhaustion
Our data suggested elevated ROS could drive terminal exhaustion, and PGC1α overexpression in TCR-Tg T cell reduced ROS. As PGC1α promotes multiple downstream programs, we asked whether specifically mitigating ROS in a T cell-intrinsic manner could also protect against dysfunction. Pmel-1 T cells were transduced with Gpx1, a glutathionine peroxidase and known target of PGC1α capable of acting on many ROS species40, prior to transfer into B16-bearing animals. Like PGC1α-transduced cells, GPX1-overexpressing T cells were resistant to ROS accumulation in tumors (Fig. 7a). GPX1-overexpressing TIL T cells retained functionality, producing increased IFNγ (Fig 7b). Thus, reducing ROS in a cell-intrinsic manner protects T cells from tumor-induced exhaustion.
Figure 7: Reducing ROS or hypoxia exposure alters T cell differentiation to exhaustion and improves response to immunotherapy.
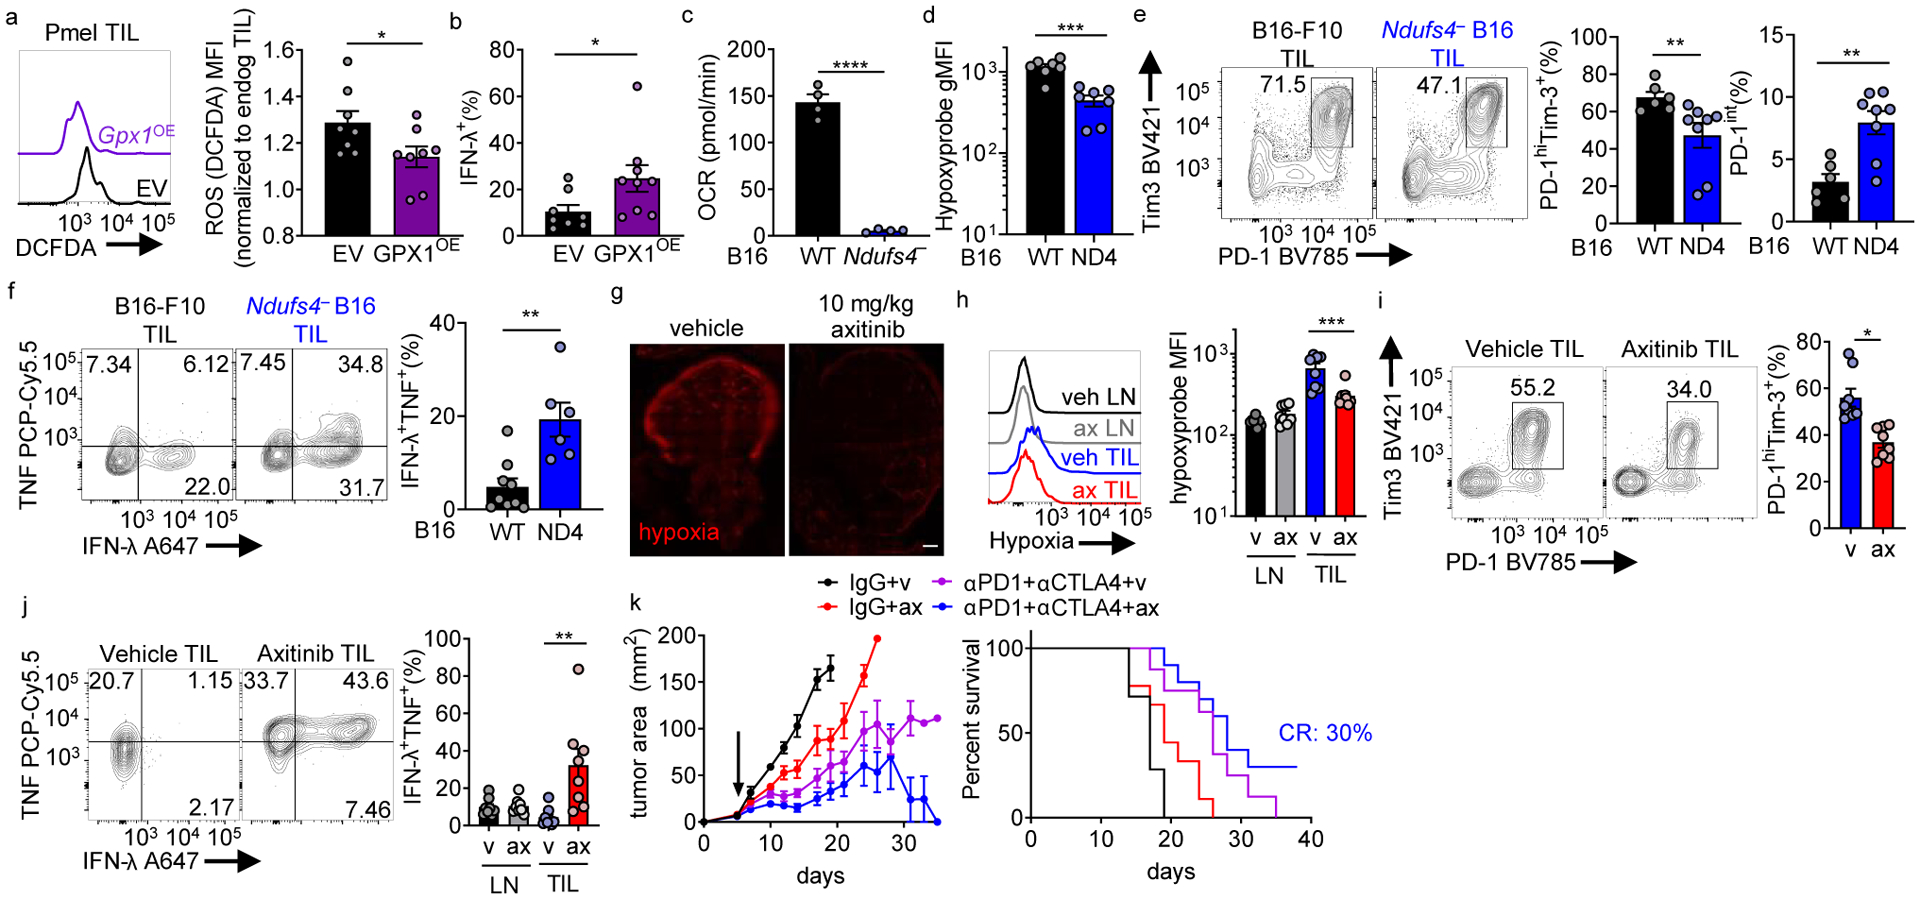
(a) DCFDA staining of adoptively transferred, B16-infiltrating Pmel Thy1.1+ T cells retrovirally transduced with GPX1 or vector control, EV n=8, GPX1OE n=8. (b) IFN-γ production from cells as in a after 16 h gp100 restimulation (last 5 h with protein transport inhibitor). EV n=8 mice, GPX1OE n=9 mice. (c) Oxygen consumption rate of B16-F10 or Ndufs4-deficient B16 (ND4). Each group n=4. (d) Hypoxyprobe staining in CD8+ T cells infiltrating WT or Ndufs4-deficient B16-F10, after intravenous pimonidazole injection 1.5hr before sacrifice. WT n=7 mice, Ndufs4-deficient n=7 mice. (e) PD-1 and Tim-3 staining in CD8+ TIL from WT or Ndufs4-deficient B16-F10, accompanied by quantitation of terminally exhausted or progenitor exhausted cells. WT n=6 mice, Ndufs4-deficient n=8 mice. (f) TNF and IFN-γ production in CD8+ TIL from WT or Ndufs4-deficient B16-F10 after 16 h PMA/ionomycin restimulation (last 5 h with protein transport inhibitor). WT n=9 mice, Ndufs4-deficient n=6 mice. (g) Hypoxia staining of B16 tumor sections of mice treated with vehicle or 10 mg/kg axitinib for 3 d. Scale bar 500mM (h), Hypoxia staining of T cells from LN and TIL of axitinib- or vehicle-treated B16-bearing mice. Vehicle n=8 mice, axitinib n=8 mice. (i), PD-1 and Tim-3 staining in CD8+ TIL from axitinib- or vehicle-treated B16-bearing mice. Vehicle n=8 mice, axitinib n=8 mice. (j), IFN-γ and TNF production in PMA/ionomycin restimulated CD8+ LN and TIL in B16-bearing mice treated with axitinib or vehicle control. Vehicle n=8 mice, axitinib n=8 mice. (k), Tumor growth (left) and survival (right) of B16-bearing mice treated thrice weekly with axitinib or vehicle alone or with combination anti-PD1+anti-CTLA4. Therapy began when mice had palpable tumor (d5, arrow). (Right) survival curve for mice. Control n=7, ax n=9, αPD1+αCTLA4 n=8, axi+αPD1+αCTLA4 n=10. Data are representative of 2–3 independent experiments. *p < 0.05, **p < 0.01, ***p < 0.001, ****p < 0.0001 by unpaired t test (a-f, i), one-way ANOVA (h, j), or log-rank test (k). Error bars indicate SEM.
We next determined if the trajectory of T cell differentiation toward exhaustion could be altered through changes in the tumor microenvironment. As hypoxia seemed to drive an altered differentiation state through generation of ROS, we sought to use tumor cells that would consume less oxygen and produce less hypoxia. Thus, we implanted mice with B16 melanoma engineered via CRISPR-Cas9 to lack a critical structural component of mitochondrial complex I (Ndufs4) or parental B16-F10 cells (Extended Data Fig. 9a). Consistent with our previous findings targeting Ndufs4 using RNAi18, Ndufs4-deficient tumors had no appreciable oxygen consumption in vitro and created less hypoxia in vivo (Fig. 7c,d). Also consistent with RNAi, Ndufs4-deficient cells grew comparably in vivo (Extended Data Fig. 9b).
We next assessed the phenotype of endogenous infiltrating CD8+ T cells of parental and Ndufs4-deficient (less hypoxic) tumors. Consistent with our previous findings, there was a modest but significant decrease in infiltrating CD8+ T cells in Ndufs4-deficient B16 (Extended Data Fig. 9c). Of these endogenous infiltrating CD8+ T cells, a smaller proportion of them progressed to terminal exhaustion (Fig. 7e). However, while these cells still expressed multiple co-inhibitory molecules, PD-1hiTim3+ T cells infiltrating Ndufs4-deficient tumors showed increased polyfunctionality (Fig. 7f).
We purified and sequenced RNA from endogenous terminally exhausted TIL from parental or Ndufs4-deficient B16 tumors. RNAseq of PD-1hiTim-3+ T cells from Ndufs4-deficient vs control tumors revealed a distinct transcriptional profile: decreased expression of genes involved in exhaustion and increased expression of effector or memory-like genes, including regulation of ROS and hypoxia (Extended Data Fig. 9d–f, Supplementary Table 9). Thus, in less hypoxic environments, T cells have an altered differentiation pattern reminiscent of effector/memory-like cells, even within compartments typically defining terminally exhausted T cells (PD-1hiTim-3+).
We next asked if hypoxia mitigating therapy could alter T cell differentiation to be beneficial for immunotherapy. Beyond genetic approaches, hypoxia is difficult to target in vivo. While tumor cell energetics certainly drive the altered metabolic landscape in cancer, VEGF-dependent angiogenesis and changes in tumor vasculature also contribute to generation of a hypoxic environment41. Axitinib is a tyrosine kinase inhibitor with nanomolar affinity for VEGFR1, 2 and 3. While anti-angiogenics were designed to ‘starve’ a tumor, inhibiting angiogenesis completely at high doses, low doses of anti-angiogenics can correct tortuous vasculature and lower tumor hypoxia, a strategy used in renal cancer in combination with immunotherapy42.
Consistent with previous studies, treating B16-bearing mice with low-dose (10 mg/kg) axitinib lowered total tumor and T cell hypoxia as measured by pimonidazole (Fig. 7g,h). Intratumoral T cells were phenotypically less exhausted (Fig. 7i) and more polyfunctional (Fig. 7j), suggesting by targeting VEGFR and lowering hypoxia, T cells might be more responsive to immunotherapy. Treatment of tumor-bearing mice with low-dose axitinib in vivo sensitized B16-bearing mice to CTLA-4 and PD-1 blockade, decreasing tumor burden and improving survival (Fig. 7k). By targeting the hypoxic nature of the tumor microenvironment, T cells do not differentiate to terminal exhaustion and retain responsiveness to checkpoint blockade.
DISCUSSION
The term ‘exhaustion’ has been used since initial reports in chronic infection, but drivers of the phenotype (save antigen persistence) have remained nebulous12. Inflammation, cytokines, Treg cells, and non-immune signals have been proposed3, but few approaches have been able to create exhausted-like T cells in isolation. We and others have found metabolic underpinnings to exhaustion: loss of mitochondrial capacity, glucose metabolism defects, and exposure to hypoxia15–18,32,43,44. Here we show metabolic insufficiency directly induces T cell exhaustion, rather than merely characterizing exhausted T cells. Our findings do not necessarily suggest metabolic insufficiency is the sole agent of T cell exhaustion but highlight the need to consider the metabolic status of a T cell and its environment as modifiers of immunologic signals. In both PGC1α-overexpressing T cells and in less hypoxic tumors, while T cells may appear exhausted ‘on the surface’ (increased co-inhibitory molecule expression), if metabolically sufficient, they may carry a dramatically superior phenotype.
Hypoxic exposure during continuous stimulation produced cells resembling exhausted T cells: high co-inhibitory molecule expression, low metabolic sufficiency and polyfunctionality, and a transcriptome with features of terminally exhausted TIL. Admittedly, our transcriptional profiling did not suggest we had generated bona fide exhausted TIL: comparison of the entire transcriptome (beyond differentially expressed genes) did not overlap with transcriptional profiles from tumor-infiltrating T cells. This finding is not surprising, given the relatively simple signals provided to T cells in vitro but serves as a platform for future work. Comparing transcriptional profiles of in vitro exhausted T cells to those found in tumors can identify immunologic or metabolic modulations to improve the assay.
Our study further implicates Blimp-1 in the process of exhaustion. Like many exhaustion-related transcription factors, Blimp-1 deletion does not ‘rescue’ T cells from exhaustion but prevents the phenotype or affects survival6. An inducible, CD8-specific deletion strategy in cells that had reached terminal exhaustion revealed Blimp-1 continually represses the plasticity (metabolic and otherwise) of exhausted cells. Identification of Blimp-1’s interactome and genomic binding will be key for ongoing studies.
Much of the prior work in T cell differentiation has been conducted by manipulating the PHD-VHL-HIF1α axis genetically rather than use of hypoxia directly. Regardless, it was surprising HIF1a deficiency had no effect on the dysfunctional phenotype induced through in vitro continuous activation under hypoxia, emphasizing that low oxygen tension elicits signals beyond the HIF1α machinery. Hypoxia can directly affect mitochondrial function, causing reverse electron transport and buildup of ROS30. However, it is unlikely HIF1α is completely uninvolved in T cell exhaustion. Loss of HIF1α’s negative regulator Vhl drives increased coinhibitory marker expression, but improved cytokine functionality in the setting of persistent viral infection23. As HIF1α is not only stabilized under low oxygen tension but activated through other inputs like T cell activation45, future studies will dissect HIF1α-dependent responses to hypoxia and continuous activation in vivo.
While it was surprising that it was not loss of mitochondrial activity but the presence of dysfunctional mitochondrial products that ultimately drove dysfunction, healthy mitochondria likely produce beneficial intermediates for long-lived T cell function. Mitochondria produce energetic currency (ATP) but also buffer calcium, produce biosynthetic intermediates, and generate reactants critical for epigenetic changes like histone acetylation and demethylation46. Further, ROS also serve as modulators of cellular signaling in T cells: as a phosphatase inhibitor, stress-induced ROS created a cellular environment mimicking constitutive signaling, which may serve to ‘feed forward’ and potentiate differentiation. While these mechanisms may have evolved to induce tolerance in hypoxic tissues, if ROS is the central driver, other metabolic and physiologic states may play a role. ROS can be generated in a variety of cellular conditions, including hyperoxia, inflammation, and nutrient stress47–49. Further, ROS can also inhibit dioxygenase reactions of demethylases, alter metabolic enzymes, and induce DNA damage, so while phosphatase inhibition is certainly ROS-mediated, ROS elevation in T cells likely contributes to exhaustion in multiple ways.
During the review of this study, a similar approach was reported (OT-I T cells cocultured with B16OVA cells) exploring metabolic consequences of persistent stimulation in vitro50, bearing remarkable parallels to our own: persistent antigen alters T cell mitochondrial sufficiency, mitochondrial dysfunction drives T cell exhaustion, and ROS neutralization can slow terminal differentiation. Our data place transcriptional repression via Blimp-1 as a major mechanistic determinant of metabolic reprogramming downstream of persistent stimulation and provide additional insight into the interplay between metabolic reprogramming and altered differentiation in vivo. Further, our study highlights the role of hypoxia as a critical ‘accelerator’ of this process, suggesting mitigation of hypoxia may be an actionable strategy to improve immunotherapy. We posit exposure to hypoxia, during initial activation or in response to immunotherapy, may exacerbate the development of exhaustion rather than a long-lived fate like memory. Our previous studies showing hypoxic tumors are less sensitive to immunotherapy in both mice and humans support this hypothesis18, and here we show mitigation of hypoxia with VEGFR inhibition also improves immunotherapeutic outcomes. Of course, axitinib, as a tyrosine kinase inhibitor, may act on other molecules present within tumor microenvironments51,52. VEGFRs can be expressed even by T cells regulate their function. Our data suggest a key mechanism of action of VEGF antagonism during immunotherapy (FDA-approved in RCC and under investigation in other histologies) may be limiting exposure of tumor-infiltrating T cells to metabolic stress. Finally, our study highlights the importance of accounting for metabolism in design of immunomodulatory therapies and supports a role for metabolic reprogramming and modulation to improve immunotherapy for cancer.
METHODS
Mice
Animal work was done in accordance with the Institutional Animal Care and Use Committee of the University of Pittsburgh. All mice were on C57BL/6 background, used at 6–8 weeks of age, were both male and female, and housed in specific pathogen free conditions prior to use. C57BL/6, SJ/L (Thy1.1), Cd4Cre, Tg(TcraTcrb)1100Mjb/J (OT-I), B6.Cg-Thy1a/Cy Tg(TcraTcrb)8Rest/J (Pmel), and HIF1af/f mice were obtained from The Jackson Laboratory. Prdm1f/f mice were a gift from A. Poholek (University of Pittsburgh). E8I-CreERT2 GFP x Rosa26-LSL-TdTomato mice and spleens from Tg(Nr4a1-EGFP/cre)820Khog/J (Nur77-GFP reporter) mice were a gift from D.A.A. Vignali (University of Pittsburgh).
Cell Lines, Antibodies, and Other Reagents
B16-F10 and 293T were obtained from ATCC. B16OVA (MO5) was obtained from P.Basse and L. Falo (University of Pittsburgh). Plat-E were obtained from L. Kane (University of Pittsburgh). Ndufs4-deficient B16-F10 was generated using transient transfection of Cas9-GFP and Ndufs4 targeted gRNA, single cell sorting of GFP+ cells, in vitro culture and screening using extracellular flux analysis, and selection of a clone that had lost GFP expression and lacked Ndufs4 protein. Vaccinia-OVA was generated by J.R. Bennink53 and provided by J. Powell (Johns Hopkins University). Zombie viability dye and anti-CD8 (53.6.7), anti-Tim3 (RMT3–23), anti-PD-1 (29F.1A12), anti-Lag3 (C9B7W), anti-TIGIT (1G9), anti-CD39 (Duha59), anti-IL-2 (JES6–5H4), anti-TCF1 (W16175A), anti-CD44 (IM7), anti-Thy1.1 (OX-7), anti-IFN-γ (XMG1.2) and anti-TNF (MP6-XT22) antibodies were obtained from BioLegend. Anti-Hif1α (241812) was obtained from R&D Systems. Anti-NFAT1 antibody (25A10.D6.D2) was obtained from Abcam. Cell Trace Violet, CFSE, MitoSOX Red Mitochondrial Superoxide Indicator, CellROX Deep Red Reagent, CM-H2DCFDA, MitoTracker Deep Red FM, Phalloidin, DAPI, Dynabeads Mouse T-Activator CD3/CD28 for T-Cell Expansion and Activation, ethidium bromide solution, anti-Tox (TXRX10) and anti-Blimp-1 (5E7) antibody was obtained from Fisher. Uridine, Tamoxifen, Oligomycin, FCCP, 2-deoxyglucose, Rotenone, Antimycin A, PMA, and ionomycin were obtained from Sigma. Golgiplug was obtained from BDbiosciences. NDUFS4 (E-4) and beta-actin (C4) was obtained from Santa Cruz Biotechnology. Phospho-Tyrosine antibody (P-Tyr-100) was obtained from Cell Signaling. SIINFEKL peptide was obtained from AnaSpec. IL-2 and IL-12 were obtained from PeproTech. In vivo hypoxia staining was detected with an antibody to pimonidazole, both obtained from Hypoxyprobe. Sodium orthovanadate was obtained from New England Biolabs. Axitinib was obtained from Cayman Chemical. In vivo antibodies anti-PD1 (clone J43), anti-CTLA4 (clone 9H10), and isotype controls were obtained from Bio X Cell.
Flow Cytometry
For live flow, metabolic dyes were loaded into cells by culturing T cells in serum-free media at 37 °C for 20 min, followed by antibody staining in FACS buffer (PBS+2%FBS) on ice. For intercellular transcription factor staining, surface staining was done with FACS buffer on ice, followed by 4% PFA fixation (to preserve Tim3 staining), then by Foxp3 fix/permeabilization (Fisher) and intercellular antibodies were stained overnight using perm wash. For cytokine staining after stimulation, surface staining was done with FACS buffer on ice, followed by 4% PFA fixation (to preserve Tim3 staining, if included), then Cytofix/Cytoperm (Fisher) and intercellular antibodies were stained overnight using perm wash.
Metabolism assay
Using a Seahorse XFe96 Bioanalyzer (Agilent), in vitro cultured CD8+ T cells (1.0 × 10⁵/well) were plated on Seahorse culture plates in media consisting of minimal, unbuffered DMEM supplemented with and 10 mmol/L glucose, 1 mmol/L pyruvate, and 2 mmol/L glutamine. Basal oxygen consumption rates (OCR) were taken for 30 min. Cells were stimulated with 2 μmol/L oligomycin, 0.5 μmol/L FCCP, 10 mmol/L 2-deoxyglucose, and 0.5 μmol/L rotenone/antimycin A to obtain maximal respiratory and control values.
Immunoblotting Analysis
Immunoblotting was performed as previously described54. Actin (C4) and PGC1α (H-300) antibodies for immunoblots were obtained from Santa Cruz Biotechnology, p-AKT (S473) (D9E), pS6 (S235/236) (D57.2.2E), BNIP3 #3769, LCK #2752, p-Tyr-100 #9411 from Cell Signaling, and CV- ATP5A, CIII- UQCRC2, CII- SDHB from Total Rodent OXPHOS Rodent WB antibody cocktail from Abcam. Immunoblots were detected via standard secondary detection and chemiluminescent exposure to film. Digitally captured films were analyzed densitometrically by ImageJ software.
T Cell Isolations from Lymph Node and Tumor
Lymph node T cells were isolated from 6- to 8-week-old B16-bearing mice and mechanically disrupted. To obtain single-cell suspensions of tumor-infiltrating lymphocytes, we injected whole tumors repeatedly using 20G needles with 2 mg/mL collagenase type IV, 2 U/mL hyluronidase (Dispase), and 10 U/mL DNase I (Sigma) in buffered RPMI with 10% FBS and incubated them for 25 min at 37°C. Tumors were mechanically disrupted between frosted glass slides and filtered to remove particulates, then vortexed for 30 seconds. In some experiments, mice were injected intravenously with pimonidazole (80 mg/kg, Hypoxyprobe) in PBS 1.5 h before sacrifice. Pimonidazole was visualized using anti-pimonidazole antibodies (Hypoxyprobe) after 10 min 4% PFA fixation, followed by Foxp3 Fix/perm (eBioscience) permeabilization.
T cell transduction and retroviral expression
PGC1α was originally generated by B. Spiegelman, obtained from Addgene (plasmid 1026)55, and cloned into an MSCV-driven retroviral expression vector which also encodes an IRES-GFP cassette, from D.A.A. Vignali. GPX1 was obtained from Origene (NM_008160) and cloned into an MSCV-driven retroviral expression vector which also encodes an IRES-amitrine cassette, from D.A.A. Vignali. The vectors were transiently transfected into Platinum-E (Plat-E) Retroviral Packaging Cell Line. Freshly isolated CD8+ Pmel T cells were stimulated with 5 μg/ml anti-CD3 plus 2 μg/ml anti-CD28 in the presence of 50 U/mL IL-2 for 24 h. Retroviral supernatants were harvested, and filtered, and supplemented with 6 μg/mL polybrene. Pmel T cells were spinduced with the retroviral supernatant for 120 min at 2,000 rpm. Cells were expanded and sorted by fluorescent marker prior to adoptive transfer.
Real-time PCR
RNA was isolated via RNeasy Plus Mini Kit (Qiagen). cDNA was reverse transcribed using the High Capacity cDNA Reverse Transcription Kit (Applied Biosystems). Mitochondrial DNA was isolated via Trizol prep using the genomic fraction. Real-time PCR was performed with primers for Ndufs4 (F: 5′-AACGGATCCACAGCCGTA-3′, R: 5′-AGTCCTCGGGCCATGATT-3′), mt-dloop1 (F: 5′-AATCTACCATCCTCCGTGAAACC-3′, R: 5′-TCAGTTTAGCTACCCCCAAGTTTAA-3′), mt-rnr2 (F: 5′-CACTGCCTGCCCAGTGA-3′, R: 5′-ATACCGCGGCCGTTAAA-3′), PGC1α (F: 5′-TCAAGCCAAACCAACAACTTTATCT-3′, R: 5′-GGTTCGCTCAATAGTCTTGTTCTCA-3′), and normalized to 18S Ribosomal 5 (F: 5′-GTAACCCGTTGAACCCCATT-3′, R: 5′-CCATCCAATCGGTAGTAGCG-3′) and quantitation was performed using the ΔΔCt method.
In vitro T cell cultures
For the bead-based continuous stimulation under hypoxia assay, lymph node and spleen CD8+ T cells were isolated from 6- to 8-week-old mice, mechanically disrupted, and sorted on CD8+ CD44hi via Beckman Coulter MoFlo Astrios. Cells were then activated at 2 × 10⁴ T cells per 96-well plate round-bottom wells with an equivalent number of CD3/CD28 washed dynabeads, 25 U/ml IL-2, and 10 ng/ml IL-12 in 200 μL complete RPMI + 10% serum (starting point = day 0). Cells were activated for 24 h, then beads were magnetically removed and cells were divided into 4 conditions: no dynabeads in regular incubator (acute activation in normoxia), no dynabeads in 1.5% oxygen hypoxia chamber (acute activation in hypoxia; BioSpherix, ProOx Model C21), with 200,000 dynabeads in the regular incubator (continuous activation in normoxia), and with 200,000 dynabeads in 1.5% oxygen hypoxia chamber (continuous activation in hypoxia). Cells were cultured in 25 U/ml IL-2 in 300 μL complete RPMI + 10% serum in 96-well round-bottom plates (starting culture conditions = day 1). After 48 h (d3), cells were split in half (e.g. 10 wells per group are now 20 wells per group), with fresh media + IL-2 used to replace old media. Bead numbers were kept consistent per well. After 48 h (d5), cells were split in half again, with fresh media + IL-2 used to replace old media. Bead numbers were kept consistent per well. After 24 h (d6), cells were assayed after beads were removed.
For the antimycin A-based assay, spleen and lymph node preparations from OT-I mice were stimulated with 250 ng/mL SIINFEKL peptide and 50 U/ml IL-2 for 24 h. Cells were washed, expanded 10-fold into fresh media with IL-2 and were cultured in either media + 25 U/ml IL-2 alone, or with 0.04 μM Antimycin A, 0.4 μM Rotenone, 0.4 μM Rotenone + 0.04mM Antimycin A, or 0.04 μM Antimycin A + 10 mM N-acetyl cysteine. Cells were cultured for 7 days in conditions, then assayed.
For the in vitro T cell + tumor cell-based assay, spleen and lymph node preparations from OT-I mice were stimulated with 250 ng/mL SIINFEKL peptide and 50 U/ml IL-2 for 24 h. Cells were washed, then plated either alone, 1:1 with 1 × 10⁶ B16, or 1:1 with 1 × 10⁶ B16OVA (in 10-cm plate, with 20 mL media), and placed in normoxia (atmospheric O2) or hypoxia (1.5% O2; BioSpherix, ProOx Model C21), all with 25 U/ml IL-2. After 48 h, T cells were counted and replated at 1:1 with fresh tumor cells: 1 × 10⁶ B16, or 1 × 10⁶ B16OVA (in 10-cm plate, with 20 mL media), and were continued in normoxia or hypoxia with 25 U/ml IL-2. After another 48 h, cells were assayed.
For sodium orthovanadate (phosphatase inhibitor)-based assay, spleen and lymph node preparations from OT-I mice were stimulated with 250 ng/mL SIINFEKL peptide and 50 U/ml IL-2 for 24 h. Cells were washed, expanded 10-fold into fresh media with IL-2 and were cultured in either media + 25 U/ml IL-2 alone, or in the presence of 50 μM sodium orthovanadate for 5 days, then assayed.
For ethidium bromide-based assay, spleen and lymph node preparations from OT-I mice were stimulated with 250 ng/mL SIINFEKL peptide and 50 U/ml IL-2 for 24 h. Cells were washed, expanded 10-fold into fresh media with IL-2 and were cultured in either media, 25 U/ml IL-2, 50 mg/ml uridine, plus or minus 50 ng/mL EtBr for 12 days, then assayed.
Luminescence assay
The PGC1α plasmid was originally generated by B. Spiegelman, obtained from Addgene (plasmid 8887). The Prdm1 (Blimp-1) plasmid was a gift from A. Poholek (University of Pittsburgh)56. 293T cells were co-transfected with the plasmids, then next day, the Luciferase Assay System (E1500, Fisher) was used to assay luminescence, according to manufacturer’s instructions.
Gene Expression Profiling by RNAseq
In vitro cultured CD8+ T cells or TIL was dissociated from tissue as described above, then sorted based on CD8, PD-1, and Tim-3 expression. cDNA was prepared from ~1000 cells using the SMARTer Ultra Low Input RNA Kit for Sequencing - v3 user manual (Clontech Laboratories). Sequencing libraries were prepared using Nextera XT DNA Library Preparation kit (Illumina), normalized at 2 nM using Tris-HCl (10 mM, pH 8.5) with 0.1% Tween20, diluted and denatured to a final concentration of 1.8 nM using the Illumina Denaturing and Diluting libraries for the NextSeq 500 protocol Revision D (Illumina). Cluster generation and 75bp paired-end dual-indexed sequencing was performed on Illumina NextSeq 500 system. RNA-seq was analyzed using standard methods including alignment to the genome using HISAT2, gene expression values (TPM) calculated using Subread and identification of differentially expressed genes (DEG) using DEseq2 with a cutoff of 2 fold and p value < 0.05.
Microscopy
Nuclear NFAT1 localization was analyzed via confocal microscopy. Exhausted T cells were generated in vitro according to above protocol, then T cells were adhered to glass slides via poly-L-lysine coating. Cells were then fixed with 4% PFA for 30 min, followed by Foxp3 fix/permeabilization (Fisher) for 30min. Cells were then stained overnight with anti-NFAT1, followed by phalloidin and DAPI next day before mounted with ProLong Diamond Antifade Mountant (Fisher). Cells were imaged with Olympus IX81 spinning disc confocal and analyzed using Image J software. Analysis was performed by determining NFAT1 mean fluorescent intensity in the nuclear mask vs whole cell mask on a per cell basis.
In vivo tamoxifen administration
Prdm1f/f × E8ICre-ERT2 GFP × Rosa26-LSL-TdTomato mice (and Cre-negative littermate controls) received 2.5 × 10⁵ B16 cells intradermally on day 0. After 9 days (when tumors were around 5 mm in size), mice received 1 mg tamoxifen suspended in corn oil IP for 5 consecutive days. On day 6, mice were sacrificed, tissue was processed as described above, and TILs were assayed.
In vivo TIL analysis and survival with axitinib, anti-PD-1, anti-CTLA-4
Mice were injected intradermally with 2.5 × 10⁵ B16 melanoma cells. When tumors were palpable (typically day 5), mice began axitinib and/or anti-PD-1 plus anti-CTLA-4. Mice were treated with 10 mg/kg axitinib (Cayman Chemical) or vehicle control (10% DMSO, 10% Tween-80, and 80% water containing 30% captisol), and/or 200 μg anti-PD-1 plus 200 μg anti-CTLA-4 intraperitoneally 3 times per week. In survival curves, mice were removed from study when tumor burden reached 15 mm in any direction. In some experiments, mice were injected intravenously with pimonidazole (80 mg/kg, Hypoxyprobe) in PBS 1.5 h before sacrifice. Pimonidazole was visualized using anti-pimonidazole antibodies (Hypoxyprobe) after 10 min 4% PFA fixation, followed by Foxp3 Fix/perm (eBioscience) permeabilization.
Statistics
The P values were calculated in GraphPad Prism using one-way ANOVA with Dunnett’s multiple comparison test, unpaired Student’s t test, or paired Student’s t test, as indicated in figure legends. Values of P < 0.05 were considered significant. Values of P < 0.05 were ranked as *P < 0.05, **P < 0.01, ***P < 0.001, and ****P < 0.0001.
Extended Data
Extended Data Figure 1. Antigen-specific tumor co-culture under hypoxia induces an exhausted-like dysfunctional state.
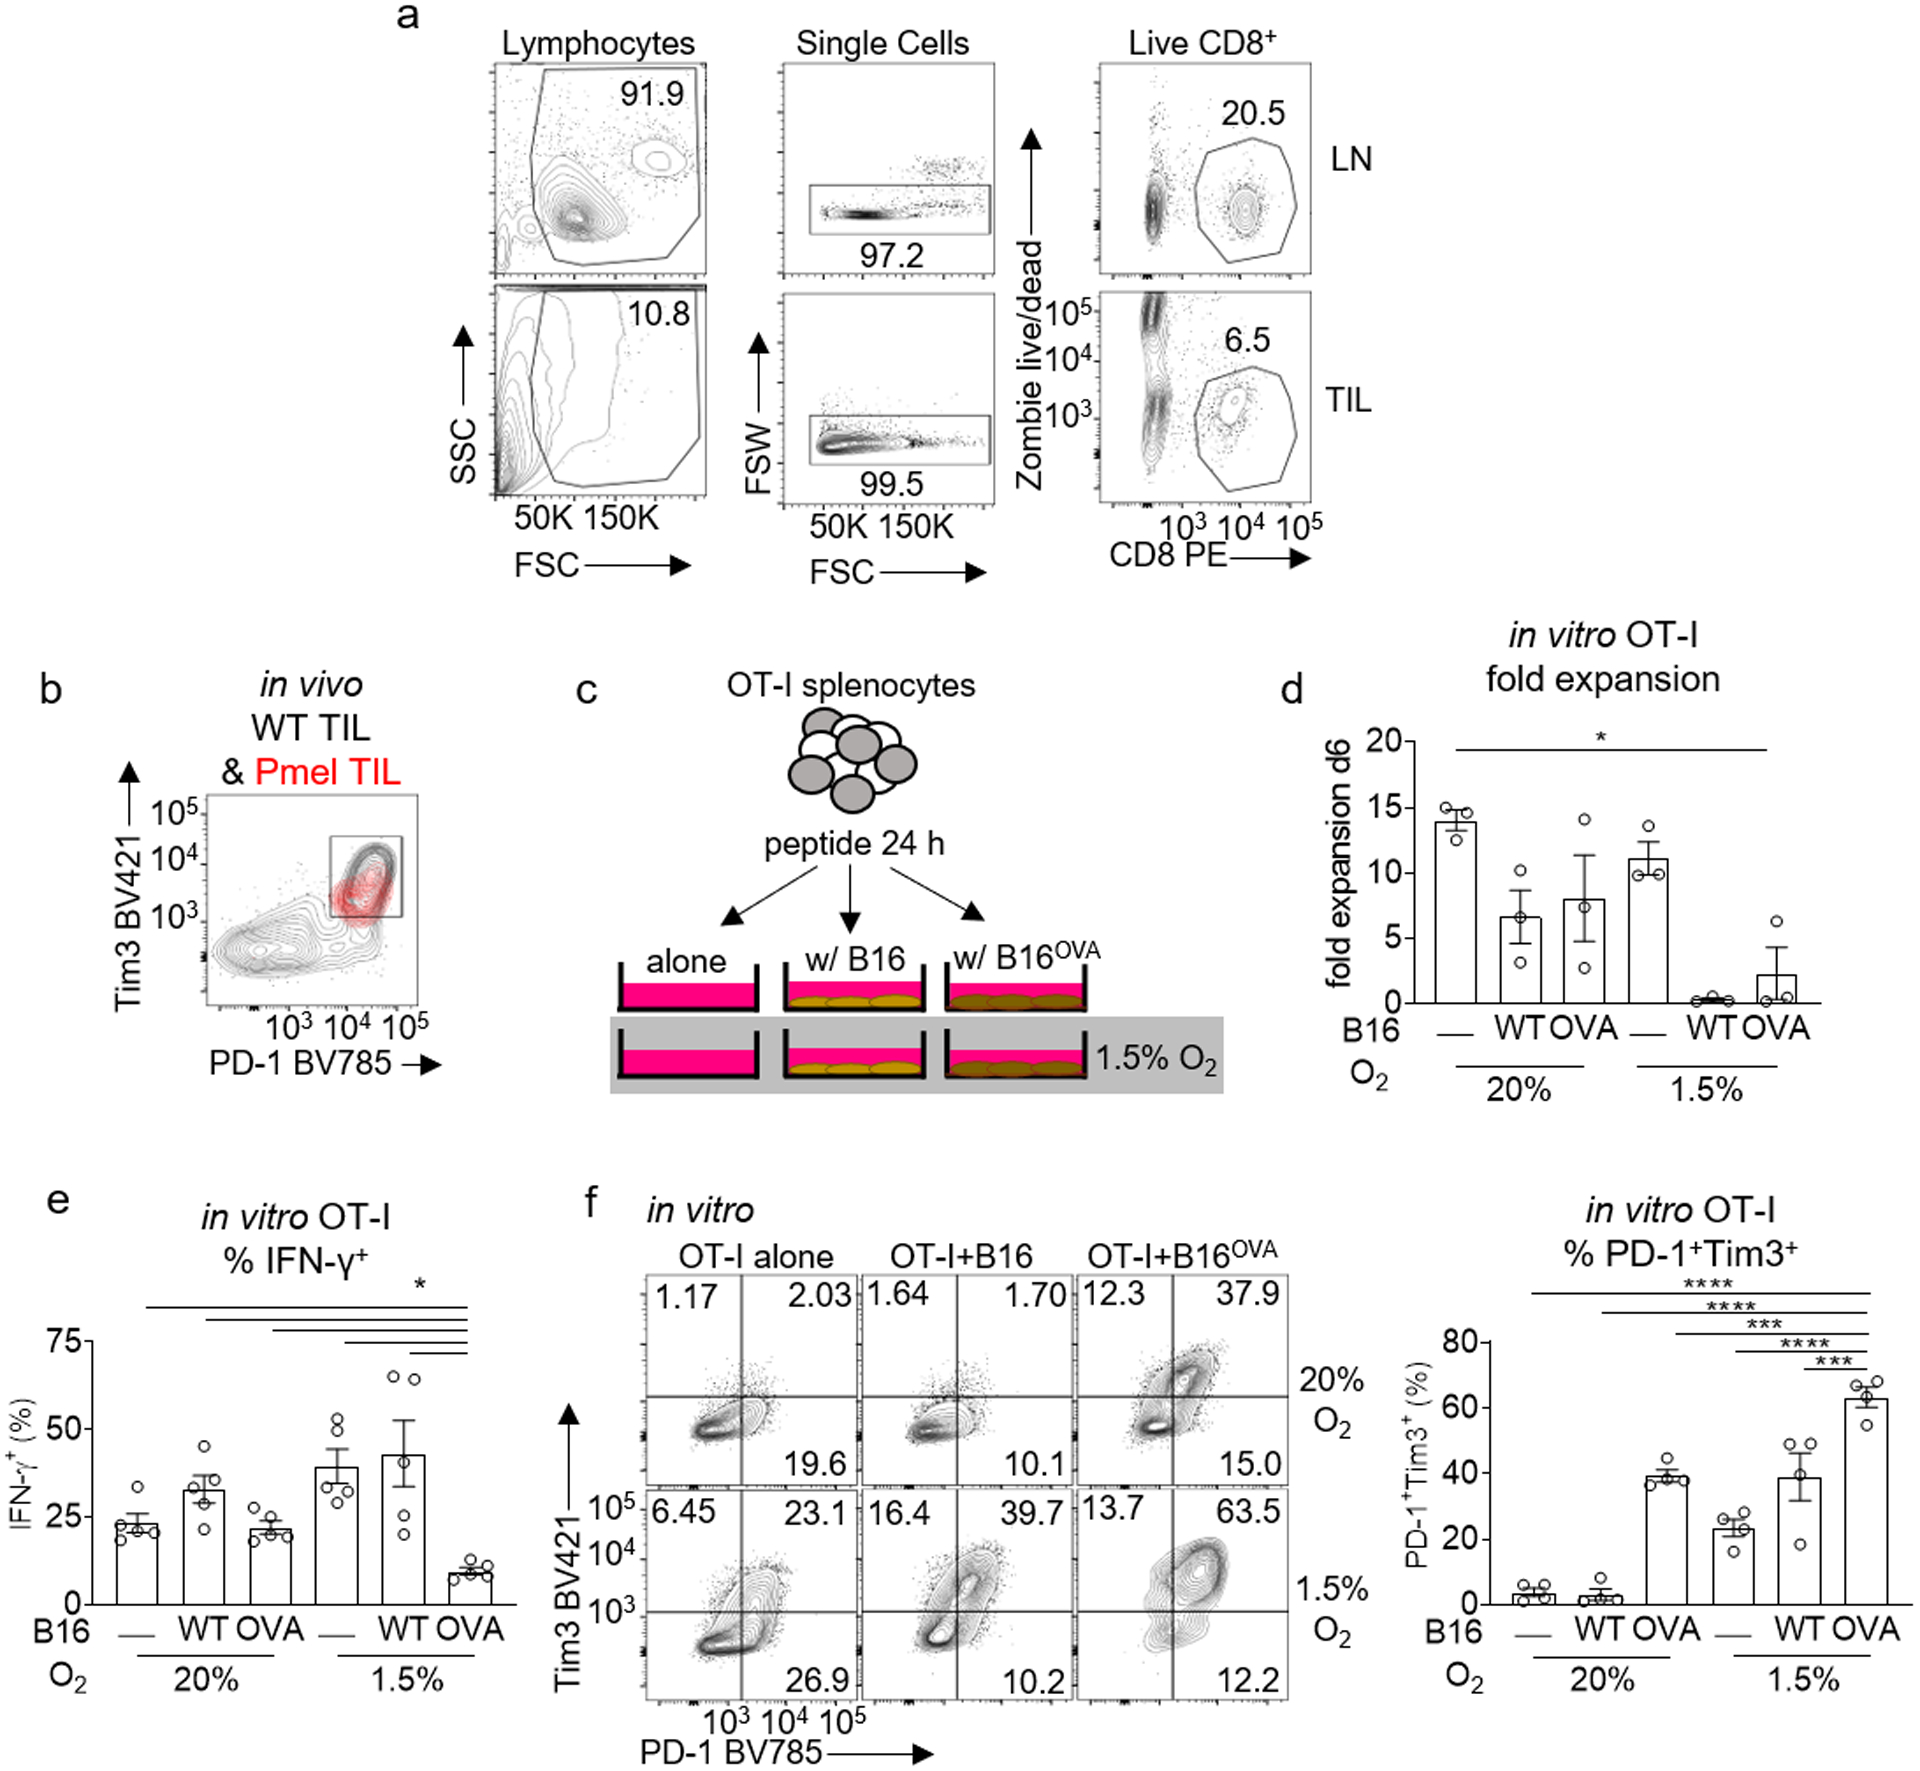
a, Lymph node (LN) and Tumor-infiltrating lymphocyte (TIL) gating strategy. b, PD1 vs Tim3 expression in gp100 specific Pmel TIL (red) overlaid on endogenous WT TIL (black) in in vivo B16 melanoma. c, Schematic of in vitro T cell+tumor cell exhaustion assay. Spleen and lymph node preparations from OT-I mice were stimulated with SIINFEKL peptide and IL-2 for 24 hours. T cells were then plated either alone, 1:1 with B16, or 1:1 with B16OVA, and placed in normoxia (atmospheric O2) or hypoxia (1.5% O2), all with IL-2 for 5–7 d. d, OT1 T cell fold expansion generated using the schematic in c, each group n=3. e, Cytokine production after CD3/CD28 restimulation in CD8+ T cells as a function of their coculture status. All restimulations were done in atmospheric oxygen. Each group n=5. f, Representative flow cytograms (left) and quantitated data (right) of CD8+ T cells PD-1 vs Tim3 expression generated using the schematic in c, each group n=4. All data are representative of 3–5 independent experiments. *p < 0.05, **p < 0.01, ***p < 0.001, ****p < 0.0001 by one-way ANOVA with Dunnett’s multiple comparison test. Error bars indicate SEM.
Extended Data Figure 2. In vitro continuous stimulation under hypoxia does not significantly affect proliferation but affects accumulation.
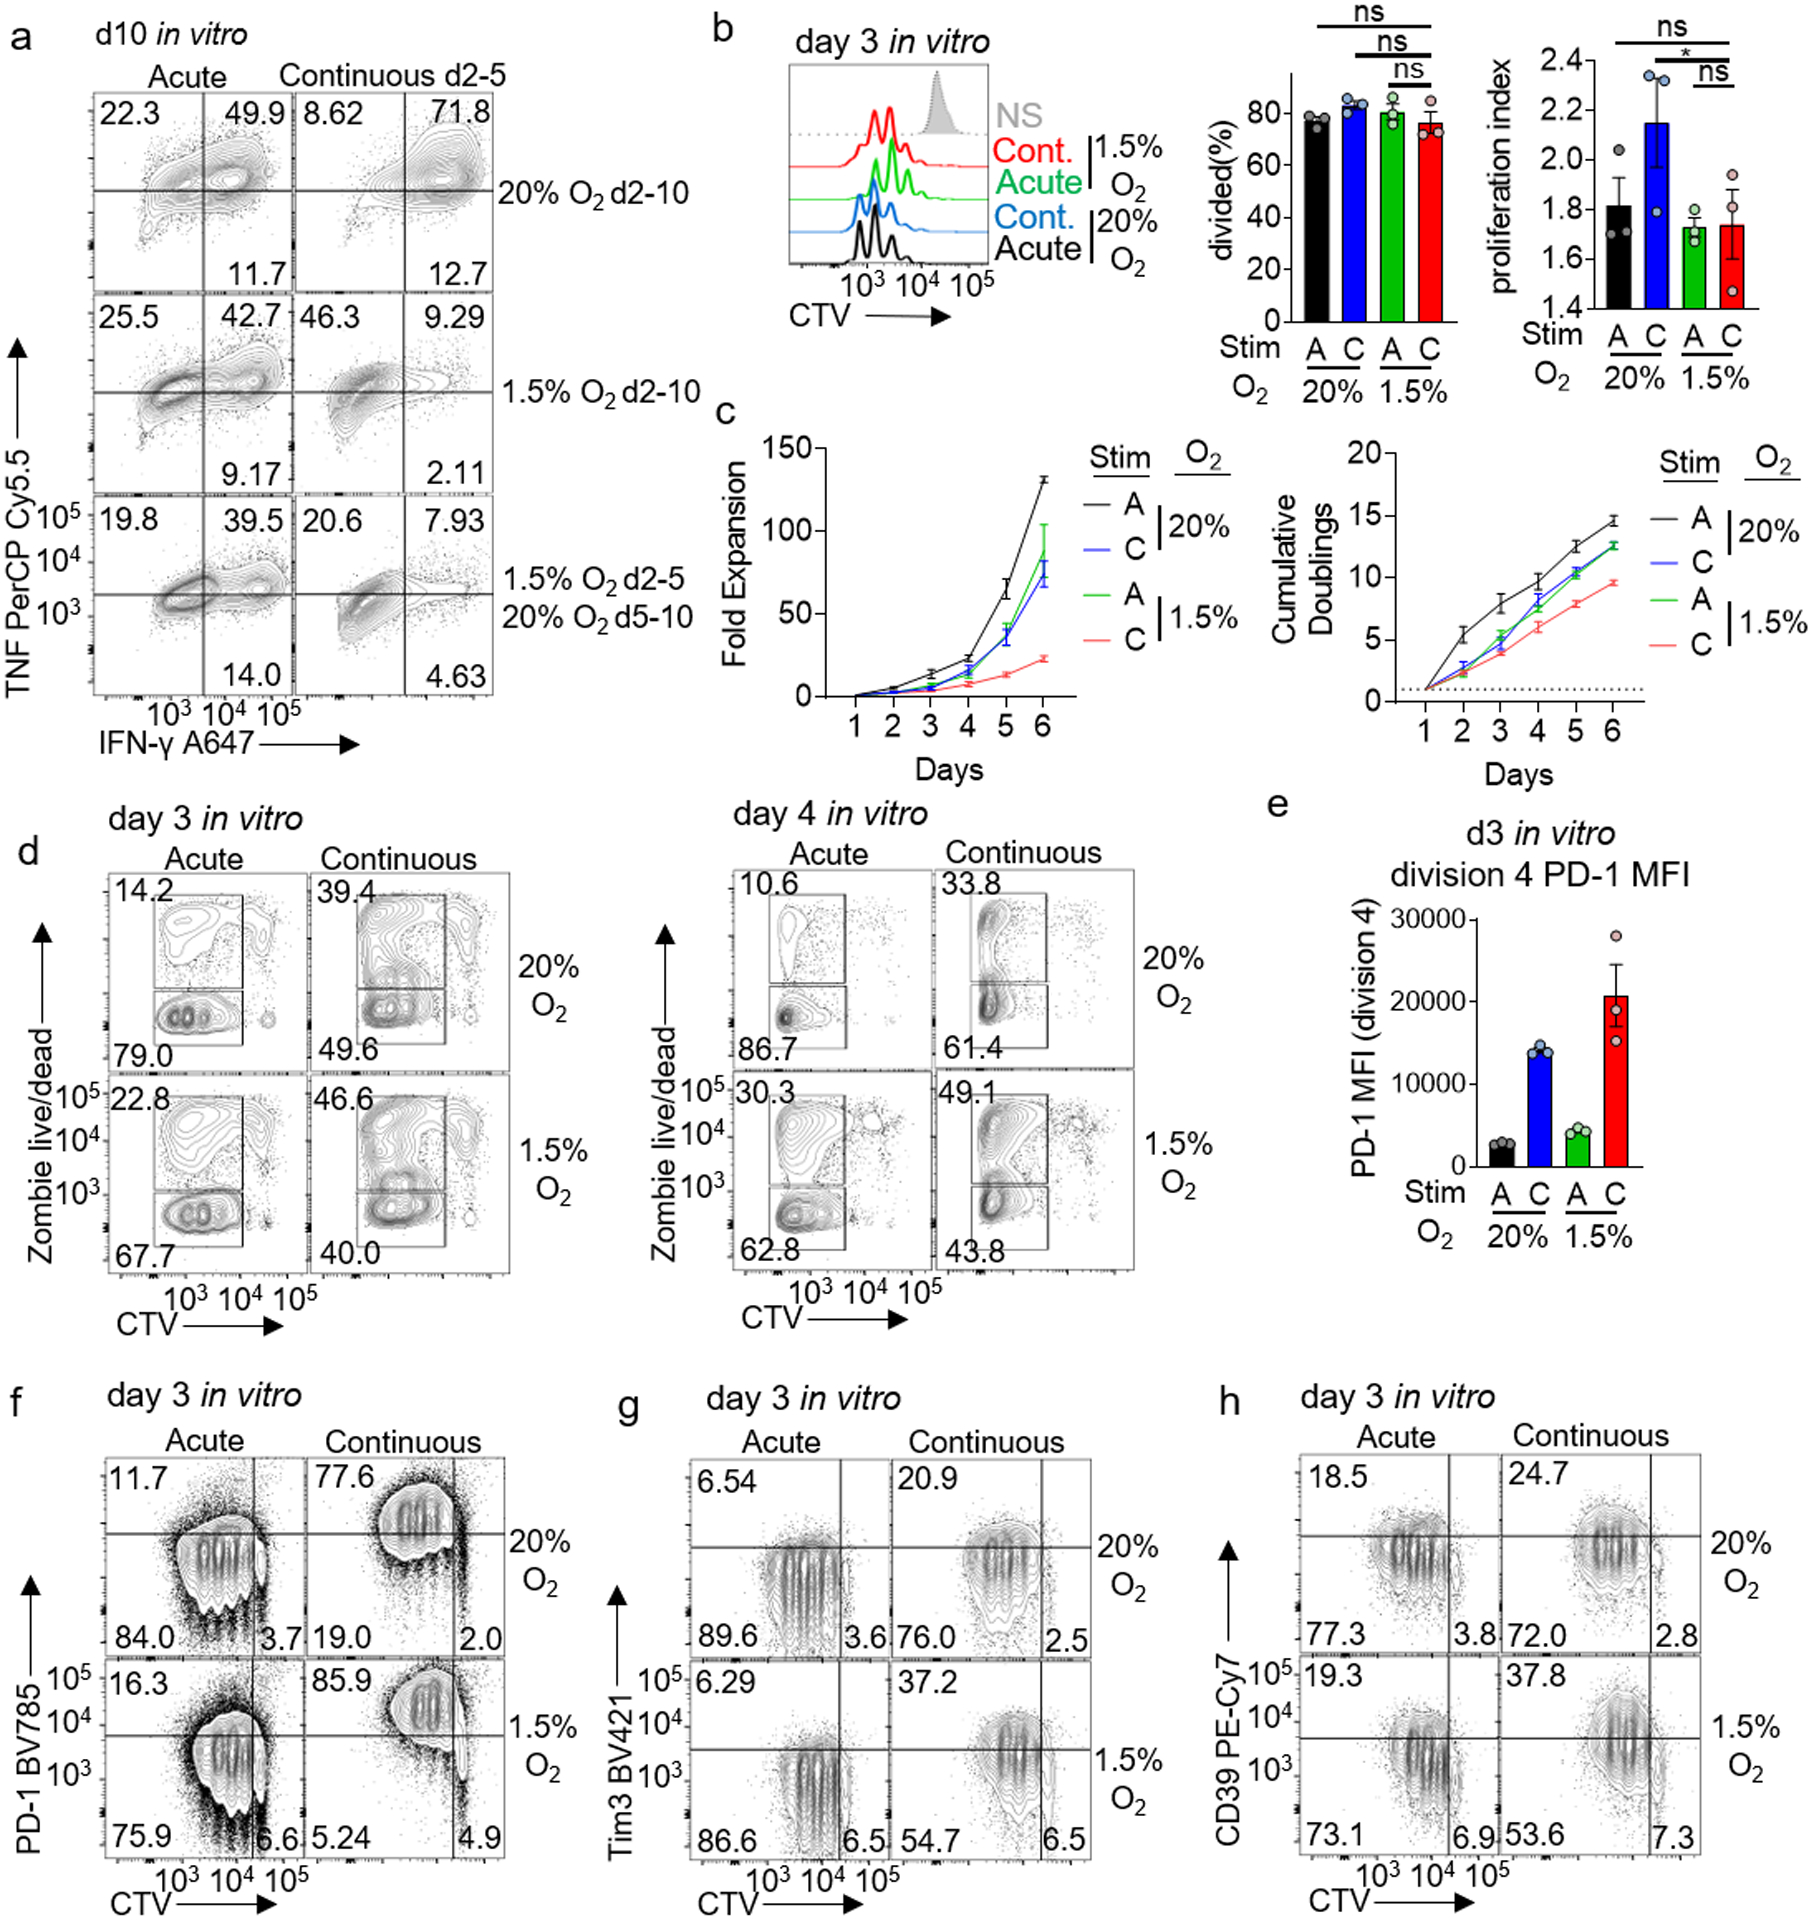
a, TNF and IFN-γ production of d10 in vitro CD8+ T cells, either acutely or continuously activated with anti-CD3/CD28 beads for d2–5 in hypoxia or normoxia, then cultured additionally for 5 d in the presence of normoxia or hypoxia. b, Representative flow histograms and division analyses (right) of day 3 CD8+ T cells CTV dilution generated using the stimulation protocol used in Figure 2. Both % divided and proliferation index are reported. Each group n=3. c, Expansion (left) and cumulative doublings right) of CD8+ T cells as in Figure 2. each group n=4. d, Dye dilution (proliferation) versus cell death (live/dead) staining of day 3 or day 4 CD8+ T cells generated as in Figure 2. e, Mean fluorescence intensity of PD-1 in division 4 CD8+ T cells. Each group n=3. f–h, Representative flow cytograms of day 3 CD8+ T cells generated as in Figure 2. each group n=4. All data are representative of 3–6 independent experiments. *p < 0.05 by one-way ANOVA with Dunnett’s multiple comparison test. Error bars indicate SEM.
Extended Figure 3: Continuous activation under hypoxia results in enrichment of genes related to terminal exhaustion and repression of genes from more progenitor-like exhausted cells.
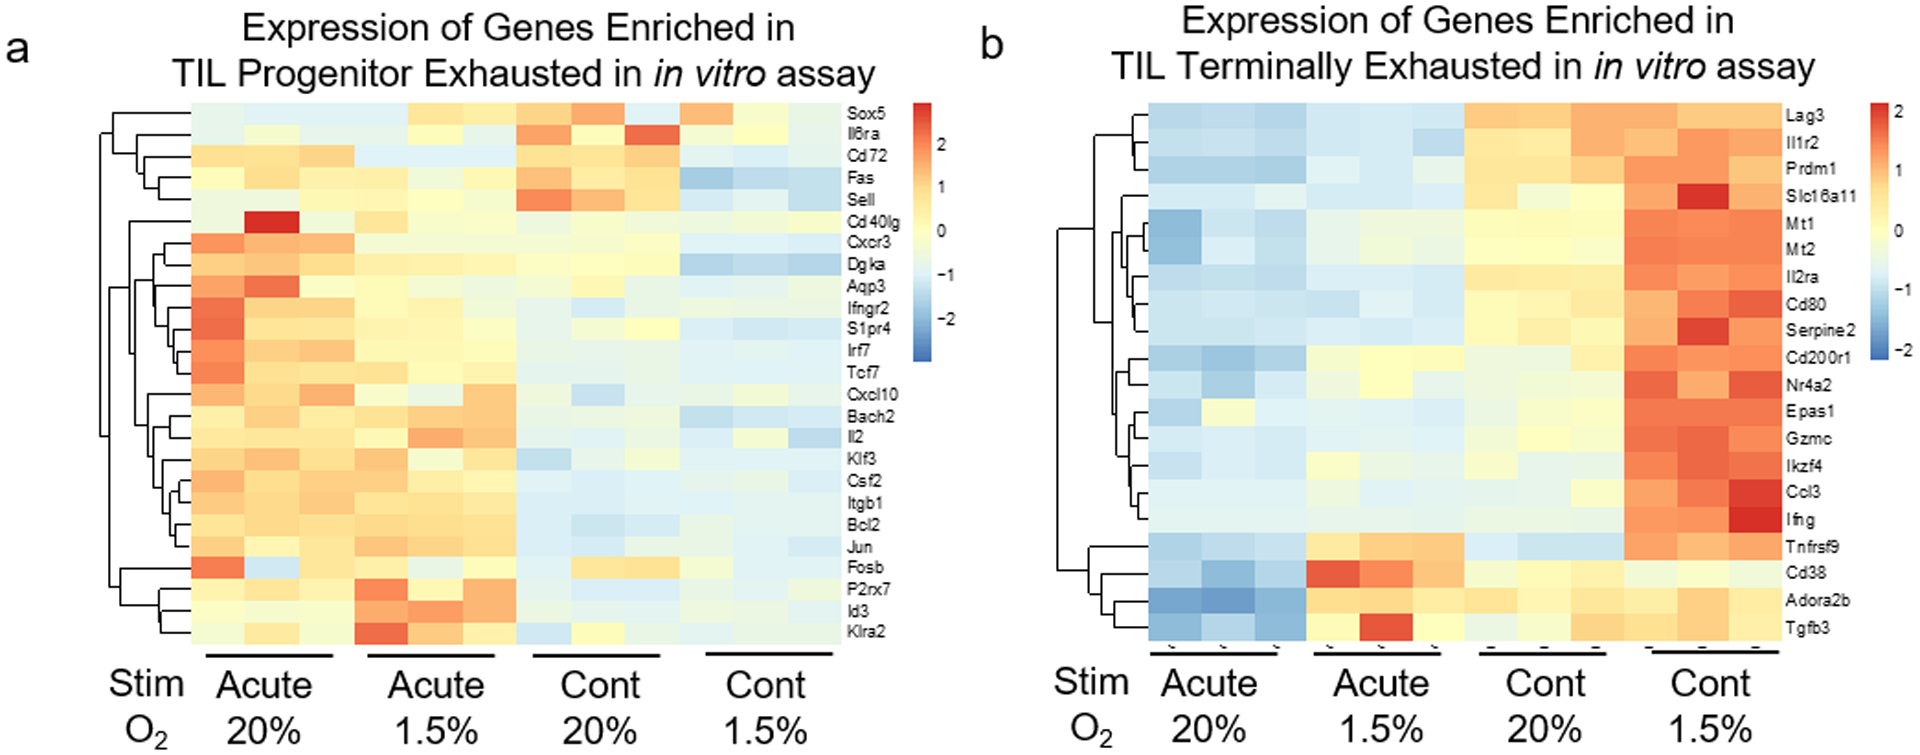
a, Heatmap of selected genes from Fig. 3d (genes specifically enriched in progenitor exhausted T cells) from all four in vitro conditions detailed in Fig. 2. Each group n=3 b, Heatmap of selected genes from Fig. 3e (genes specifically enriched in terminally exhausted T cells) from all four in vitro conditions detailed in Fig. 2. Each group n=3.
Extended Figure 4. HIF-1α is dispensable for continuous stimulation under hypoxia-induced dysfunction, although hypoxia signaling is active in response to hypoxia.
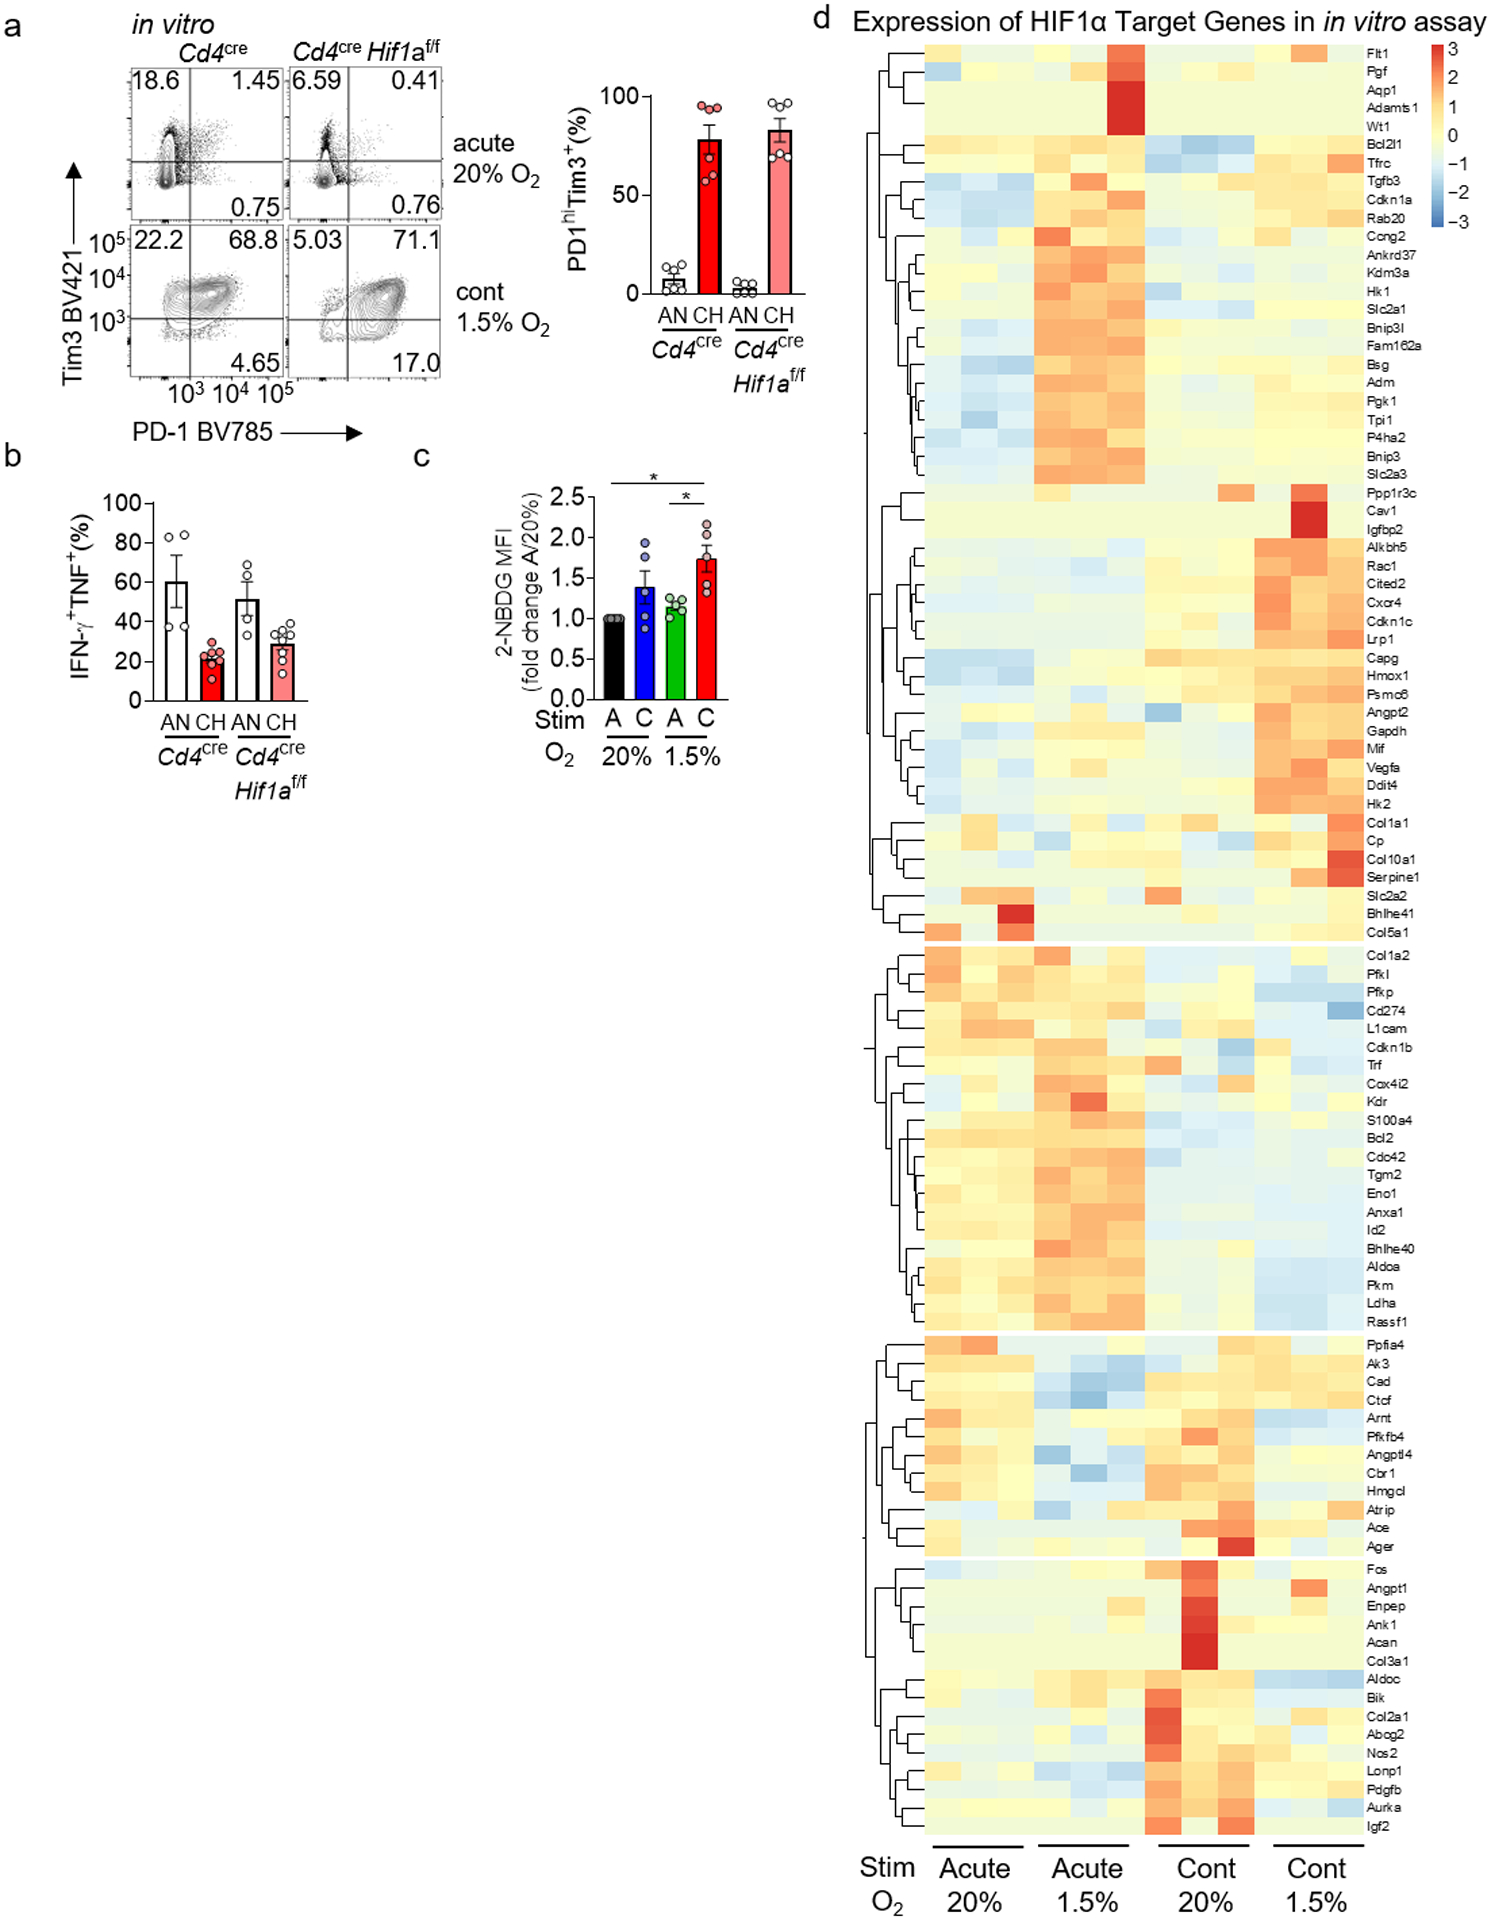
a, PD-1 and Tim-3 staining in WT or HIF-1α-deficient CD8+ T cells continuously stimulated under hypoxia as in Fig. 2. each group n=6. b, Cytokine production of restimulated WT and HIF-deficient T cells as in a. WT AN n=4, CH n=7; HIF-deficient AN n=4, CH n=8. c, Quantification of 2-NBDG staining as in Figure 2. each group n=5. d, Heatmap of known HIF-1α target genes from the transcriptional analyses in Fig. 3. Each group n=3. All data are representative of 3–6 independent experiments. *p < 0.05 by one-way ANOVA with Dunnett’s multiple comparison test (c). Error bars indicate SEM.
Extended Data Figure 5. Blimp-1 represses metabolic sufficiency in a HIF-1α-independent manner.
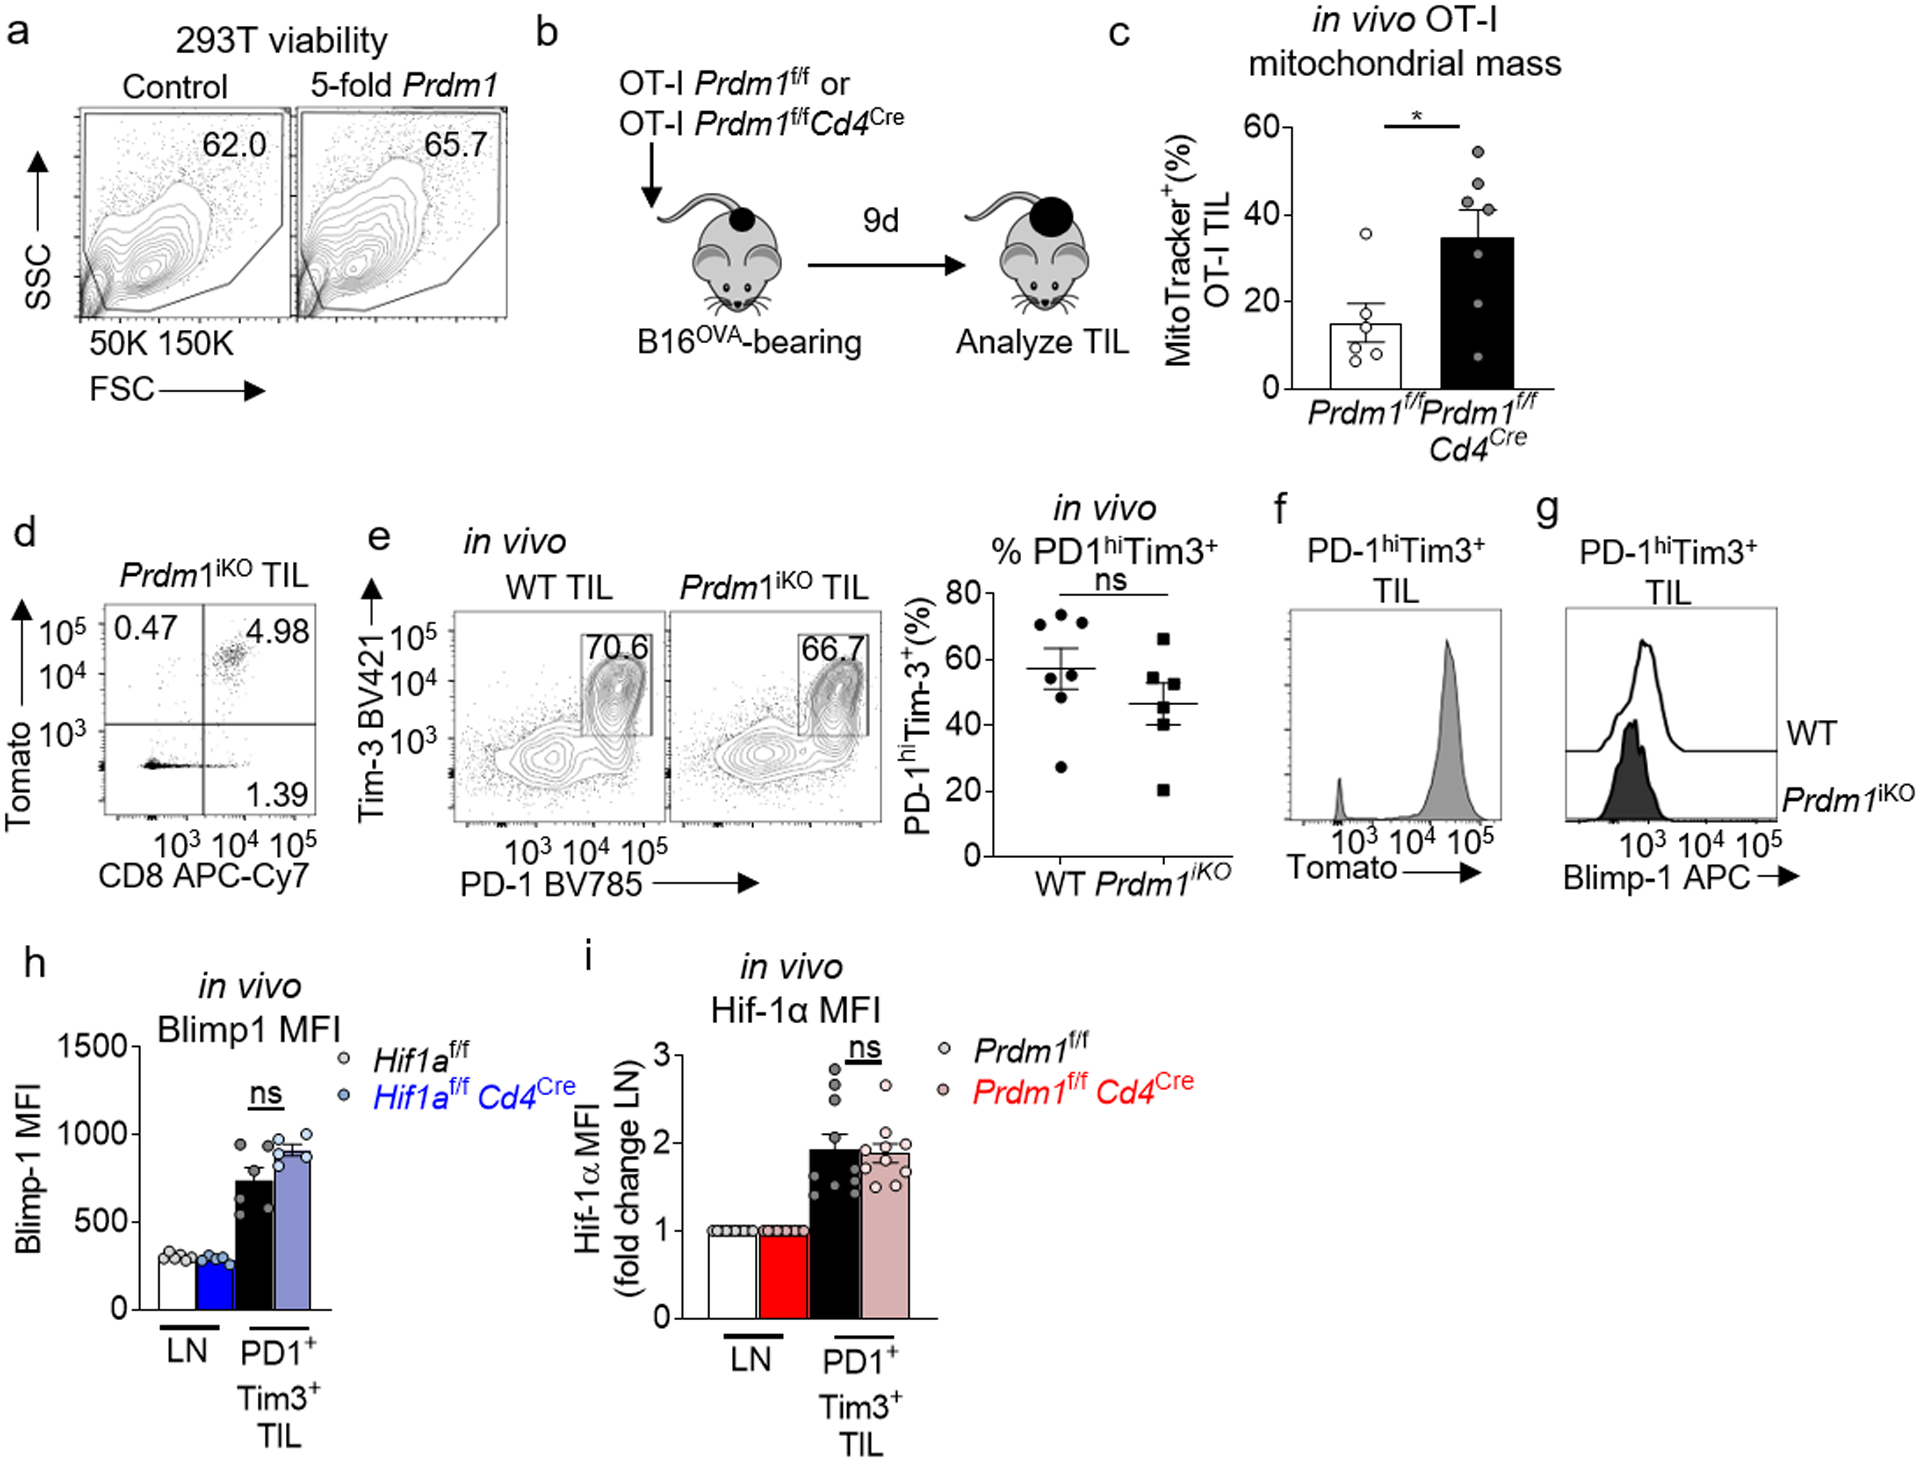
a, Viability of 293T cells from Fig. 4d assessed by flow. b, Schematic of antigen-specific Blimp-1 T cell deletion: Mice bearing 3 mm diameter B16OVA tumors received 2×10⁶ naïve OT-I Prdm1f/fCd4Cre or Prdm1f/f T cells. Nine days later, mice were sacrificed and analyzed, transferred cells identified by Thy1.1+. c, MitoTracker geometric MFI of OT-I T cells transferred as in b. WT n=7 mice, Blimp-1-deficient n=8 mice. d, E8ICreERT2Prdm1f/fR26LSL.Tomato (Prdm1iKO) TIL flow cytogram of CD8 vs Tomato expression after 5 days of tamoxifen. e, WT and Prdm1iKO TIL flow cytogram of PD-1 vs Tim3 after 5 days of tamoxifen, with accompanying quantification. WT n=7 mice, Blimp-1-deficient n=6 mice. f, Prdm1iKO TIL Tomato expression after 5 days of tamoxifen, gated on CD8+ PD-1+ Tim3+ g, WT and Prdm1iKO TIL Blimp-1 staining after 5 days of tamoxifen, gated on CD8+ PD1+ Tim3+ TIL. h, Quantification of HIF1af/fCd4Cre or Cre negative littermate control CD8+ LN and CD8+ PD1hiTim3+ TIL Blimp-1 geometric mean fluorescent intensity. WT n=6 mice, HIF-deficient n=5 mice. i, Quantification of Prdm1f/fCd4Cre or Cre negative littermate control CD8+ LN CD8+ PD1hiTim3+ TIL Hif-1α geometric mean fluorescent intensity, fold change from LN. WT n=10 mice, Blimp-1-deficient n=10 mice. All data are representative of 3–8 independent experiments. *p < 0.05 by unpaired T test (c,e,h,i). Error bars indicate SEM.
Extended Data Figure 6. PGC1α diverts differentiation from exhaustion by mitigating reactive oxygen species.
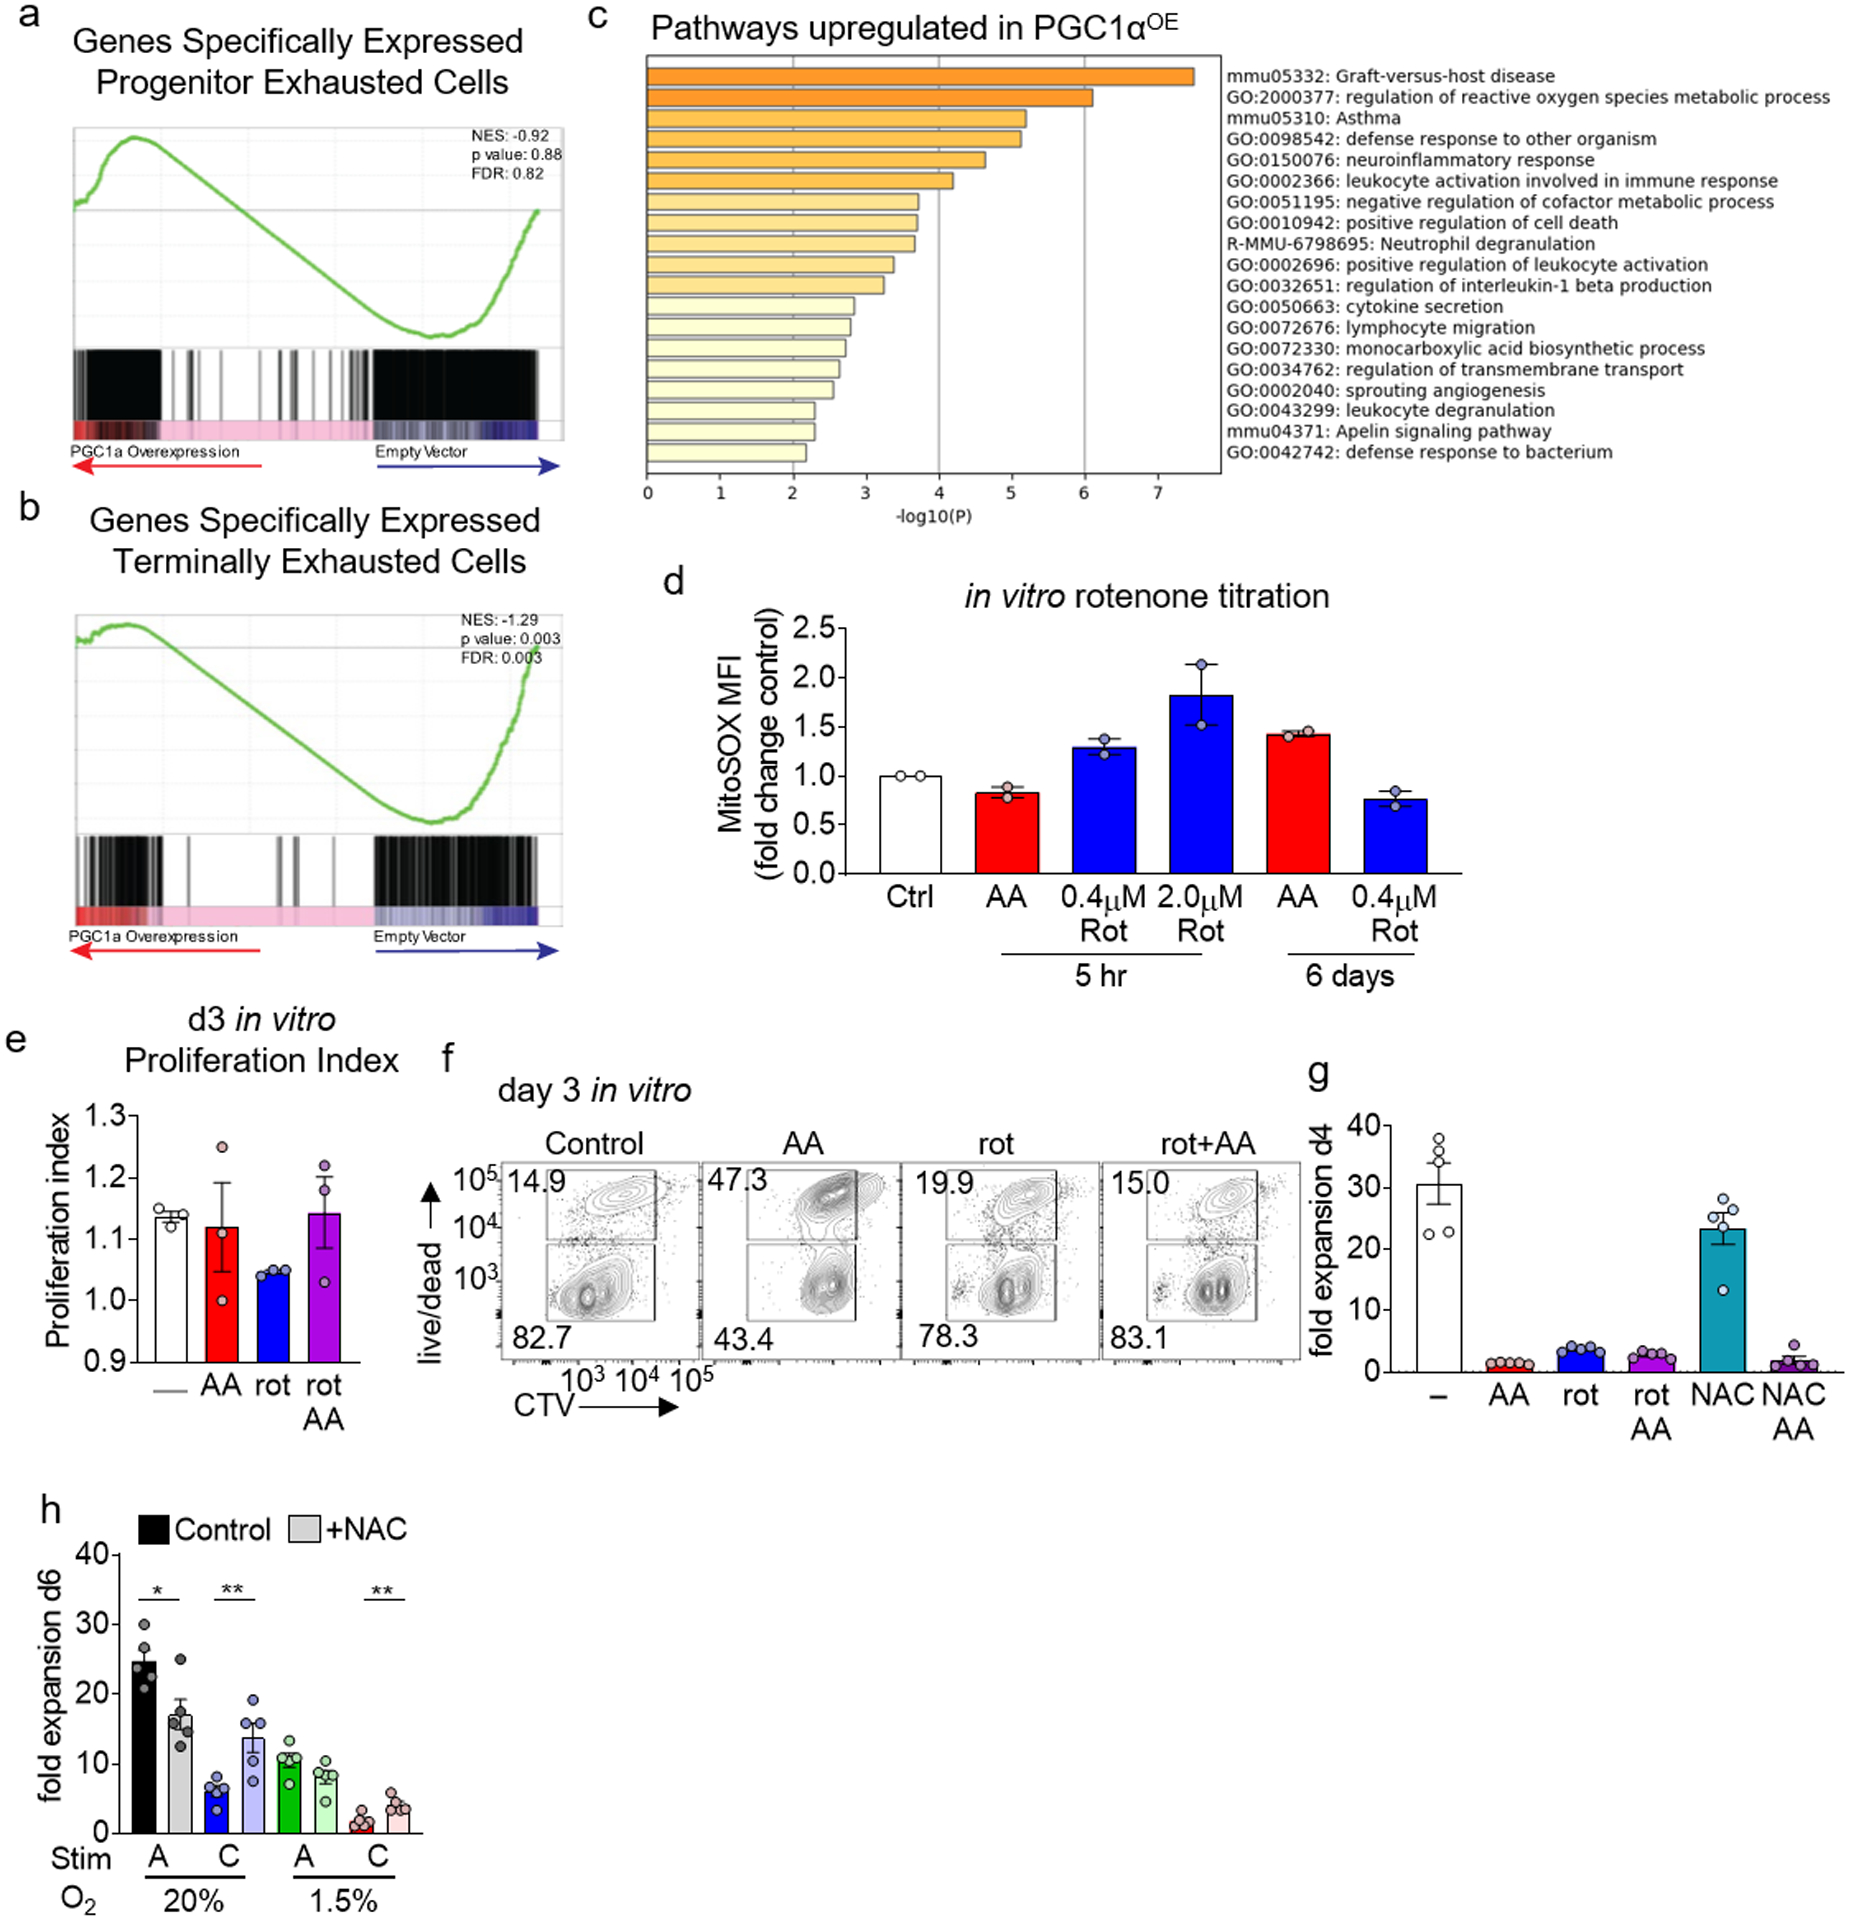
A, Geneset enrichment analysis of EV (n=3) or PGC1αOE (n=3) retrovirally transduced Pmel T cells sorted from B16-F10 as in Fig. 5a. Genesets are previously published comparing to progenitor exhausted T cells as in Fig. 3d. b, As in A but for terminally exhausted T cells. c, Metascape analysis of differentially upregulated pathways in PGC1αOE Pmel T cells sorted directly from the tumor microenvironment. EV n=3, PGC1αOE n=3. d, MitoSOX staining of T cells, normalized to control, cultured 0.04μM AA, or cultured in the indicated amounts of rotenone, for either 5 hr or 6 days. Each group n=2. e, CellTrace Violet dye dilution of day 3 CD8+ T cells cultured in either antimycin A, rotenone, or both. Each group n=3. f, CTV dilution vs live/dead staining of day 3 CD8+ T cells in e. g, Quantification of fold expansion of control cells and those cultured in 0.04μM antimycin A, 0.4μM rotenone, or AA+rot, 10mM NAC, or NAC+AA. Each group n=5. h, Fold expansion of CD8+ T cells in the continuous stimulation under hypoxia assay, +/− antioxidant NAC, quantitation normalized to acute stim in normoxia. Each group n=5. All data are representative of 2–5 independent experiments. *p < 0.05, **p < 0.01 by unpaired T test (h). Error bars indicate SEM.
Extended Data Figure 7. Progressive loss of mtDNA in T cells induces high levels of reactive oxygen species and an exhausted-like state.
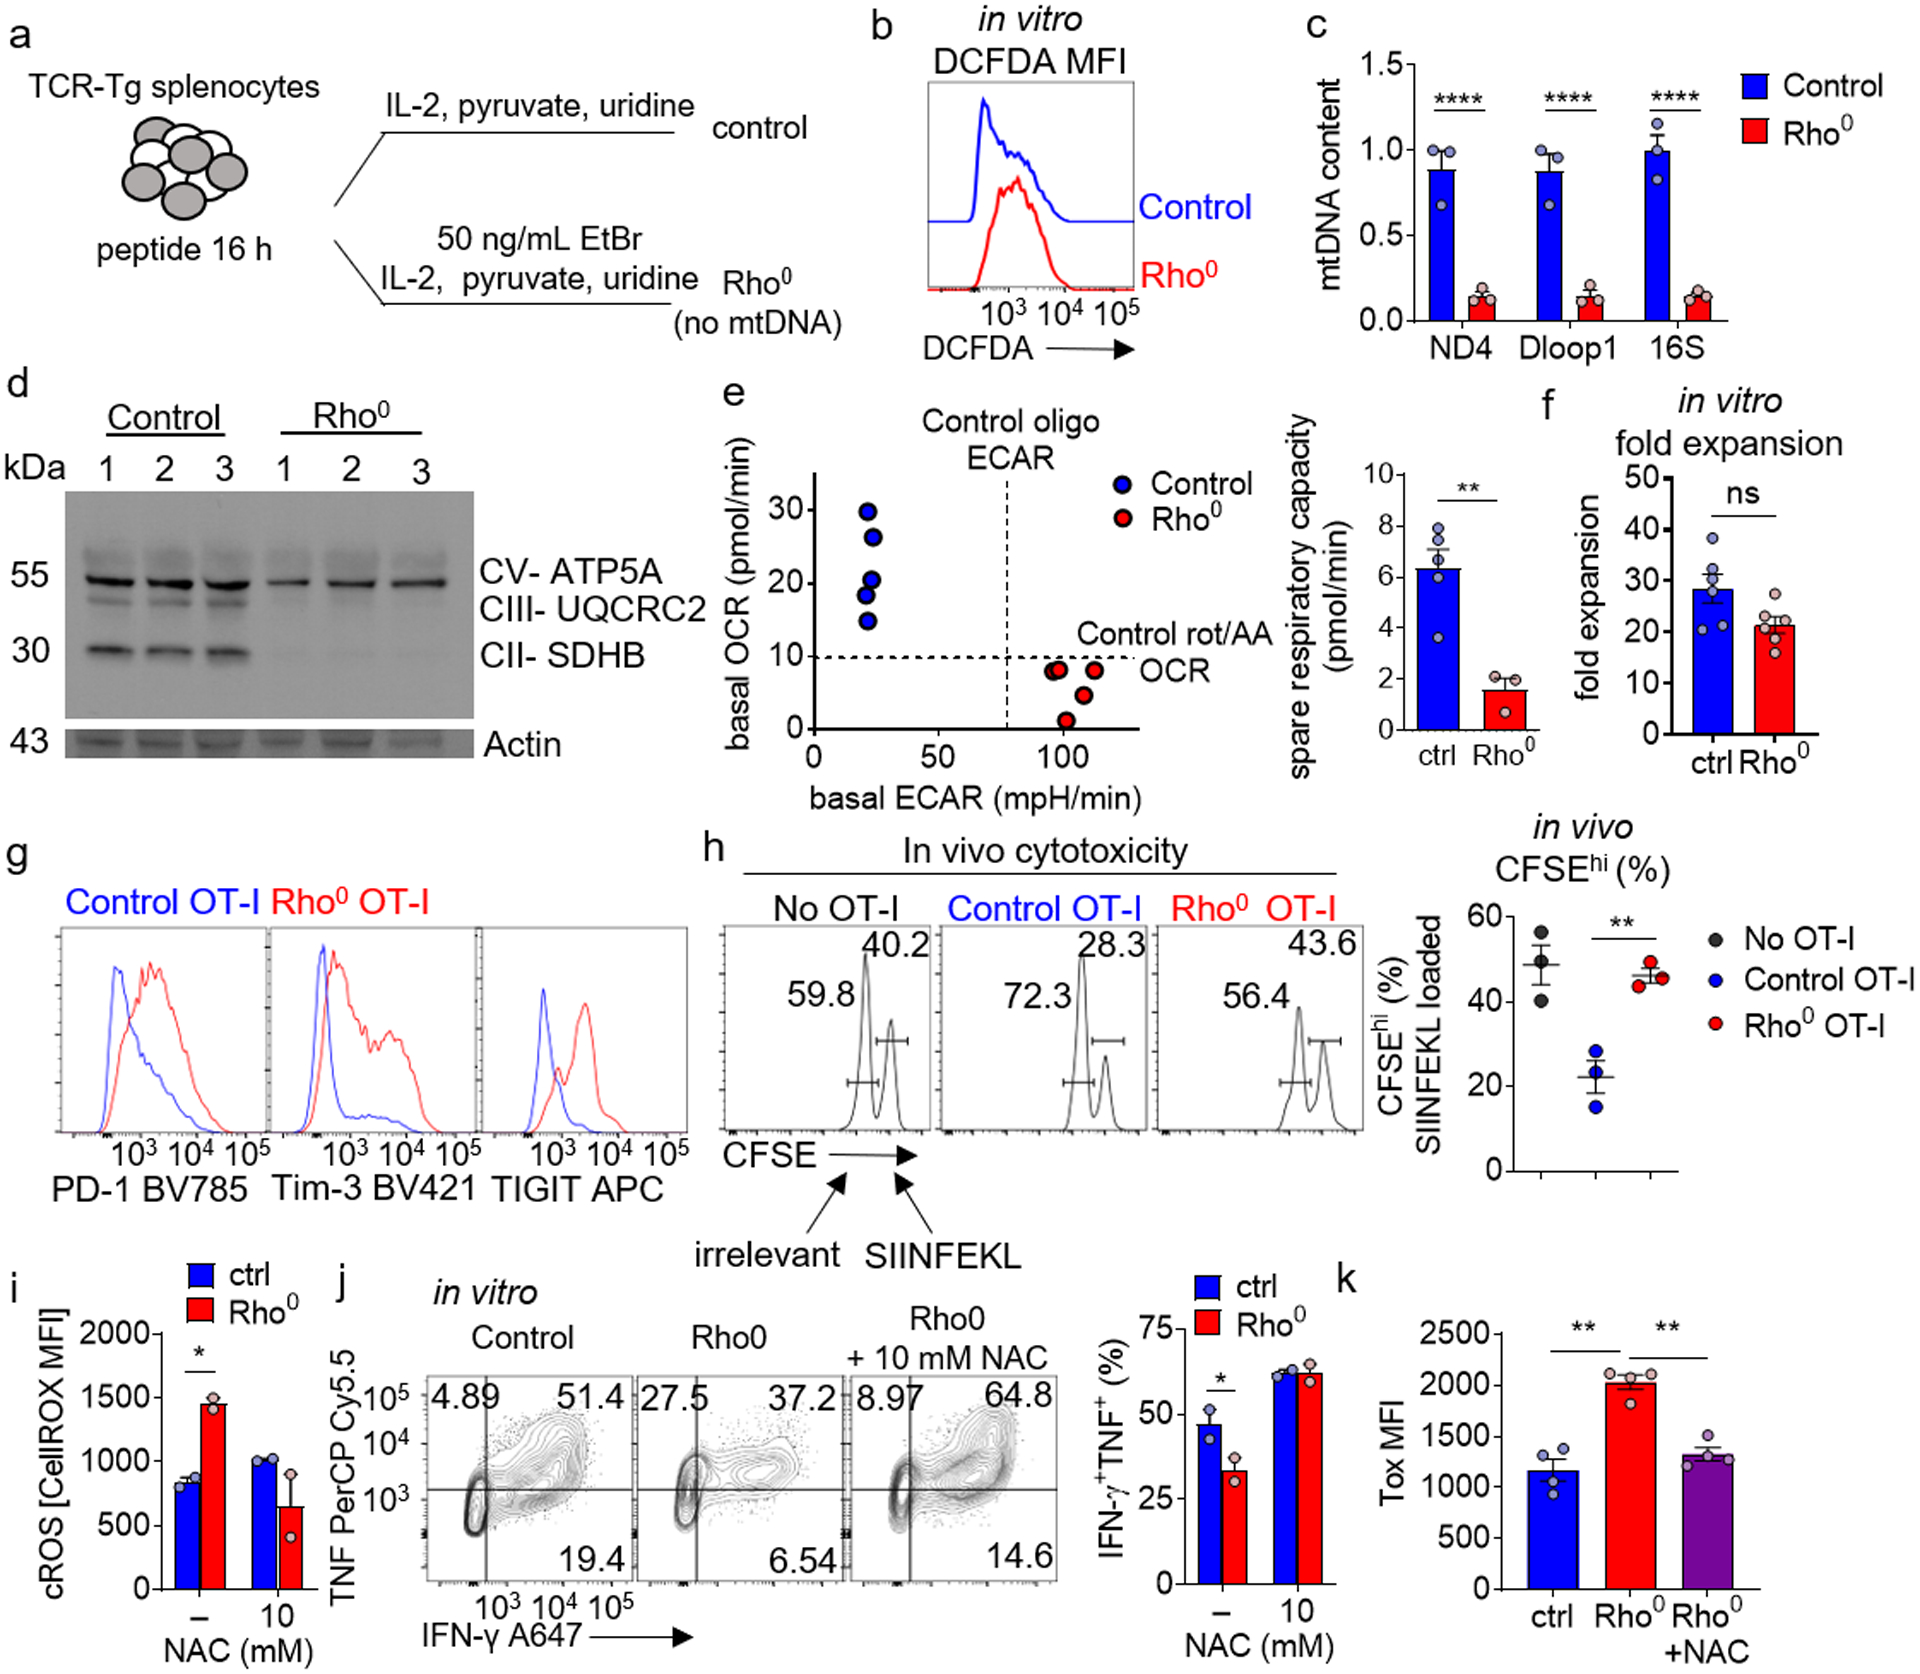
a, Schematic of generation of Rho0 T cells. b, Cellular ROS (DCFDA) staining of Rho0 T cells. c, Control and Rho0 T cell mitochondrial DNA (mtDNA) qPCR of ndufs4 (ND4), mt-dloop1 (Dloop1), and mt-rnr2 (16S), normalized to nuclear DNA. Each group n=3. d, Immunoblot of Control and Rho0 for mitochondrial proteins CV- ATP5A, CIII- UQCRC2, and CII- SDHB. Each group n=3. e, (Left) basal oxygen consumption rate (OCR) versus basal extracellular acidification rate (ECAR) of control vs Rho0 CD8+ T cells. (Right) spare respiratory capacity quantification (difference between basal and FCCP-uncoupled OCR) of control vs Rho0 T cells. Control n=5, Rho0 n=3. f, Quantification of fold expansion of control and Rho0 T cells. Each group n=6. g, PD-1, Tim3, and TIGIT staining on Control and Rho0 OT-I T cells. h, Flow cytogram of target splenocytes cells differentially labeled with CFSE loaded with SIINFEKL or control peptides, transferred into WT mice along with 1 × 10⁵ WT or Rho0 OT-I T cells generated as in b. each group n=3. i, Quantification of ROS staining of Rho0 T cells, cultured in the presence or absence of different concentrations of NAC. Each group n=2. j, (Left) representative flow cytograms of TNF vs IFN-γ production of OT-I T generated as in b (+/− NAC) and stimulated overnight with cognate peptide. (Right) Quantification of percent TNF+ IFN-γ+. Each group n=2. k, Quantification of Tox MFI in CD8+ T cells in control, Rho0, and Rho0+10mM NAC. Each group n=4. All data are representative of 3–5 independent experiments. *p < 0.05, **p < 0.01, ***p < 0.001, ****p < 0.0001 by two-way ANOVA with Sidak’s multiple comparison test (c), one-way ANOVA with Dunnett’s multiple comparison test (k) and by unpaired T test (e,f, h-j). Error bars indicate SEM.
Extended Data Figure 8. Enforced elevation of phosphotyrosine signaling via tyrosine phosphorylation inhibition in isolation can drive an exhausted-like state.
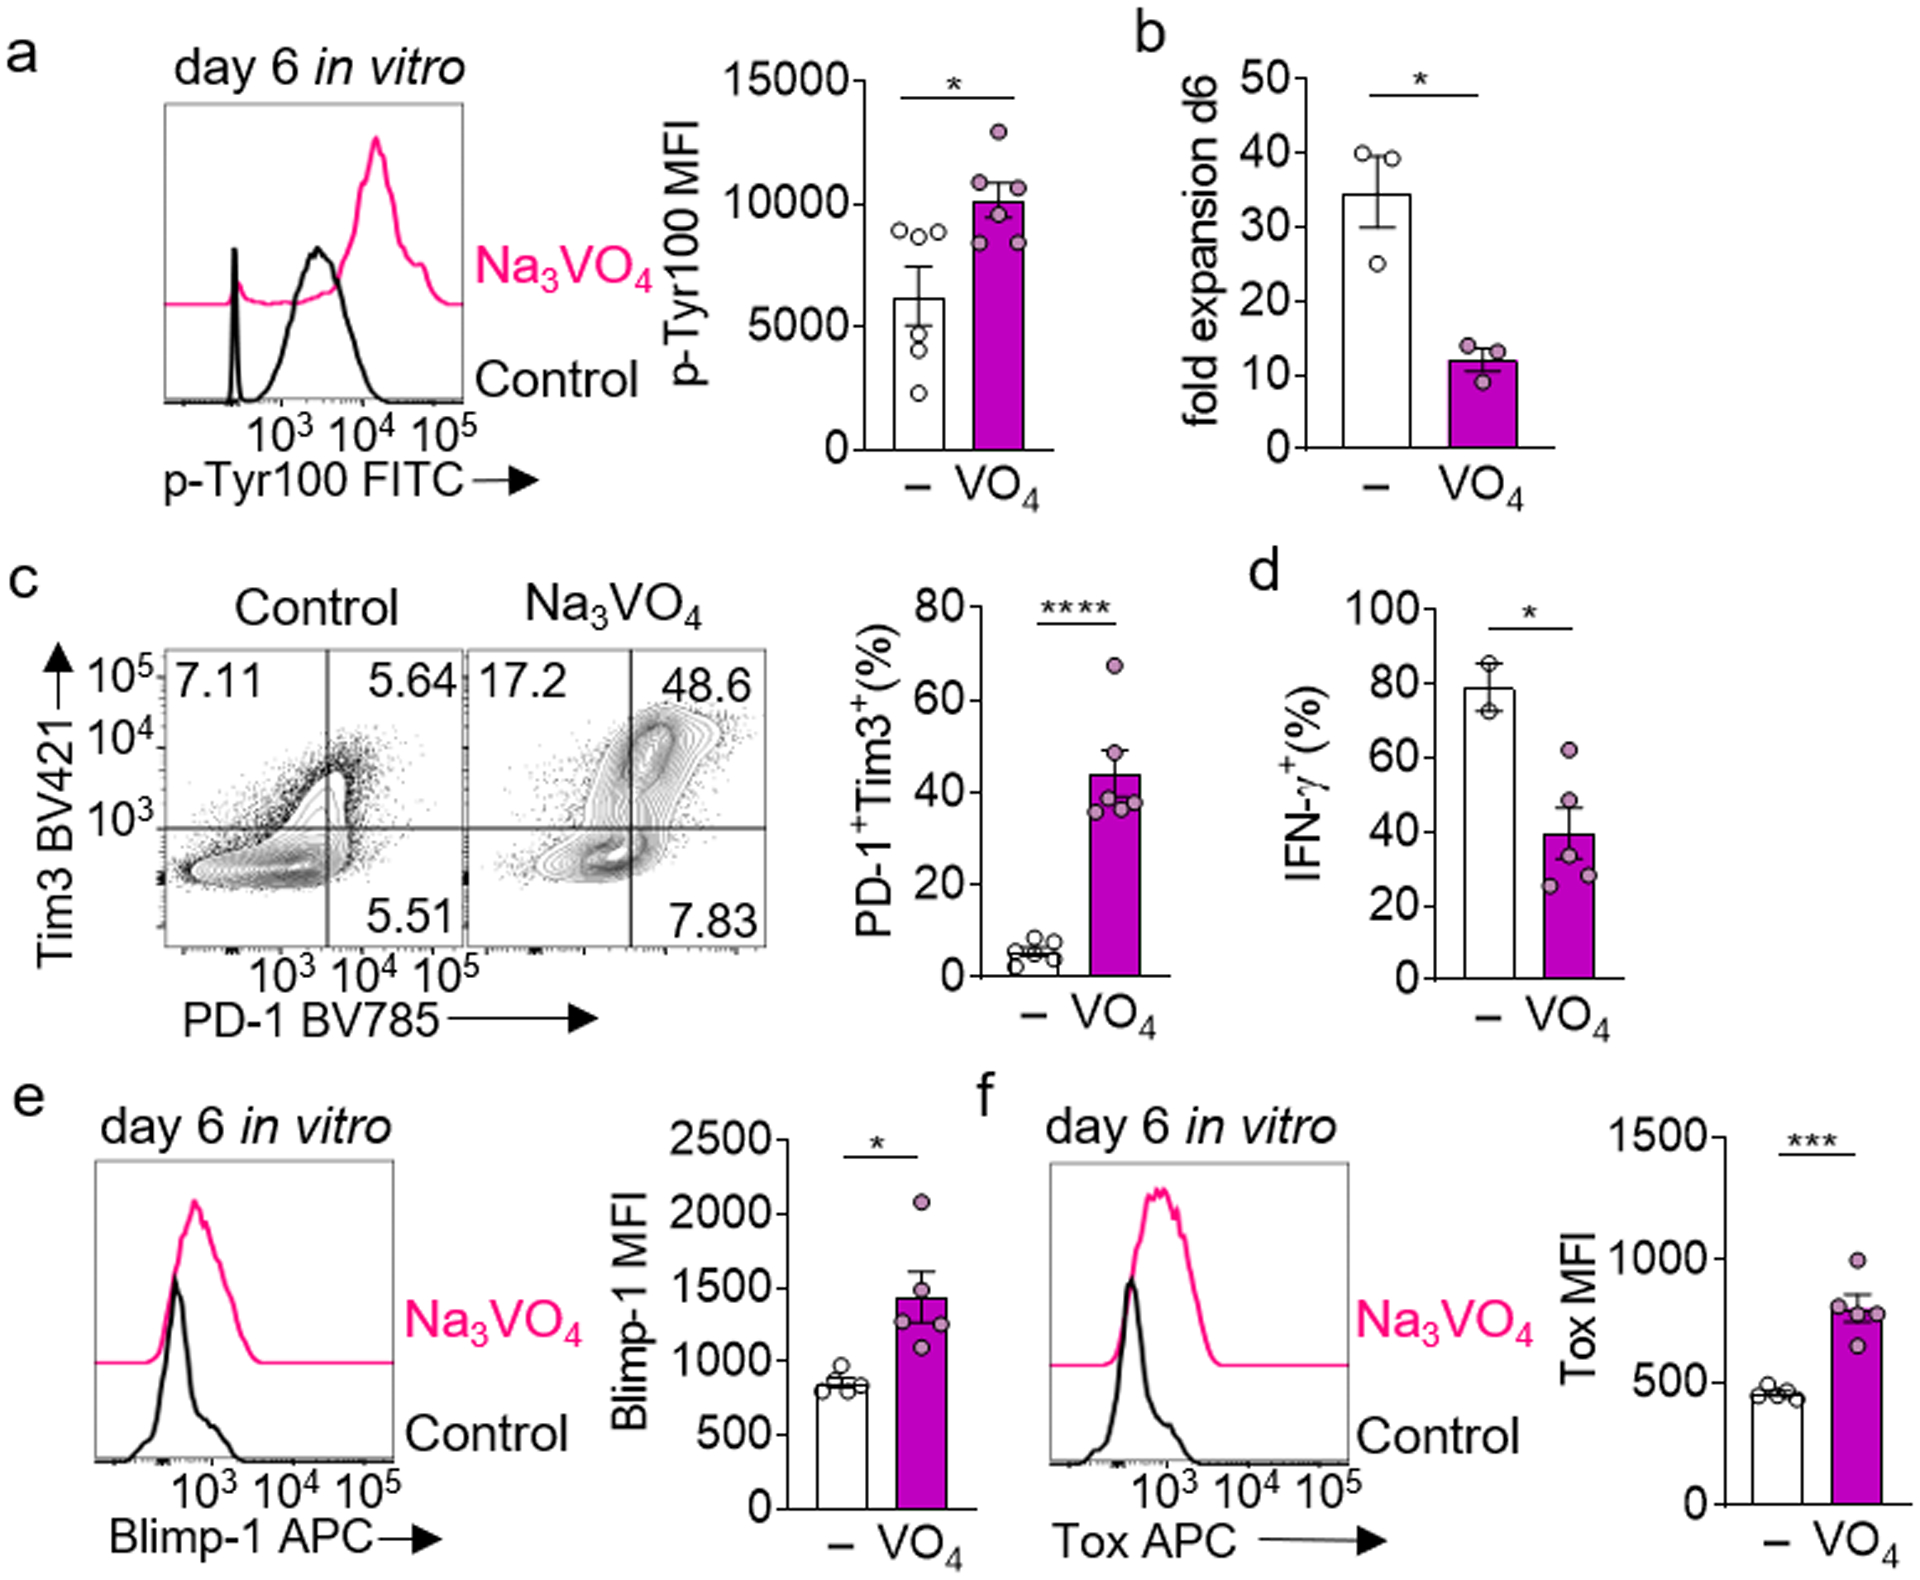
a, (Left) global phosphotyrosine staining of CD8+ T cells cultured in vitro with 50μM sodium orthovanadate, (right) quantification of p-Tyr100 MFI. Each group n=6. b, Quantification of fold expansion of control and Na3VO4-cultured cells. Each group n=3 c, (Left) representative flow cytograms of PD1 vs Tim3 expression in cells cultured in B, (right) quantification of percent PD1+ Tim3+. Each group n=6. d, Quantification of IFN-γ production of Na3VO4-cultured cells after an overnight restimulation with anti-CD3/anti-CD28, golgiplug included in the last 5 hours. Control n=2, Na3VO4 n=4. e, (Left) representative flow histogram of Blimp-1 expression in cells cultured in a, (right) quantification of Blimp-1 MFI. Each group n=5. f, (Left) representative flow histogram of Tox expression in cells cultured in a, (right) quantification of Tox MFI. Each group n=5. All data are representative of 3–5 independent experiments. *p < 0.05, **p < 0.01, ***p < 0.001, ****p < 0.0001 by unpaired T test. Error bars indicate SEM.
Extended Data Figure 9. CD8+ T cells infiltrating tumors engineered to be less hypoxic differentiate away from exhaustion toward effector/memory cells,
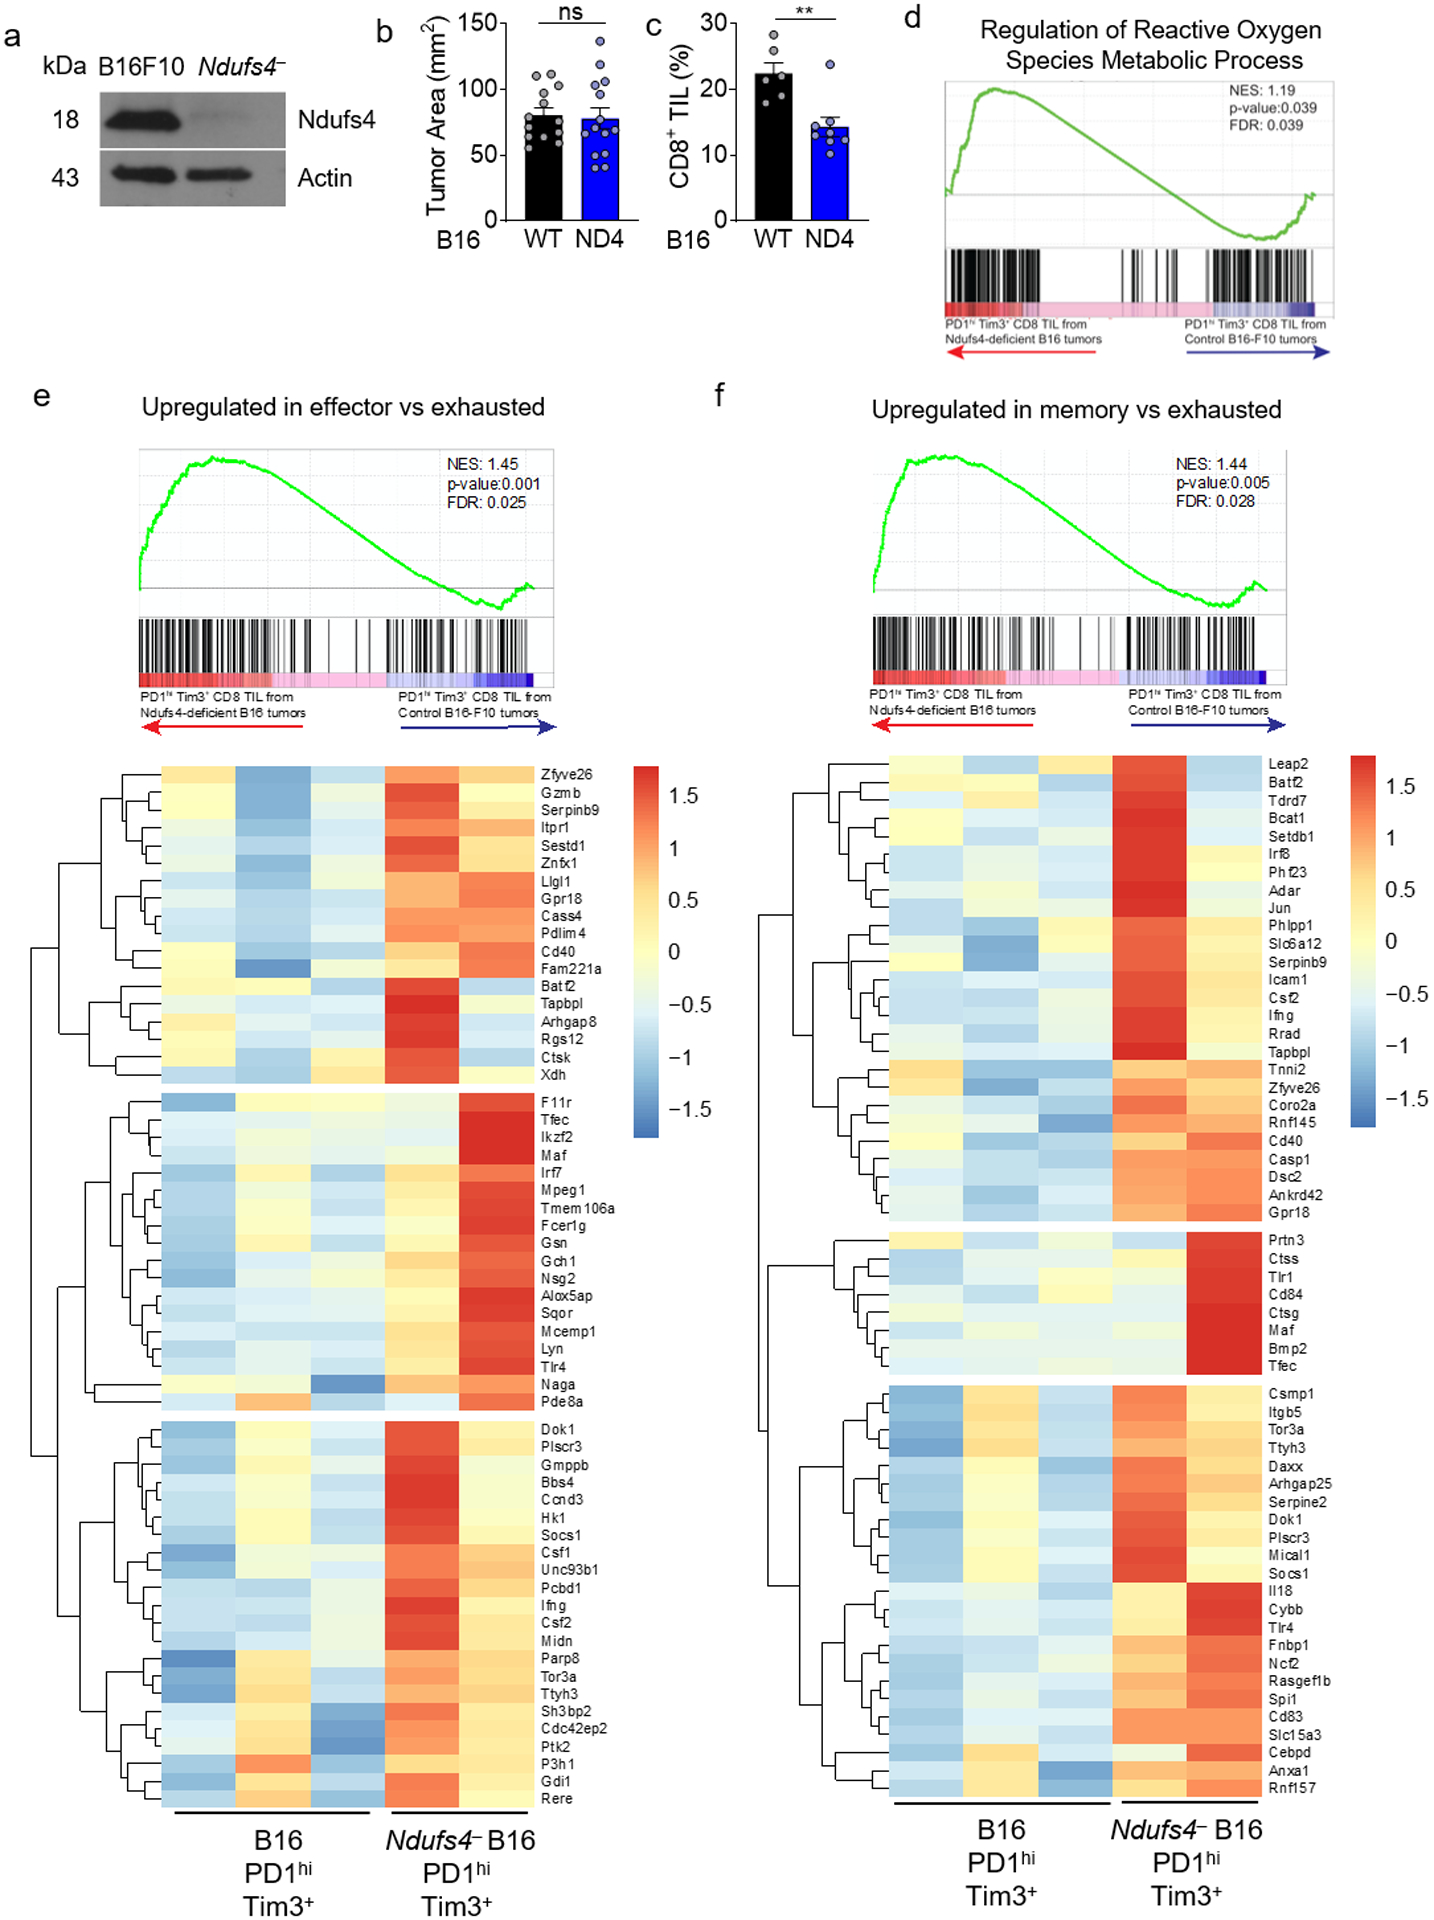
a, Immunoblot of the mitochondrial complex I subunit Ndufs4 in B16-F10 melanoma cells or those in which Ndufs4 has been disrupted using CRISPR-Cas9. n=1. b, Tumor area at d14 (time of analysis) for WT or Ndufs4-deficient B16-F10. WT n=13 mice, Ndufs4-deficient n=14 mice. c, Percent CD8+ T cells infiltrating WT or Ndufs4-deficient B16-F10 tumors. WT n=6 mice, Ndufs4-deficient n=7 mice. d, Leading edge plot of Regulation of Reactive Oxygen Species Metabolic Process (GO:2000377) produced via GSEA analysis of PD-1hiTim3+ CD8+ T cells infiltrating WT or Ndufs4-deficient B16.F10. WT n=3 mice, Ndufs4-deficient n=2 mice. e, as in d, but comparing effector to exhausted T cells, including heatmap. f, as in d, but comparing memory to exhausted T cells, including heatmap. *p < 0.05, **p < 0.01 by unpaired T Test (b,c). Error bars indicate SEM.
Supplementary Material
ACKNOWLEDGEMENTS
The authors would like to thank members of the Delgoffe laboratory for helpful discussions, as well as K.M. Vignali and D.A.A. Vignali for the gift of E8I-GFP-CreERT2 mice. Trainees on this work were supported by the NCI Predoctoral to Postdoctoral Fellow Transition Award (F99/K00) F99CA222711 (to N.E.S.), T32CA082084 (P.D.A.V. and K.D), F30CA247034 (to P.D.A.V.), F31CA247129 (to. K.D.), and T32AI089443 (R.P.). This work was supported by an NIH New Innovator Award (DP2AI136598) and R21AI135367, the UPMC Hillman Cancer Center Melanoma/Skin Cancer (P50CA121973) and Head and Neck Cancer SPORE (P50CA097190), a SU2C-AACR Innovative Research Grant (SU2C-AACR-IRG-04-16), the U.S. Army/Department of Defense (CA170483) the Alliance for Cancer Gene Therapy, the Mark Foundation for Cancer Research Emerging Leader Award, the Cancer Research Institute Lloyd J. Old STAR Award, and the Sy Holzer Endowed Cancer Immunotherapy Fund (all to G.M.D.). This work utilized flow cytometry and animal facilities at UPMC Hillman Cancer Center, supported by P30CA047904.
Footnotes
Data availability statement
RNA-seq data have been deposited to the Gene Expression Omnibus with the accession code GSE155192. Source data for Fig 3d,e, and Extended Data Fig. 3a,b are available in the GEO repository GSE122713 and source data for Extended Data Fig. 9e,f are available in the GEO repository GSE109125. The data that support the findings of this study are available from the corresponding authors upon request.
COMPETING INTERESTS STATEMENT
G.M.D. declares competing financial interests and has submitted patents covering the use of PGC1α in cell therapies that are licensed or pending and is entitled to a share in net income generated from licensing of these patent rights for commercial development. G.M.D. consults for and/or is on the scientific advisory board of BlueSphere Bio, Century Therapeutics, Novasenta, Pieris Pharmaceuticals, and Western Oncolytics/Kalivir; has grants from bluebird bio, Novasenta, Pfizer, Pieris Pharmaceuticals, TCR2, and Western Oncolytics/Kalivir; G.M.D. owns stock in Novasenta.
REFERENCES
- 1.Taniuchi I CD4 Helper and CD8 Cytotoxic T Cell Differentiation. Annu. Rev. Immunol 36, 579–601 (2018). [DOI] [PubMed] [Google Scholar]
- 2.Chang JT, Wherry EJ & Goldrath AW Molecular regulation of effector and memory T cell differentiation. Nat. Rev. Immunol 15, 1104–15 (2014). [DOI] [PMC free article] [PubMed] [Google Scholar]
- 3.McLane LM, Abdel-Hakeem MS & Wherry EJ CD8 T Cell Exhaustion During Chronic Viral Infection and Cancer. Annu. Rev. Immunol 37, 457–495 (2019). [DOI] [PubMed] [Google Scholar]
- 4.Paley MA et al. Progenitor and terminal subsets of CD8+ T cells cooperate to contain chronic viral infection. Science 338, 1220–1225 (2012). [DOI] [PMC free article] [PubMed] [Google Scholar]
- 5.Shin H et al. A Role for the Transcriptional Repressor Blimp-1 in CD8 + T Cell Exhaustion during Chronic Viral Infection. Immunity 31, 309–320 (2009). [DOI] [PMC free article] [PubMed] [Google Scholar]
- 6.Chihara N et al. Induction and transcriptional regulation of the co-inhibitory gene module in T cells. Nature 558, 454–459 (2018). [DOI] [PMC free article] [PubMed] [Google Scholar]
- 7.Martinez GJ et al. The Transcription Factor NFAT Promotes Exhaustion of Activated CD8+ T Cells. Immunity 42, 265–278 (2015). [DOI] [PMC free article] [PubMed] [Google Scholar]
- 8.Mann TH & Kaech SM Tick-TOX, it’s time for T cell exhaustion. Nat. Immunol 20, 1092–1094 (2019). [DOI] [PubMed] [Google Scholar]
- 9.Sen DR et al. The epigenetic landscape of T cell exhaustion. Science 354, 1165 LP– (2016). [DOI] [PMC free article] [PubMed] [Google Scholar]
- 10.Pauken KE et al. Epigenetic stability of exhausted T cells limits durability of reinvigoration by PD-1 blockade. Science 354, 1160–1165 (2016). [DOI] [PMC free article] [PubMed] [Google Scholar]
- 11.Philip M et al. Chromatin states define tumour-specific T cell dysfunction and reprogramming. Nature 545, 452–456 (2017). [DOI] [PMC free article] [PubMed] [Google Scholar]
- 12.Blank CU et al. Defining ‘T cell exhaustion’. Nat. Rev. Immunol doi: 10.1038/s41577-019-0221-9. (2019) [DOI] [PMC free article] [PubMed] [Google Scholar]
- 13.Scharping N & Delgoffe G Tumor Microenvironment Metabolism: A New Checkpoint for Anti-Tumor Immunity. Vaccines 4, 46 (2016). [DOI] [PMC free article] [PubMed] [Google Scholar]
- 14.Martinez-Outschoorn UE, Peiris-Pagés M, Pestell RG, Sotgia F & Lisanti MP Cancer metabolism: a therapeutic perspective. Nat. Rev. Clin. Oncol (2016) doi: 10.1038/nrclinonc.2016.60. [DOI] [PubMed] [Google Scholar]
- 15.Scharping NE et al. The Tumor Microenvironment Represses T Cell Mitochondrial Biogenesis to Drive Intratumoral T Cell Metabolic Insufficiency and Dysfunction. Immunity 45, 374–388 (2016). [DOI] [PMC free article] [PubMed] [Google Scholar]
- 16.Scharping NE, Menk AV, Whetstone RD, Zeng X & Delgoffe GM Efficacy of PD-1 Blockade Is Potentiated by Metformin-Induced Reduction of Tumor Hypoxia. Cancer Immunol. Res 5, 9–16 (2017). [DOI] [PMC free article] [PubMed] [Google Scholar]
- 17.Menk AV et al. 4–1BB costimulation induces T cell mitochondrial function and biogenesis enabling cancer immunotherapeutic responses. J. Exp. Med 215, 1091–1100 (2018). [DOI] [PMC free article] [PubMed] [Google Scholar]
- 18.Najjar YG et al. Tumor cell oxidative metabolism as a barrier to PD-1 blockade immunotherapy in melanoma. JCI Insight 4, e124989 (2019). [DOI] [PMC free article] [PubMed] [Google Scholar]
- 19.Chang CH et al. Metabolic Competition in the Tumor Microenvironment Is a Driver of Cancer Progression. Cell 162, 1229–1241 (2015). [DOI] [PMC free article] [PubMed] [Google Scholar]
- 20.Leone RD et al. Glutamine blockade induces divergent metabolic programs to overcome tumor immune evasion. Science eaav2588 (2019) doi: 10.1126/science.aav2588. [DOI] [PMC free article] [PubMed] [Google Scholar]
- 21.Miller BC et al. Subsets of exhausted CD8+ T cells differentially mediate tumor control and respond to checkpoint blockade. Nat. Immunol 20, 326–336 (2019). [DOI] [PMC free article] [PubMed] [Google Scholar]
- 22.Sade-Feldman M et al. Defining T Cell States Associated with Response to Checkpoint Immunotherapy in Melanoma. Cell 175, 998–1013. e20 (2018). [DOI] [PMC free article] [PubMed] [Google Scholar]
- 23.Doedens AL et al. Hypoxia-inducible factors enhance the effector responses of CD8 + T cells to persistent antigen. Nat. Immunol 14, 1173–1182 (2013). [DOI] [PMC free article] [PubMed] [Google Scholar]
- 24.Gropper Y et al. Culturing CTLs under Hypoxic Conditions Enhances Their Cytolysis and Improves Their Anti-tumor Function. Cell Rep 20, 2547–2555 (2017). [DOI] [PubMed] [Google Scholar]
- 25.Li Y, Patel SP, Roszik J & Qin Y Hypoxia-Driven Immunosuppressive Metabolites in the Tumor Microenvironment: New Approaches for Combinational Immunotherapy. Front. Immunol 9, 1591 (2018). [DOI] [PMC free article] [PubMed] [Google Scholar]
- 26.Horton BL, Williams JB, Cabanov A, Spranger S & Gajewski TF Intratumoral CD8+ T-cell Apoptosis Is a Major Component of T-cell Dysfunction and Impedes Antitumor Immunity. Cancer Immunol. Res 6, 14 LP – 24 (2018). [DOI] [PMC free article] [PubMed] [Google Scholar]
- 27.Crawford A et al. Molecular and transcriptional basis of CD4+ T cell dysfunction during chronic infection. Immunity 40, 289–302 (2014). [DOI] [PMC free article] [PubMed] [Google Scholar]
- 28.Sawant DV et al. Adaptive plasticity of IL-10+ and IL-35+ Treg cells cooperatively promotes tumor T cell exhaustion. Nat. Immunol 20, 724–735 (2019). [DOI] [PMC free article] [PubMed] [Google Scholar]
- 29.Liu C et al. Neuropilin-1 is a T cell memory checkpoint limiting long-term antitumor immunity. Nat. Immunol (2020) doi: 10.1038/s41590-020-0733-2. [DOI] [PMC free article] [PubMed] [Google Scholar]
- 30.Chinopoulos C Which way does the citric acid cycle turn during hypoxia? The critical role of α-ketoglutarate dehydrogenase complex. J. Neurosci. Res 91, 1030–1043 (2013). [DOI] [PubMed] [Google Scholar]
- 31.Sukumar M et al. Mitochondrial Membrane Potential Identifies Cells with Enhanced Stemness for Cellular Therapy. Cell Metab 23, 63–76 (2016). [DOI] [PMC free article] [PubMed] [Google Scholar]
- 32.Siska PJ et al. Mitochondrial dysregulation and glycolytic insufficiency functionally impair CD8 T cells infiltrating human renal cell carcinoma. JCI insight 2,e93411 (2017). [DOI] [PMC free article] [PubMed] [Google Scholar]
- 33.Hurst KE et al. Endoplasmic Reticulum Stress Contributes to Mitochondrial Exhaustion of CD8+ T Cells. Cancer Immunol. Res 7, 476 LP – 486 (2019). [DOI] [PMC free article] [PubMed] [Google Scholar]
- 34.Dröse S & Brandt U The mechanism of mitochondrial superoxide production by the cytochrome bc1 Complex. J. Biol. Chem 283, 21649–21654 (2008). [DOI] [PubMed] [Google Scholar]
- 35.Li N et al. Mitochondrial complex I inhibitor rotenone induces apoptosis through enhancing mitochondrial reactive oxygen species production. J. Biol. Chem 278, 8516–8525 (2003). [DOI] [PubMed] [Google Scholar]
- 36.Chandel NS, Maltepe E, Goldwasser E, Mathieu CE, Simon MC, S. P Mitochondrial reactive oxygen species trigger hypoxia-induced transcription. Proc. Natl. Acad. Sci. U. S. A 95, 11715–11720 (1998). [DOI] [PMC free article] [PubMed] [Google Scholar]
- 37.Acín-Pérez R et al. Mitochondrial Respiration Controls Lysosomal Function during Inflammatory T Cell Responses. Cell Metab 22, 485–498 (2015). [DOI] [PMC free article] [PubMed] [Google Scholar]
- 38.Schieber M & Chandel NS ROS Function in Redox Signaling and Oxidative Stress. Curr. Biol 24, R453–R462 (2014). [DOI] [PMC free article] [PubMed] [Google Scholar]
- 39.Sena LA et al. Mitochondria Are Required for Antigen-Specific T Cell Activation through Reactive Oxygen Species Signaling. Immunity 38, 225–236 (2013). [DOI] [PMC free article] [PubMed] [Google Scholar]
- 40.St-Pierre J et al. Suppression of Reactive Oxygen Species and Neurodegeneration by the PGC-1 Transcriptional Coactivators. Cell 127, 397–408 (2006). [DOI] [PubMed] [Google Scholar]
- 41.Schaaf MB, Garg AD & Agostinis P Defining the role of the tumor vasculature in antitumor immunity and immunotherapy. Cell Death Dis 9, 115 (2018). [DOI] [PMC free article] [PubMed] [Google Scholar]
- 42.Motzer RJ et al. Avelumab plus Axitinib versus Sunitinib for Advanced Renal-Cell Carcinoma. N. Engl. J. Med 380, 1103–1115 (2019). [DOI] [PMC free article] [PubMed] [Google Scholar]
- 43.Bengsch B et al. Bioenergetic Insufficiencies Due to Metabolic Alterations Regulated by the Inhibitory Receptor PD-1 Are an Early Driver of CD8 + T Cell Exhaustion. Immunity 45, 1–16 (2016). [DOI] [PMC free article] [PubMed] [Google Scholar]
- 44.Ho PC et al. Phosphoenolpyruvate Is a Metabolic Checkpoint of Anti-tumor T Cell Responses. Cell 162, 1217–1228 (2015). [DOI] [PMC free article] [PubMed] [Google Scholar]
- 45.Phan AT et al. Constitutive Glycolytic Metabolism Supports CD8+ T Cell Effector Memory Differentiation during Viral Infection. Immunity 45, 1024–1037 (2016). [DOI] [PMC free article] [PubMed] [Google Scholar]
- 46.Mehta MM, Weinberg SE & Chandel NS Mitochondrial control of immunity: beyond ATP. Nat. Rev. Immunol 17, 608–620 (2017). [DOI] [PubMed] [Google Scholar]
- 47.Mach WJ, Thimmesch AR, Pierce JT & Pierce JD Consequences of Hyperoxia and the Toxicity of Oxygen in the Lung. Nurs. Res. Pract 2011, 260482 (2011). [DOI] [PMC free article] [PubMed] [Google Scholar]
- 48.Blaser H, Dostert C, Mak TW & Brenner D TNF and ROS Crosstalk in Inflammation. Trends Cell Biol 26, 249–261 (2016). [DOI] [PubMed] [Google Scholar]
- 49.Wellen KE & Thompson CB Cellular Metabolic Stress: Considering How Cells Respond to Nutrient Excess. Mol. Cell 40, 323–332 (2010). [DOI] [PMC free article] [PubMed] [Google Scholar]
- 50.Vardhana SA et al. Impaired mitochondrial oxidative phosphorylation limits the self-renewal of T cells exposed to persistent antigen. Nat. Immunol (2020) doi: 10.1038/s41590-020-0725-2. [DOI] [PMC free article] [PubMed] [Google Scholar]
- 51.Voron T et al. VEGF-A modulates expression of inhibitory checkpoints on CD8+ T cells in tumors. J. Exp. Med 212, 139–148 (2015). [DOI] [PMC free article] [PubMed] [Google Scholar]
- 52.Palazon A et al. An HIF-1α/VEGF-A Axis in Cytotoxic T Cells Regulates Tumor Progression. Cancer Cell 32, 669–683. e5 (2017). [DOI] [PMC free article] [PubMed] [Google Scholar]
- 53.Bacik I, Cox JH, Anderson R, Yewdell JW & Bennink JR TAP (transporter associated with antigen processing)-independent presentation of endogenously synthesized peptides is enhanced by endoplasmic reticulum insertion sequences located at the amino- but not carboxyl-terminus of the peptide. J. Immunol 152, 381 LP – 387 (1994). [PubMed] [Google Scholar]
- 54.Delgoffe GM et al. The mTOR Kinase Differentially Regulates Effector and Regulatory T Cell Lineage Commitment. Immunity 30, 832–844 (2009). [DOI] [PMC free article] [PubMed] [Google Scholar]
- 55.Monsalve M et al. Direct coupling of transcription and mRNA processing through the thermogenic coactivator PGC-1. Mol. Cell 6, 307–316 (2000). [DOI] [PubMed] [Google Scholar]
- 56.Poholek AC et al. IL-10 induces a STAT3-dependent autoregulatory loop in TH2 cells that promotes Blimp-1 restriction of cell expansion via antagonism of STAT5 target genes. Sci. Immunol 1, eaaf8612 (2016). [DOI] [PMC free article] [PubMed] [Google Scholar]
Associated Data
This section collects any data citations, data availability statements, or supplementary materials included in this article.


