

Objective
The aims of this retrospective study were to assess the value of the quantitative analysis of apparent diffusion coefficient (ADC) and proton magnetic resonance spectroscopy (1H-MRS) metabolites in differentiating grades of pediatric gliomas.
Patients and Methods
Two hundred and nine pathology-confirmed pediatric gliomas (143 low-grade gliomas [LGGs] and 66 high-grade gliomas [HGGs]) were retrospectively analyzed on preoperative diffusion-weighted magnetic resonance imaging, of which 84 also underwent 1H-MRS. The mean tumor ADC (ADCmean), minimum tumor ADC (ADCmin), tumor/normal brain ADC ratio (ADC ratio), and metabolites (choline/creatine ratio [Cho/Cr], N-acetylaspartate/creatine ratio [NAA/Cr], N-acetylaspartate/choline ratio [NAA/Cho], presence of lactate and lipid peaks) between LGGs and HGGs were analyzed.
Results
There were significant negative correlations between the ADC values and glioma grade. Receiver operating characteristic analysis showed that the cutoff ADCmean value of 1.192 × 10⁻³ mm2/s for the differentiation between low- and high-grade pediatric gliomas provided a sensitivity, specificity, accuracy, positive predictive value (PPV), and negative predictive value (NPV) of 77.6%, 80.3%, 78.5%, 89.5% and 62.4%, respectively; the cutoff ADCmin value of 0.973 × 10⁻³ mm2/s resulted in a sensitivity, specificity, accuracy, PPV, and NPV of 86.0%, 90.9%, 87.6%, 95.3%, and 75.0%, respectively; the cutoff ADC ratio value of 1.384 resulted in a sensitivity, specificity, accuracy, PPV, and NPV of 73.4%, 87.9%, 78.0%, 92.9%, and 60.4%, respectively. A tendency for a positive correlation was found between Cho/Cr and glioma grade. A negative correlation was demonstrated between NAA/Cr or NAA/Cho and glioma grade. Statistical analysis demonstrated a threshold value of 2.601 for Cho/Cr to provide a sensitivity, specificity, accuracy, PPV, and NPV of 81.8%, 51.7%, 71.4%, 76.3%, and 60.0%, respectively, in dividing LGGs and HGGs; a threshold value of 0.705 for NAA/Cr to provide a sensitivity, specificity, accuracy, PPV, and NPV of 76.4%, 75.9%, 76.2%, 85.7%, and 62.9%, respectively; a threshold value of 0.349 for NAA/Cho to provide a sensitivity, specificity, accuracy, PPV, and NPV of 87.3%, 86.2%, 86.9%, 92.3%, and 78.1%, respectively.
Conclusions
The ADC values and metabolites appeared to be significantly correlated to grade in pediatric gliomas. The predictive values may be helpful for preoperative diagnostic predictions.
Key Words: pediatric gliomas, apparent diffusion coefficient, magnetic resonance spectroscopy, metabolism
Gliomas are the most common primary central nervous system neoplasms in children and adolescents, accounting for approximately 56% to 70% of all reported cases.1,2 According to the 2016 World Health Organization (WHO) classification criteria of central nervous system tumors, cerebral gliomas are categorized as low-grade gliomas (LGGs, WHO grades I and II) and high-grade gliomas (HGGs, WHO grades III and IV). Gliomas mainly include astrocytic tumors (grades I, II, III and IV), oligodendrogliomas (grades II and III), and oligoastrocytomas (grades II and III).3–6
A great majority of pediatric gliomas present as benign, slow-growing lesions classified as low-grade gliomas and rarely undergo malignant transformation.7 Stokland et al8 found that the outcomes of LGGs were typically good, with a 5-year overall survival of 65% to 78%. Pediatric high-grade gliomas manifest as malignant, diffuse, infiltrating tumors, and have a dismal prognosis (5-year survival of 5% for glioblastoma).9 Gliomas typically grow in an infiltrative manner, invading the surrounding tissues; the higher the histological grade of the glioma is, the stronger the infiltration. It is difficult to completely excise gliomas surgically, and they easily recur after operation.10 High-grade gliomas undergraded as LGGs consequently result in insufficient treatment. The preoperative guideline for predicting the tendency of the glioma based on grading has clinical significance for shaping appropriate therapeutic strategies and for assessing the likely prognosis.11,12
Distinguishing LGGs from HGGs is often difficult using conventional magnetic resonance imaging (MRI) because the enhancement is not reliable for determining glioma grade and its accuracy is only 55% to 83%. It is also often related to the clinical radiologist's personal experience.13,14 Advanced multiparametric magnetic resonance (MR) techniques provide important additional information and have been reported to increase diagnostic accuracy by including the biological, physiological, histopathological, and metabolic features of the tumors. Diffusion-weighted imaging (DWI) and proton magnetic resonance spectroscopy (1H-MRS) allow the assessment of tissue characteristics, such as the microscopic water diffusion and the metabolic tissue composition of the tumors, respectively.15,16 These are very important parameters in grading brain gliomas and could, therefore, further improve the diagnostic accuracy of conventional MRI.
The aims of this study were to investigate the role of apparent diffusion coefficient (ADC) values and metabolite ratios in differentiating low-grade from high-grade pediatric gliomas in terms of sensitivity, specificity, accuracy, positive predictive value (PPV), negative predictive value (NPV), and area under the curve (AUC) to determine whether DWI and MRS can be useful for predicting the grade of pediatric gliomas.
PATIENTS AND METHODS
Study Population
Initially, the records of 439 pediatric patients with primary brain gliomas, who presented to our hospital between September 2008 and August 2017, were searched in this study. The inclusion criteria were as follows: the diagnosis of gliomas in all cases were proven by histological and immunohistochemical examinations, and tumor grading was based on the revised 2016 WHO criteria.5,17 All patients underwent preoperative brain MRI, including conventional contrast-enhanced MR imaging, DWI, and/or 1H-MRS. The following were the exclusion criteria: a clinical history of other concurrent brain diseases, oncologic treatment before performing MR images, insufficient quality for MR images due to severe image artifacts, mixed histology grading (grade II-III). The flowchart for the screening of the study population is shown in Figure 1.
FIGURE 1.
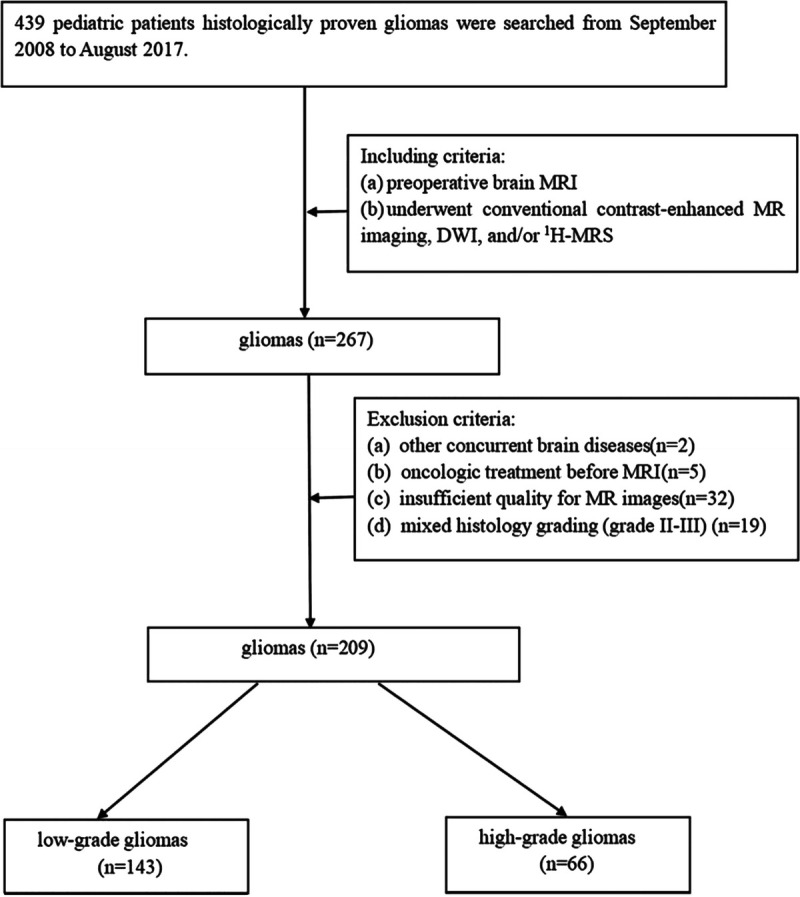
Flowchart shows the screening process.
Finally, a population of 209 patients (130 boys and 79 girls; age range: 1 month to 14 years; mean ± SD age: 4.75 ± 3.16 years) was enrolled in our retrospective study. Among these patients, 143 patients were pathologically diagnosed as having low-grade gliomas (WHO grade I, n = 115; WHO grade II, n = 28) and 66 patients as having high-grade gliomas (WHO grade III, n = 35; WHO grade IV, n = 31). WHO grade I: pilocytic astrocytoma (n = 112), subependymal giant cell astrocytoma (n = 3); WHO grade II: diffuse astrocytoma (n = 11), pilomyxoid astrocytoma (n = 14), oligoastrocytoma (n = 2), oligodendroglioma (n = 1); WHO grade III: anaplastic astrocytoma (n = 31), anaplastic oligoastrocytoma (n = 3), anaplastic oligodendroglioma (n = 1); WHO grade IV: diffuse midline glioma (n = 9), glioblastoma (n = 22).
Image Analysis
The MRI examinations were performed with either a 1.5-T MR or 3-T MR scanner (GE Signa), using an eight-channel phased array head coil. The conventional MR imaging sequences, including T1-weighted images (T1WI), were obtained with a repetition time/echo time (TR/TE) of 2200 ms/24 ms. The T2WI-fluid attenuated inversion recovery images were acquired with a TR/TE of 8000 ms/150 ms. Axial diffusion-weighted sequences were acquired in the axial plane before the injection of contrast material with a TR/TE of 5000 ms/70 ms. Diffusion-weighted imaging was performed with effective b values of 0 s/mm2 and 1000 s/mm2. Axial contrast-enhanced T1WI were acquired in three orthogonal directions after intravenous administration of 0.1 mmol/kg of gadolinium contrast with gadopentetate dimeglumine. Multivoxel water-suppressed chemical-shift imaging was performed using a water-suppressed point-resolved spectroscopy pulse sequence with a TR/TE of 1000 ms/144 ms.
All regions of interest (ROIs) were placed manually in the darkest region on ADC maps (Figs. 2A, 3A), corresponding to the tumor solid components, but excluding cystic, necrotic, and hemorrhagic areas. Meanwhile, circular shapes corresponding to ROIs were drawn on the contralateral normal-appearing brain parenchyma as a control. Each nonoverlapping ROI, drawn on over three different regions, ranged from 20 to 50 mm2. The average ADC and tumor/normal brain ADC ratios was calculated. The spectroscopy volumes of interest (VOIs) were carefully placed in the solid portion of the enhancing tumor region based on the contrast-enhanced T1WI images to avoid areas of necrosis and cysts (Figs. 2B, 3B). Metabolite peaks were assigned as follows: choline (Cho), 3.22 ppm; creatine (Cr), 3.02 ppm; N-acetylaspartate (NAA), 2.02 ppm; lactate (Lac), 1.33 ppm; lipid (Lip), 0.9 and 1.3 ppm. Sometimes, lactate and lipid peaks are difficult to differentiate because of overlap; however, when using a TE of 144 ms, the lactate peak inverts the resonance below the baseline and can be easily distinguished from lipid signals.18–20 The metabolite ratios of Cho/Cr, NAA/Cr, and NAA/Cho were automatically calculated using software (Figs. 2C, 3C). The data were measured and analyzed by 2 experienced pediatric neuroradiologists blinded to the pathologic diagnosis.
FIGURE 2.
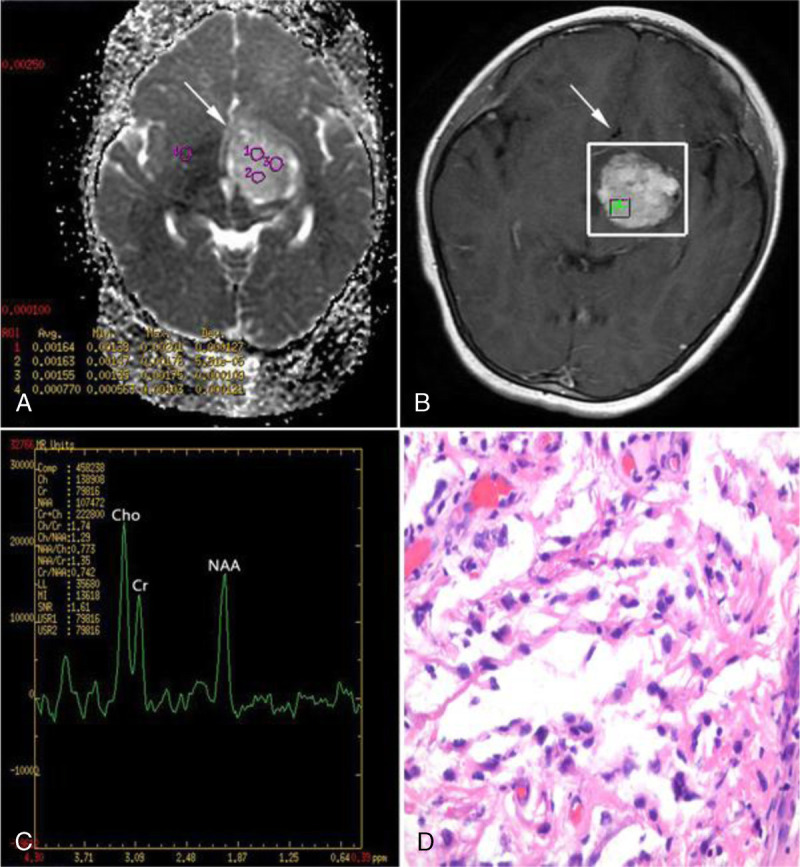
A 7-year-old girl with pilocytic astrocytoma (WHO grade I) in the left basal ganglia region. A, Axial ADC map reveals high ADC values. B and C, Spectrum analysis from the enhancing tumor area shows slightly increased Cho/Cr ratio, and slightly decreased NAA/Cr and NAA/Cho ratios. D, Hematoxylin-eosin staining (×400) of pilocytic astrocytoma demonstrates astrocytic cells with loose myxoid matrix and Rosenthal fibers.
FIGURE 3.
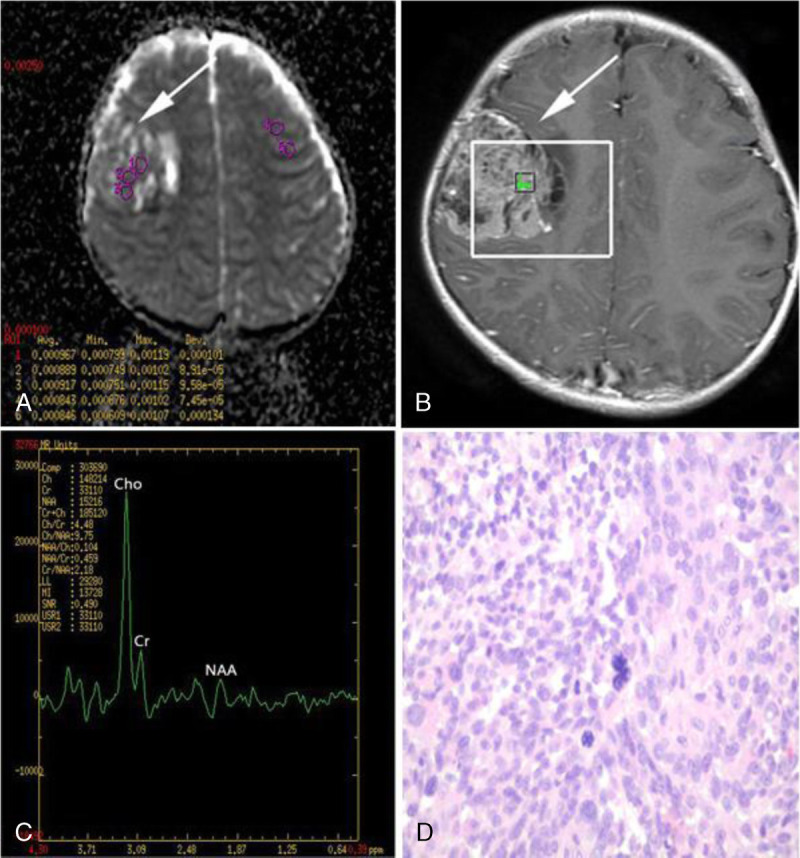
A 4-year-old girl with glioblastoma (WHO grade IV) in the right frontal lobe. A, Axial ADC map reveals low ADC values. B and C, Spectrum analysis from the enhancing tumor area shows markedly increased Cho/Cr ratio, and markedly decreased NAA/Cr and NAA/Cho ratios. D, Hematoxylin-eosin staining (×400) of glioblastoma displays pleomorphic tumor cells with prominent nuclear atypia and karyokinesis in high density, as well as several multinucleated cells.
Statistical analysis was performed using SPSS Statistics Version 21.0 (SPSS Institute, Chicago, IL). The mean ± standard deviation (mean ± SD) values of the ADC values (ADCmean, ADCmin, and ADC ratio) and metabolite ratios (Cho/Cr, NAA/Cr, and NAA/Cho) were calculated. The independent-samples t-test was used to compare the ADC values and metabolite ratios between LGGs and HGGs. Comparisons of the probability of the appearance of lactate and lipid peaks between LGGs and HGGs were analyzed with the χ2 test. To assess the relationship between the ADC values, metabolite ratios, and glioma grade, we used Spearman correlation analyses. Receiver operating characteristic (ROC) curve analysis was used to describe and compare the diagnostic performance of the ADC values and metabolite ratios. The threshold values based on the maximum Youden index (sensitivity + specificity − 1) and the resulting sensitivity, specificity, accuracy, PPV, and NPV of the ADC values and metabolite ratios were calculated. A P value less than 0.05 was considered statistically significant.
RESULTS
Comparison of the ADC Values Between Low-Grade and High-Grade Gliomas
The descriptive statistics comparing the ADC values between LGGs and HGGs are shown in Table 1. The ADCmean, ADCmin, and ADC ratio of HGGs were significantly lower than those of LGGs (1.133 ± 0.104 × 10⁻³ mm2/s vs 1.367 ± 0.195 × 10⁻³ mm2/s, P < 0.001; 0.921 ± 0.081 × 10⁻³ mm2/s vs 1.114 ± 0.126 × 10⁻³ mm2/s, P < 0.001; 1.294 ± 0.104 vs 1.577 ± 0.245, P < 0.001, respectively). No significant differences were found in the mean ADC values of the contralateral normal-appearing brain parenchyma between LGGs and HGGs (0.869 ± 0.033 × 10⁻³ mm2/s vs 0.875 ± 0.031 × 10⁻³ mm2/s, P = 0.189).
TABLE 1.
Comparison of the ADC Values Between Low-Grade and High-Grade Gliomas
| Low-Grade Group (n = 143) | High-Grade Group (n = 66) | P | |
|---|---|---|---|
| ADCmean (×10−3 mm2/s) | 1.367 ± 0.195 | 1.133 ± 0.104 | <0.001 |
| ADCmin (×10−3 mm2/s) | 1.114 ± 0.126 | 0.921 ± 0.081 | <0.001 |
| ADC ratio | 1.577 ± 0.245 | 1.294 ± 0.104 | <0.001 |
Comparison of the Metabolites Between Low-Grade and High-Grade Gliomas
Table 2 summarizes the differences in metabolite ratios between LGGs and HGGs. Cho/Cr ratio was significantly higher in HGGs than in LGGs (2.724 ± 1.382 vs 1.971 ± 0.742, P = 0.010). In contrast, both the NAA/Cr and NAA/Cho ratios were significantly lower in HGGs than in LGGs (0.626 ± 0.351 vs 1.084 ± 0.504, P < 0.001; and 0.258 ± 0.130 vs 0.612 ± 0.399, P < 0.001, respectively). Table 3 summarizes the differences in the probability of the presence of the lactate and lipid peaks between LGGs and HGGs, with a majority occurring in HGGs.
TABLE 2.
Comparison of 1H-MRS Metabolite Ratios Between Low-Grade and High-Grade Gliomas
| Low-Grade Group (n = 55) | High-Grade Group (n = 29) | P | |
|---|---|---|---|
| Cho/Cr | 1.971 ± 0.742 | 2.724 ± 1.382 | 0.010 |
| NAA/Cr | 1.084 ± 0.504 | 0.626 ± 0.351 | <0.001 |
| NAA/Cho | 0.612 ± 0.399 | 0.258 ± 0.130 | <0.001 |
TABLE 3.
Comparison of the Presence of Lactate and Lipid Peaks Between Low-Grade and High-Grade Gliomas [Number of Cases (%)]
| Presence | Low-Grade Group (n = 55) | High-Grade Group (n = 29) | P | |
|---|---|---|---|---|
| Lactate | Yes | 4/55 (7.3%) | 7/29 (24.1%) | 0.029 |
| No | 51/55 (92.7%) | 22/29 (75.9%) | ||
| Lipid | Yes | 6/55 (10.9%) | 9/29 (31.0%) | 0.022 |
| No | 49/55 (89.1%) | 20/29 (69.0%) |
Spearman Correlation Analysis of ADC Values, Metabolite Ratios, and Glioma Grade
Spearman correlation analysis revealed negative associations of ADCmean, ADCmin, and ADC ratio with glioma grade (r = −0.542, P < 0.001; r = −0.647, P < 0.001; r = −0.538, P < 0.001, respectively). There was a positive association of Cho/Cr with glioma grade (r = 0.245, P = 0.025). In contrast, there were negative associations of NAA/Cr and NAA/Cho with glioma grade (r = −0.493, P < 0.001; r = −0.668, P < 0.001, respectively).
Diagnostic Performance of ADC and Metabolite Ratios for Glioma Grading
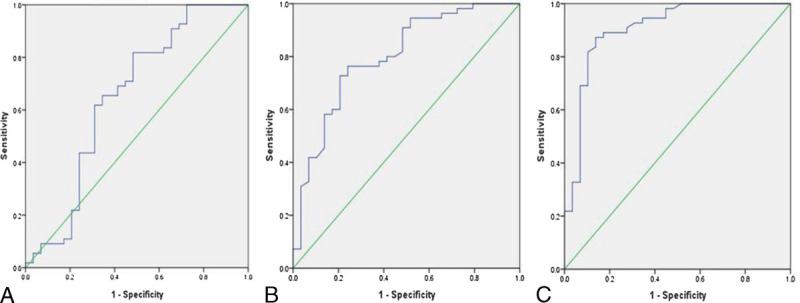
The abilities of the ADC values (Fig. 4) and metabolite ratios (Fig. 5) to differentiate glioma grades were calculated using ROC analysis. An ADCmean value threshold of 1.192 × 10⁻³ mm2/s differentiated LGGs from HGGs with 77.6% sensitivity, 80.3% specificity and 78.5% accuracy (AUC = 0.836, PPV = 89.5%, NPV = 62.4%); an ADCmin value threshold of 0.973 × 10⁻³ mm2/s had 86.0% sensitivity, 90.9% specificity and 87.6% accuracy (AUC = 0.902, PPV = 95.3%, NPV = 75.0%); an ADC ratio threshold of 1.384 had 73.4% sensitivity, 87.9% specificity and 78.0% accuracy (AUC = 0.834, PPV = 92.9%, NPV = 60.4%). The ROC analysis demonstrated that a threshold value of 2.601 for Cho/Cr had 81.8% sensitivity and 51.7% specificity (AUC = 0.649, PPV = 76.3%, NPV = 60.0%), a threshold value of 0.705 for NAA/Cr had 76.4% sensitivity and 75.9% specificity (AUC = 0.799, PPV = 85.7%, NPV = 62.9%), and a threshold value of 0.349 for NAA/Cho had 87.3% sensitivity and 86.2% specificity (AUC = 0.906, PPV = 92.3%, NPV = 78.1%) for differentiating LGGs and HGGs. The accuracy was 71.4% for Cho/Cr and 76.2% for NAA/Cr and 86.9% for NAA/Cho, respectively. The ROC results of the ADC values and metabolite ratios for differentiating LGGs and HGGs are given in Table 4.
FIGURE 4.
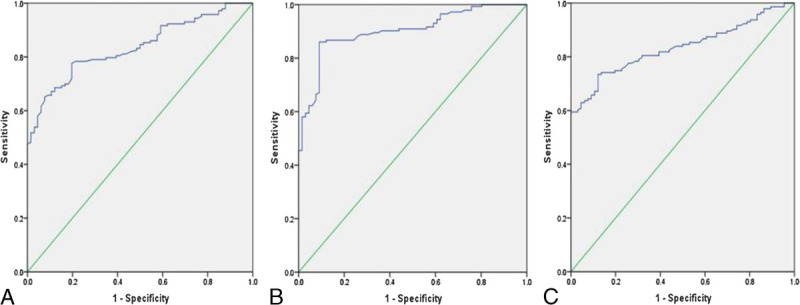
A, ROC curve of the ADCmean values. B, ROC curve of the ADCmin values. C, ROC curve of the ADC ratios.
FIGURE 5.
A, ROC curve of the Cho/Cr ratios. B, ROC curve of the NAA/Cr ratios. C, ROC curve of the NAA/Cho ratios.
TABLE 4.
ROC Results of the ADC Values and Metabolite Ratios for Glioma Grading
| Variables | Cutoff | Sensitivity (%) | Specificity (%) | Accuracy (%) | PPV (%) | NPV (%) | AUC |
|---|---|---|---|---|---|---|---|
| ADCmean | 1.192 × 10⁻³ mm2/s | 77.6 | 80.3 | 78.5 | 89.5 | 62.4 | 0.836 |
| ADCmin | 0.973 × 10⁻³ mm2/s | 86.0 | 90.9 | 87.6 | 95.3 | 75.0 | 0.902 |
| ADC ratio | 1.384 | 73.4 | 87.9 | 78.0 | 92.9 | 60.4 | 0.834 |
| Cho/Cr | 2.601 | 81.8 | 51.7 | 71.4 | 76.3 | 60.0 | 0.649 |
| NAA/Cr | 0.705 | 76.4 | 75.9 | 76.2 | 85.7 | 62.9 | 0.799 |
| NAA/Cho | 0.349 | 87.3 | 86.2 | 86.9 | 92.3 | 78.1 | 0.906 |
DISCUSSION
Conventional MRI technology can provide details of the tumors' anatomy, but it is always difficult and unreliable for predicting the grade of cerebral gliomas. Conventional MRI also cannot quantitatively capture tumor biology at molecular/cellular levels. Diffusion-weighted imaging is a noninvasive technique that provides diffusion information based on the Brownian movement of water molecules within the human brain tissue. The magnitude of restricted-water diffusion can be quantified by measuring the ADC. Current reports mostly concern the various methods of measuring mean tumor ADC (ADCmean), minimum tumor ADC (ADCmin), normalized tumor ADC (nADC), ADC histograms, and tumor/normal brain ADC ratio (ADC ratio) in the diagnosis of pediatric brain tumors.21,22
The ADC values correlates well with tumor cellularity for pediatric brain tumor grades, and lower ADC values show higher tumor grades.15,23 The DWI and ADC values have been used to predict the tendency of glioma grades. Arvinda et al24 examined 51 patients (age range, 28–58 years; median age, 40 years) with gliomas who underwent perfusion and diffusion MR imaging. They concluded that relative cerebral blood volume, ADC and ADC ratio alone or together were helpful in preoperative gliomas grading. In addition, Kang et al25 declared that histogram analysis based on ADC maps of the entire tumor volume is a useful tool for assessing glioma grade. However, other studies, such as Lam et al,26 concluded that there was no significant difference in ADC values between low- and high-grade gliomas. This discrepancy may be related to heterogeneous tumor structures in the glioma and the different methods used for measuring ADC values. The ROIs may be used to analyze ADCs of the enhancing part of the tumor, the entire volume of the tumor, or the darkest region of the tumor on the ADC map in the reports, each of which provides different information about the heterogeneity and tissue characteristics of the tumors. Provenzale et al27 considered whether the analyses of tumor ADCs excluded areas of necrosis, which may have resulted in the conflicting findings.
However, to date, few reports have been published to compare the sensitivity, specificity, accuracy, PPV, and NPV of DWI and proton MR spectroscopy in pediatric glioma grading. We concluded that the ADCmean, ADCmin, and ADC ratio had negative correlations with glioma grade. The main determinant of ADC was most likely the extracellular volume fraction and the restrictions from intact cellular membranes that impede water mobility.28,29 Apparent diffusion coefficient has been correlated with cell density and is considered the inverse index of tumor cellularity. Higher-grade lesions representing more densely packed brain tissue with higher cellularity, smaller extracellular space, and larger nuclear-to-cytoplasmatic ratio might have increasingly restricted diffusion.22,30
In this investigation, we retrospectively identified the thresholds that distinguished LGGs from HGGs. Consistent with previous reports,27,31 we found that the diagnostic ability of ADCmin was superior to that of ADCmean or ADC ratio in differentiating grades of brain gliomas. The ADCmin can reduce the possible microstructural variations within the glioma tissue, corresponding to the sites of highest tumor cellularity. Our study determined the ADCmin values by quantitatively exploring the region with the highest restriction within the solid components of the tumor, which may be the most physiologically meaningful measurement.
Proton magnetic resonance spectroscopy is a noninvasive imaging technique based on chemical shift that provides information on metabolic tissue composition within tissues in vivo. The MR spectroscopy has been used quite extensively for the grading of brain gliomas in adults in numerous studies.32–34 Fudaba et al34 evaluated the roles of pulsed arterial spin-labeling, diffusion tensor imaging, and MR spectroscopy for grading gliomas in 32 patients (age range, 16–82 years). They revealed that the combination of the minimum ADC and the Cho/Cr ratio could predict glioma grade. In our study, the HGGs had significantly higher Cho/Cr ratio and significantly lower NAA/Cr and NAA/Cho ratios than the LGGs; there was a tendency toward a positive association of Cho/Cr with glioma grade (r = 0.245, P = 0.025) and negative associations of NAA/Cr and NAA/Cho with glioma grade (r = −0.493, P < 0.001; r = −0.668, P < 0.001, respectively). These results are similar to the findings of other studies. Whereas our results showed that the low specificity of Cho/Cr, which indicated that the false-positive rate was comparatively high and the true-negative rate was correspondingly low. A possible explanation is that high levels of Cho are found at birth, and the Cho/Cr ratio decreased along with myelination in the first 2 to 3 years of life.35,36 There was a difference in age distribution of children younger than 3 years between LGGs (38.2%; 21 of 55 patients) and HGGs (20.7%; 6 of 29 patients) diagnosed on MRS. Moreover, Bowen suggested that glial neoplasms can occur without elevated Cho/Cr ratio.37 NAA/Cr and NAA/Cho were effective in differentiating LGGs from HGGs, and the diagnostic performance of the NAA/Cho ratio was slightly superior to that of the NAA/Cr ratio. It is possible to use NAA level as a diagnostic marker, as a lower concentration of NAA reflects a higher glioma grade. This is connected to the decrease in neuronal density, and it suggests that NAA-related metabolite ratios (NAA/Cr and NAA/Cho) might reflect the degree of tumor infiltration of brain tissue.32 Our study showed that the probability of the appearance of lactate and lipid peaks was more in HGGs than in LGGs (both P < 0.05). As the proliferation rate of an HGG rapidly increases, it can lead to increased levels of lactate and lipid due to regional hypoxia and tissue necrosis. These metabolic alterations are increased due to the higher grade of malignancy of the tumors.
We are aware of several limitations of our study, including the retrospective design, the differences in the data derived from different machines (1.5-T MR or 3.0-T MR scanner), the region of VOIs not including the contralateral normal-appearing brain tissue, and the histological heterogeneity of the tumors. However, Wang et al38 performed the meta-analysis to assess the diagnostic performance of MRS in differentiating HGGs from LGGs using metabolite ratios including Cho/Cr, Cho/NAA and NAA/Cr ratios, and suggested that there was no significant difference in diagnostic accuracy between the 1.5-T and 3.0-T MRS. Previous reports39–41 suggested that the ADC values were comparable in head and neck cancers when measured using 1.5-T and 3-T scanners. Their results allowed us to compare results among different sites and among different field strengths. Furthermore, in this investigation, ADC ratios were used to exclude the differences in signal-to-noise between examinations for better comparison. Because of the heterogeneity of gliomas, the manually chosen ROIs on ADC mapping and VOIs on MR spectroscopy are difficult to correspond to the representative regions of pathologic reports. Therefore, further investigations involving location-based approaches for radiopathological correlation might extend these results. Additionally, we did not match the age and sex before performing intergroup comparison, as a result our findings are preliminary, and this remains to be studied with future studies.
CONCLUSIONS
Overall, quantitative ADC values and 1H-MRS metabolites contributed noninvasively to the effective differentiation of LGGs from HGGs, and with ROC curve analysis, the cutoff values for glioma grading were obtained. The ADC, NAA/Cr, and NAA/Cho ratios have the potential to preoperatively assess the pathologic grades of pediatric gliomas.
Footnotes
R.Y. and A.C. contributed equally to this work and should be considered co-first authors.
H.Y. and B.J. contributed equally to this work and should be considered co-corresponding authors.
The authors declare no conflict of interest.
The study was approved by the Ethics Committee of Xin Hua Hospital affiliated to Shanghai Jiao Tong University School of Medicine. The informed consent was waived because this is a retrospective study. The ethic number is XHEC-D-2018-030.
This study was supported by the National Natural Science Foundation of China (grants 81871353, 81671679).
Contributor Information
Rong Yao, Email: yaorong871017@163.com.
Ailan Cheng, Email: chengailan2009@163.com.
Menglin Liu, Email: 591958372@qq.com.
Zhengwei Zhang, Email: 2262425076@qq.com.
Biao Jin, Email: jinbiao@xinhuamed.com.cn.
Hong Yu, Email: yuhongphd@163.com.
REFERENCES
- 1.Fontebasso AM, Bechet D, Jabado N. Molecular biomarkers in pediatric glial tumors: a needed wind of change. Curr Opin Oncol. 2013;25:665–673. [DOI] [PubMed] [Google Scholar]
- 2.Qaddoumi I, Sultan I, Gajjar A. Outcome and prognostic features in pediatric gliomas: a review of 6212 cases from the surveillance, epidemiology, and end results database. Cancer. 2009;115:5761–5770. [DOI] [PMC free article] [PubMed] [Google Scholar]
- 3.Louis DN Ohgaki H Wiestler OD, et al. The 2007 WHO classification of tumours of the central nervous system. Acta Neuropathol. 2007;114:97–109. [DOI] [PMC free article] [PubMed] [Google Scholar]
- 4.Omuro A, DeAngelis LM. Glioblastoma and other malignant gliomas: a clinical review. JAMA. 2013;310:1842–1850. [DOI] [PubMed] [Google Scholar]
- 5.Louis DN Perry A Reifenberger G, et al. The 2016 World Health Organization classification of tumors of the central nervous system: a summary. Acta Neuropathol. 2016;131:803–820. [DOI] [PubMed] [Google Scholar]
- 6.Wesseling P, Capper D. WHO 2016 classification of gliomas. Neuropathol Appl Neurobiol. 2018;44:139–150. [DOI] [PubMed] [Google Scholar]
- 7.Sturm D, Pfister SM, Jones DTW. Pediatric gliomas: current concepts on diagnosis, biology, and clinical management. J Clin Oncol. 2017;35:2370–2377. [DOI] [PubMed] [Google Scholar]
- 8.Stokland T Liu JF Ironside JW, et al. A multivariate analysis of factors determining tumor progression in childhood low-grade glioma: a population-based cohort study (CCLG CNS9702). Neuro-Oncology. 2010;12:1257–1268. [DOI] [PMC free article] [PubMed] [Google Scholar]
- 9.Vöglein J Tüttenberg J Weimer M, et al. Treatment monitoring in gliomas: comparison of dynamic susceptibility-weighted contrast-enhanced and spectroscopic MRI techniques for identifying treatment failure. Investig Radiol. 2011;46:390–400. [DOI] [PubMed] [Google Scholar]
- 10.Wang W, Steward CE, Desmond PM. Diffusion tensor imaging in glioblastoma multiforme and brain metastases: the role of p, q, L, and fractional anisotropy. AJNR Am J Neuroradiol. 2009;30:203–208. [DOI] [PMC free article] [PubMed] [Google Scholar]
- 11.Jones TL Byrnes TJ Yang G, et al. Brain tumor classification using the diffusion tensor image segmentation (D-SEG) technique. Neuro-Oncology. 2015;17:466–476. [DOI] [PMC free article] [PubMed] [Google Scholar]
- 12.Tian H Gou Y Pan Y, et al. Quality appraisal of clinical practice guidelines on glioma. Neurosurg Rev. 2015;38:39–47. [DOI] [PubMed] [Google Scholar]
- 13.Al-Okaili RN Krejza J Woo JH, et al. Intraaxial brain masses: MR imaging-based diagnostic strategy—initial experience. Radiology. 2007;243:539–550. [DOI] [PubMed] [Google Scholar]
- 14.Goebell E Fiehler J Ding XQ, et al. Disarrangement of fiber tracts and decline of neuronal density correlate in glioma patients a combined diffusion tensor imaging and 1H-MR spectroscopy study. AJNR Am J Neuroradiol. 2006;27:1426–1431. [PMC free article] [PubMed] [Google Scholar]
- 15.Poretti A Meoded A Cohen KJ, et al. Apparent diffusion coefficient of pediatric cerebellar tumors: a biomarker of tumor grade? Pediatr Blood Cancer. 2013;60:2036–2041. [DOI] [PubMed] [Google Scholar]
- 16.Panigrahy A, Nelson MD, Jr., Blüml S. Magnetic resonance spectroscopy in pediatric neuroradiology: clinical and research applications. Pediatr Radiol. 2010;40:3–30. [DOI] [PubMed] [Google Scholar]
- 17.Gupta A, Dwivedi T. A simplified overview of World Health Organization classification update of central nervous system tumors 2016. J Neurosci Rural Pract. 2017;8:629–641. [DOI] [PMC free article] [PubMed] [Google Scholar]
- 18.Muñoz-Hernández MC, García-Martín ML. In vivo (1)h magnetic resonance spectroscopy. Methods Mol Biol. 1718;2018:151–167. [DOI] [PubMed] [Google Scholar]
- 19.Bertholdo D, Watcharakorn A, Castillo M. Brain proton magnetic resonance spectroscopy: introduction and overview. Neuroimaging Clin N Am. 2013;23:359–380. [DOI] [PubMed] [Google Scholar]
- 20.Cecil KM. Proton magnetic resonance spectroscopy: technique for the neuroradiologist. Neuroimaging Clin N Am. 2013;23:381–392. [DOI] [PMC free article] [PubMed] [Google Scholar]
- 21.Pierce T Kranz PG Roth C, et al. Use of apparent diffusion coefficient values for diagnosis of pediatric posterior fossa tumors. Neuroradiol J. 2014;27:233–244. [DOI] [PMC free article] [PubMed] [Google Scholar]
- 22.Jaremko JL Jans LB Coleman LT, et al. Value and limitations of diffusion-weighted imaging in grading and diagnosis of pediatric posterior fossa tumors. AJNR Am J Neuroradiol. 2010;31:1613–1616. [DOI] [PMC free article] [PubMed] [Google Scholar]
- 23.Koob M Girard N Ghattas B, et al. The diagnostic accuracy of multiparametric MRI to determine pediatric brain tumor grades and types. J Neuro-Oncol. 2016;127:345–353. [DOI] [PubMed] [Google Scholar]
- 24.Arvinda HR Kesavadas C Sarma PS, et al. Glioma grading: sensitivity, specificity, positive and negative predictive values of diffusion and perfusion imaging. J Neuro-Oncol. 2009;94:87–96. [DOI] [PubMed] [Google Scholar]
- 25.Kang Y Choi SH Kim YJ, et al. Gliomas: histogram analysis of apparent diffusion coefficient maps with standard- or high-b-value diffusion-weighted MR imaging—correlation with tumor grade. Radiology. 2011;261:882–890. [DOI] [PubMed] [Google Scholar]
- 26.Lam WW, Poon WS, Metreweli C. Diffusion MR imaging in glioma: does it have any role in the pre-operation determination of grading of glioma? Clin Radiol. 2002;57:219–225. [DOI] [PubMed] [Google Scholar]
- 27.Provenzale JM, Mukundan S, Barboriak DP. Diffusion-weighted and perfusion MR imaging for brain tumor characterization and assessment of treatment response. Radiology. 2006;239:632–649. [DOI] [PubMed] [Google Scholar]
- 28.Gimi B Cederberg K Derinkuyu B, et al. Utility of apparent diffusion coefficient ratios in distinguishing common pediatric cerebellar tumors. Acad Radiol. 2012;19:794–800. [DOI] [PubMed] [Google Scholar]
- 29.Murakami R Hirai T Sugahara T, et al. Grading astrocytic tumors by using apparent diffusion coefficient parameters: superiority of a one- versus two-parameter pilot method. Radiology. 2009;251:838–845. [DOI] [PubMed] [Google Scholar]
- 30.Choi HS Kim AH Ahn SS, et al. Glioma grading capability: comparisons among parameters from dynamic contrast-enhanced MRI and ADC value on DWI. Korean J Radiol. 2013;14:487–492. [DOI] [PMC free article] [PubMed] [Google Scholar]
- 31.Zhang L Min Z Tang M, et al. The utility of diffusion MRI with quantitative ADC measurements for differentiating high-grade from low-grade cerebral gliomas: evidence from a meta-analysis. J Neurol Sci. 2017;373:9–15. [DOI] [PubMed] [Google Scholar]
- 32.Bulik M Jancalek R Vanicek J, et al. Potential of MR spectroscopy for assessment of glioma grading. Clin Neurol Neurosurg. 2013;115:146–153. [DOI] [PubMed] [Google Scholar]
- 33.Caulo M Panara V Tortora D, et al. Data-driven grading of brain gliomas: a multiparametric MR imaging study. Radiology. 2014;272:494–503. [DOI] [PubMed] [Google Scholar]
- 34.Fudaba H Shimomura T Abe T, et al. Comparison of multiple parameters obtained on 3T pulsed arterial spin-labeling, diffusion tensor imaging, and MRS and the Ki-67 labeling index in evaluating glioma grading. AJNR Am J Neuroradiol. 2014;35:2091–2098. [DOI] [PMC free article] [PubMed] [Google Scholar]
- 35.Costa MO Lacerda MT Garcia Otaduy MC, et al. Proton magnetic resonance spectroscopy: normal findings in the cerebellar hemisphere in childhood. Pediatr Radiol. 2002;32:787–792. [DOI] [PubMed] [Google Scholar]
- 36.Hashimoto T Tayama M Miyazaki M, et al. Developmental brain changes investigated with proton magnetic resonance spectroscopy. Dev Med Child Neurol. 1995;37:398–405. [DOI] [PubMed] [Google Scholar]
- 37.Bowen BC. Glial neoplasms without elevated choline-creatine ratios. AJNR Am J Neuroradiol. 2003;24:782–784. [PMC free article] [PubMed] [Google Scholar]
- 38.Wang Q Zhang H Zhang J, et al. The diagnostic performance of magnetic resonance spectroscopy in differentiating high-from low-grade gliomas: a systematic review and meta-analysis. Eur Radiol. 2016;26:2670–2684. [DOI] [PubMed] [Google Scholar]
- 39.Chawla S Kim S Wang S, et al. Diffusion-weighted imaging in head and neck cancers. Future Oncol. 2009;5:959–975. [DOI] [PMC free article] [PubMed] [Google Scholar]
- 40.Kim S Loevner L Quon H, et al. Diffusion-weighted magnetic resonance imaging for predicting and detecting early response to chemoradiation therapy of squamous cell carcinomas of the head and neck. Clin Cancer Res. 2009;15:986–994. [DOI] [PMC free article] [PubMed] [Google Scholar]
- 41.Lee J Choi SH Kim J, et al. Glioma grading using apparent diffusion coefficient map: application of histogram analysis based on automatic segmentation. NMR Biomed. 2014;27:1046–1052. [DOI] [PubMed] [Google Scholar]